A
r
ti
c
le
0103 - 5053 $6.00+0.00
*e-mail: [email protected]
Fatty Acid Contents of Brazilian Soybean Oils with Emphasis on
trans
Fatty Acids
Clayton Antunes Martin, Jesuí Vergílio Visentainer, Adriana Nery de Oliveira,
Claudio Celestino de Oliveira, Makoto Matsushita and Nilson Evelázio de Souza*
Departamento de Química, Universidade Estadual de Maringá, Av. Colombo, 5790, 87020-900 Maringá-PR, Brazil
As composições em ácidos graxos das principais marcas de óleo de soja consumidas pelos brasileiros foram determinadas. Em média os níveis de ácidos graxos trans (TFA) variaram entre 0,8 e 2,6% do total de ácidos graxos e compreendem os isômeros 18:1, 18:2, e 18:3. Os níveis de TFA 18:1 foram menores que 0,1% em todas as marcas estudadas. Entre os TFA poliinsaturados, 18:3 foi o predominante, com níveis variando de 0,5 a 1,4%. Este grupo compreende ácidos graxos mono e di-trans e o principal foi o 18:3 9c, 12c, 15t. As quantidades de TFA 18:2 variaram de 0,3 a 1,1% com predominância do ácido 18:2 9c, 12t. Teores do ácido alfa-linolênico variaram de 3,5 a 5,4%, com um valor médio de 4,1%. O grau de isomerização dos ácidos linoléico e alfa-linolênico variaram de 0,5 a 2,1% e de 9,1 a 27,2%, respectivamente. Este estudo indica que provavelmente o tratamento térmico aplicado durante o passo de desodorização dos óleos nos últimos anos foi intenso, resultando em uma diminuição significativa do teor de ácido alfa-linolênico no óleo e, em um aumento na razão n-6/n-3 da dieta dos brasileiros.
The fatty acid composition of the main soybean oil brands consumed by the Brazilian has been determined. The mean trans fatty acids (TFA) levels ranged between 0.8 and 2.6% of the total fatty acids and comprised 18:1, 18:2, and 18:3 isomers. 18:1 TFA levels were lower than 0.1% in all the studied brands. Among the polyunsaturated TFA, 18:3 predominated, with levels ranging from 0.5 to 1.4%. This group comprised mono and di-trans fatty acids and the main acid was 18:3 9c,12c,15t. The amounts of 18:2 TFA ranged from 0.3 to 1.1% with a predominance of acid 18:2 9c,12t . Alpha-linolenic acid contents ranged from 3.5 to 5.4%, with a mean value of 4.1%. The degree of isomerization of linoleic and alpha-linolenic acids ranged from 0.5 to 2.1% and from 9.1 to 27.2%, respectively. This study probably indicates that the thermal treatment ap-plied to soybean oil during the deodorization step in the last years is too intense and that it results in a significant decrease in oil alpha-linolenic acid content and an increase in the n-6/n-3 ratio in the Brazilian diet.
Keywords:trans fatty acids, soybean oils, degree of isomerization
Introduction
In the last decades, soybean has been the most con-sumed oil in many countries. Brazil has contributed to this consumption in a great deal, as it is responsible for 22% of the world soybean production, which makes it the second largest soybean oil producer and exporter.1 Due to the fact that its alpha-linolenic (18:3 9c,12c,15c) level usually ranges from 5.0 to 7.0% of the total fatty acids,2,3 soybean oil is an important daily source of this acid. It also has a
significant effect on the n-6/n-3 fatty acids ratio of the diet of many people.
Refining of soybean oil includes degumming, neutra-lization, bleaching, and deodorization steps. Isomerization reactions carried out during the deodorization step may reduce alpha-linolenic acid levels significantly. A raise in temperature increases the rate of these reactions.4 Conse-quently, the oil trans fatty acid (TFA) levels increase.
that have only one unsaturation, which is necessarily in thetrans form.Trans polyunsaturated fatty acids (TPFA) also belong to this class of isomers, and similarly to their
ciscounterparts, have two or more unsaturations, either alltrans or not.
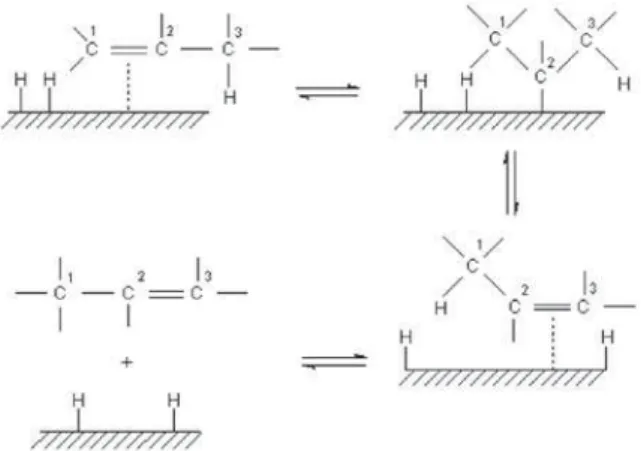
While TMFA are generally produced by hydrogenation of vegetable oils (Figure 1) or biohydrogenation in rumminants, TPFA are formed as a result of deodorization of oils4 or frying treatments.5 Intake of foods containing high TMFA amounts has been associated with the risk of development of cardiovascular disease,3,6,7 due to the hazardous effects of these fatty acids on plasma lipoproteins that increase low density lipoprotein (LDL-c) and lipoprotein [a] levels and decrease the levels of high density lipoprotein (HDL-c).
Although it has been observed that the daily intake of 1.4 g of TPFA 18:3 does not cause significant changes in the LDL-c and HDL-c plasma levels, a significant increase in the LDL-c/HDL-c ratio has been associated to the con-sumption of these isomers.8 This ratio is one of the main indicators of cardiovascular disease risk and thus a high TPFA intake may contribute to its increase.
The object of this study is to investigate the fatty acid composition of the soybean oil brands most consumed by the Brazilian population in the last two years with emphasis on TPFA, and alpha-linolenic acid.
Experimental
Sampling
Five soybean oil brands of major Brazilian oil processing companies were analyzed. The brands were labeled A, B, C, D, and E and were evaluated in six brand lots between September 2003 and October 2005. Each lot was analyzed separately and in triplicate.
Analysis
The preparation of fatty acid methyl esters (FAME) was carried out according to the methods proposed by Hart-man and Lago.9 The amount of 30 o 1 mg of soybean oil was weighed in a test tube and the lipids were saponified in 0.5 mol L-1 sodium hydroxide in methanol and esteri-fied with a mixture of ammonium chloride, methanol, and sulfuric acid at 1:30:1.5 (m/v/v). After the addition of the saturated sodium chloride solution, the FAME was ex-tracted with 1 mL n-heptane. FAME were separated in a gas chromatographer 14-A (Shimadzu, Japan) equipped with a fused silica capillary column CP Sil-88 (50m r 0.25 mm i.d.,r 0.25 Mm biscyanopropyl polysiloxane) and a flame ionization detector. The gas flow rates used were 1.2 mL min-1carrier gas (H
2), 30 mL min
-1 make-up gas (N 2), and 30 and 300 mL min-1 flame gases (H
2 and synthetic air, respectively). Sample splitting rate was 1:50. The column was heated to 170 ºC in 14 minutes and then the tempera-ture was raised to 225 at 15 ºC min-1. Injector and detector temperatures were 225 ºC and 245 ºC min-1, respectively. Samples (2 ML) were injected. Peak areas were determined by an Integrator-Processor CG-300 (Instrumentos Científi-cos CG). The results are expressed as relative area percen-tages. TPFA 18:2 and 18:3 were identified with FAME of isomerized linseed oil prepared according to Grangirard
et al.10Elution order of the 18:2 and 18:3 trans isomers in this reference mixture was based on equivalent chain length (ECL) values determined by Wolff11 for CP Sil-88 column. FAME mixture standard 189-19 (Sigma) and vaccenic acid methyl ester standard (Sigma) were used for identification of others fatty acids contained in oil. ECL values were de-termined for all analyzed acids using a method described by Ackman12 with methyl esters of 16:0, 18:0, and 20:0 as reference compounds.
Degree of isomerization
The degree of isomerization (DI) of linoleic (18:2 9c,12c) and alpha-linolenic acid (18:3 9c,12c,15c) were determined by the ratio between the trans forms and total
cis and trans forms:
Statistics
The means were compared by variance analysis (ANOVA) with 5% significance level with Tukey’s test. The significance of the relations between fatty acids was examined by correla-tion analysis. P value a 0.05 was considered significant and
are represented by different letters for results presented in the same line in Tables 1 and 2. All statistical analyses were performed with Statistica 5.0 software.13
Results and Discussion
Table 1 contains the fatty acid composition of the studied
soybean oil brands. The predominant saturated fatty acids were palmitic (16:0) and stearic. Arachidic (20:0) and behenic (22:0) acids were also detected. The detected levels of palmitic acid were between 11.31 and 11.77% and no significant difference (P > 0.05) were observed among the samples as evidenced by the Tukey’s test (a letter for all values of Table 1, line 2). Stearic acid levels ranged from 3.23 to 3.83% and the value
Table 1. Fatty acid composition of Brazilian soybean oil brands1
Fatty acids Brands
A B C D E
16:0 11.77 o 0.96a 11.29o 0.91a 11.46o 0.78a 11.31o 0.50a 11.62o 0.76a
18:0 3.23 o 0.37a 3.77 o 0.46b 3.83 o 0.44b 3.60 o 0.37ab 3.76 o 0.79b
18:1t2 0.07 o 0.02a 0.04 o 0.03b 0.05 o 0.01b 0.03 o 0.01b 0.04 o 0.02b
18:1 9c 22.27 o 2.28a 23.43o 1.00ab 24.75o 2.50b 22.32o 1.64a 22.75o 1.34a
18:1 11c 1.54 o 0.36a 1.42 o 0.25a 1.48 o 0.48a 1.50 o 0.31a 2.23 o 0.74b
18:2 9c,12t 0.66 o 0.24a 0.26 o 0.11bc 0.37 o 0.20c 0.15 o 0.08b 0.32 o 0.26bc
18:2 9t,12c 0.56 o 0.21a 0.22 o 0.10bc 0.30 o 0.16c 0.12 o 0.08b 0.30 o 0.22bc
18:2 9c,12c 53.52 o 1.75ac 52.51o 0.72abc 51.29o 1.95b 53.80o 1.06c 52.39o 1.56ab
20:0 0.26 o 0.06a 0.38 o 0.09b 0.35 o 0.09bc 0.27 o 0.06a 0.28 o 0.08a
18:3 9t,12c,15t 0.12 o 0.08a 0.03 o 0.02b 0.08 o 0.06ab ND 0.07 o 0.05b
18:3 9c,12c,15t 0.67 o 0.21a 0.33 o 0.12bc 0.45 o 0.11b 0.26 o 0.10c 0.42 o 0.19b
18:3 9t,12c,15c3 0.69 o 0.21a 0.32 o 0.11bc 0.41 o 0.13b 0.25 o 0.11c 0.40 o 0.22b
18:3n-3 3.47 o 0.50a 4.73 o 0.91c 4.09 o 0.51ac 5.42 o 0.68b 4.39 o 0.79c
20:1n-9 0.20 o 0.04a 0.21 o 0.05ab 0.26 o 0.07b 0.19 o 0.07a 0.22 o 0.09ab
22:0 0.40 o 0.07a 0.50 o 0.06b 0.45 o 0.09ab 0.43 o 0.05a 0.46 o 0.07a 1The values are means o S.D. of 6 cans analyzed in triplicate. Results expressed as percentage of total fatty acid methyl esters. Means followed by different letters on the same line are significantly different (P < 0.05) in Tukey’s test. ND = not detected. Other fatty acids with levels lower than 0.1% include 14:0, 16:1, 20:2, 22:1, 24:0, and unidentified fatty acids.2Comprises isomers 18:1 9t and 18:1 11t.3Comprises isomers 18:3 9c,12t,15c.
Table 2. Total fatty acids, degree of isomerization, and n-6/n-3 ratio of the studied soybean oil brands
Brands
A B C D E
18:2t 1.13 o 0.41a 0.48 o 0.21bc 0.67 o 0.36b 0.28 o 0.16c 0.59 o 0.47bc
18:3t 1.38 o 0.48a 0.68 o 0.26bc 0.93 o 0.29b 0.52 o 0.22c 0.88 o 0.46b
18:31 4.96 o 0.20a 5.41 o 0.68b 5.02 o 0.39ab 5.93 o 0.49c 5.27 o 0.41ab
SFA 15.67o 0.64ab 15.94 o 0.49ab 16.09o 0.53a 15.61o 0.43b 16.10o 0.27a
MUFA 24.01o 1.96a 25.06 o 0.85ab 26.50o 2.34b 24.00o 1.63a 25.20o 1.44ab
PUFA 56.99o 1.87a 57.24 o 1.06a 55.38o 2.05b 59.23o 1.65c 56.78o 1.16ab
TPFA 2.51 o 0.87a 1.16 o 0.46bc 1.60 o 0.64b 0.80 o 0.37c 1.47 o 0.93b
TFA 2.58 o 0.88a 1.20 o 0.47bc 1.64 o 0.64b 0.83 o 0.37c 1.51 o 0.94b
DI 18:2 (%) 2.08 o 0.75a 0.90 o 0.37bc 1.27 o 0.64b 0.53 o 0.30c 1.10 o 0.86b
DI 18:3 (%) 27.18o 9.35a 13.17 o 6.26bc 18.65o 6.25b 9.06 o 4.46c 17.18o 9.97b
n-6/n-32 14.76o 1.90a 11.50 o 2.26bc 12.73o 1.71b 10.10o 1.20c 12.38 o 2.74b
obtained for brand A was significantly lower (P > 0.05) than those of brands B, C, and E.
Monounsaturatedcisfatty acids comprised oleic (18:1 9c),
cis-vaccenic (18:1 11c), and gondoic (20:1 11c) acids. Oleic acid levels ranged from 22.27 to 24.75% and the value ob-tained for brand C was significantly higher (P < 0.05) than those obtained for brands A, D, and E. These values were close to the ones obtained by Wolff,3 who detected oleic acid levels ranging from 18.9 to 23.9% when he analyzed English and Belgian soybean oil brands. The levels of cis-vaccenic acid ranged from 1.42 to 2.23%. Brand E exhibited a significantly higher value (P < 0.05) than the other brands did.
As for the polyunsaturated fatty acids, linolenic acid (18:2 9c,12c) levels ranged between 51.29 and 53.80%, with a significantly lower value (P < 0.05) observed for brand C in comparison with brands A and D. Values between 3.47 and 5.42% were obtained for alpha-linolenic acid (18:3 9c,12c,15c) levels, with a significantly higher value (P < 0.05) for brand D. Alpha-linolenic acid levels presented a wide variation, which was not observed for the other fatty acids determined. This can be attributed to the variability associated to the intensity of the thermal treatment employed in the oil deodorization step. Temperatures higher than 220 ºC contribute strongly to the isomerization of alpha-linolenic acid.7
Monounsaturated and polyunsaturated TFA were found in all the studied brands. The TFA 18:1 levels obtained were very low, with values lower than 0.1%. The levels verified for linoleic acid geometric isomers ranged from 0.15 to 0.66% (18:2 9c,12t) and from 0.12 to 0.56% (18:2 9t,12c). 18:3 TFAs comprised mainly mono-trans isomers, with levels ranging between 1.4 and 0.5%. Between 92 and 100% of all the TFA were mono-trans isomers. 18:3 9t,12c,15t
acid was detected in almost all the brands, except for brand E, whose levels ranged from 0.03 to 0.12%.
Table 2 gives the total fatty acids and the degree of isomerization of the linoleic and alpha-linolenic acids. The total TFA found in the soybean oil ranged between 0.83 and 2.58%, with 18:2 and 18:3 TFA levels ranging between 0.28 and 1.13% and 0.52 and 1.38%, respectively. A significantly higher value (P < 0.05) was obtained for brand A. Although the levels of linoleic acid found in soybean oil are much higher than those of alpha-linolenic acid, higher concentra-tions of 18:3 TFA were observed in all studied brands. This occurs because the bonds of alpha-linolenic acid are more labile than those of linoleic acid, which results in a 25-fold larger isomerization selectivity for 18:3 9c,12c,15c acids if deodoration is performed at 200 ºC, or 12-fold larger if performed at 260 ºC, as determined by Hénon et al.4
The total level of alpha-linolenic acid and its geometric isomers ranged from 4.96 to 5.96% (Table 2). These levels
are lower than those observed by Karabulat et al.,14 who obtained 6.8% when studying soybean oil produced in Turkey. Wolff3obtained 18:3 levels ranging between 6.4 and 8.3 for Belgian soybean brands, 7.5% for German brands, and 7.2% for English brands. As for soybean oil produced in the USA, levels between 6.0 and 7.6 were found by Enig et al.2 Comparison of these results with the ones of this study indicates that Brazilian soy contains less alpha-linolenic acid. This might be the result of seasonal differences and of the development of new species. It have been observed in studies with other oilseeds, such as canola and linseed, that climatic factors have an effect on linolenic-acid levels.15
The 18:2 9c,12c/18:3 9c,12c,15c(n-6/n-3) ratio ranged between 10.10 and 14.76. A significantly lower value (P < 0.05) was obtained for brand D in comparison with A, C, and E. When the trans isomers were added to the total n-6 and n-3 fatty acids the n-6/n-3 ratio ranged from 9.1 to 10.8. These values correspond to the n-6/n-3 ratio of soybean oil previous to deodoration, since degumming, bleaching, and neutralization do not have a significant ef-fect on TFA formation16 as the temperature in these steps does not usually exceed 120 ºC.
The degree of isomerization of linoleic and alpha-linolenic acids ranged from 0.53 to 2.08% and from 9.06 to 27.18%, respectively. These results were similar to those obtained by Wolff11 for oil brands available in France. His studies led to values ranging between 0.2 and 2.0, and 2.3 and 27.2 for the degrees of isomerization of linoleic and alpha-linolenic acids, respectively. The results obtained in a study carried out by Wolff3 with soybean oil from Belgium, Germany, and England indicated that the degree of isomerization ranged from 1.2 to 1.7 for linoleic acid and from 6.3 to 22.6% for linolenic acid. As alpha-linolenic acid is more labile than linoleic acid, its degree of isomerization is an important indicator of the intensity of the thermal treatment applied to soybean oil in the de-odoration step.
show-Table 3. Correlations between the main fatty acids contained in soybean oil
correlations r p correlations r p
18:0; 16:0 -0.78 0.0000 18:2;18:1 n-9 -0.91 0.0000
18:1 n-9; 16:0 -0.63 0.0002 18:3; 18:1 n-9 -0.14 0.4486
18:2; 16:0 0.57 0.0010 18:2; 18:3 0.03 0.8769
18:3; 16:0 -0.50 0.0049 18:2t; 18:3t 0.98 0.0000
18:1 n-9; 18:0 0.70 0.0000 18:2 n-6; 18:2t 0.17 0.3626
18:2; 18:0 -0.82 0.0000 18:3 n-3; 18:3t -0.86 0.0000
18:3; 18:0 0.32 0.0863 ID 18:2; ID 18:3 0.97 0.0000
ing that the isomerization of linoleic and alpha-linoleic acids is favored by the same factors.
Figure 2 shows the total TFA contained in each lot of the studied brands. The values obtained for brand A in lots 1, 2, and 6 were between 3.19 and 3.76% of the total fatty acids, which are the highest TFA levels obtained in this study. Similar TFA levels were observed by Tang,17 who obtained values ranging between 1.6 and 3.8% for soybean oil brands available in Malaysia. A relevant decrease in the TFA levels was observed in brands B, C, and E from lots 3 and 4 on. These lots were produced between 3 and 6 months after the announcement made by the Brazilian Health Ministry that TFA concentrations should be indicated on food product labels.18 This shows the importance of governmental actions on the improvement of product quality. Fluctuations in the conditions of industrial processing such as temperature, vacuum, humidity and different sample origin can promote variations in the TPFA concentrations.
Although the limits of TFA levels in refined vegetable oils have not been clearly determined, oils presenting levels under 1.0-1.5% are considered good.19 A TFA limit of 2.0% of the total fatty acids has been set for food products in Denmark.20 The Brazilian legislation establish that oils with lower than 0.2 g of TFA/portion can be labeled as
free of TFA, but did not define the mass of a portion. The limit corresponds to 1% of the total calories that a person should consume in one day (2000 kcal) considering that fat has 9 kcal g-1. From the oils analyzed in this study, only brand D exhibited TFA levels lower than 1.5% in all the studied lots. Brand B presented the second lowest levels, with values lower than 2.0%.
Conclusions
Results indicate that probably of the thermal treat-ment applied to soybean oil during the deodorization step has been too intense in the last years leading to the high degree of isomerization of alpha-linolenic acid in lots 1 and 2 of most of the analyzed brands. The hypothesis is reinforced mainly when it is taken into account that the literature has showed that natural vegetable oils did not contain significant concentration of TPFA before the in-dustrialization process. The isomerization contributes to a significant reduction of the daily intake of alpha-linolenic acid, since soybean oil is one of the main sources of this acid for the Brazilian population. Furthermore, it results in a larger TPFA intake and in an increase in the n-6/n-3 ratio of the diet. The law regulating the indication of TFA concentration on food product labels has brought positive results as it led to a reduction of the TPFA levels of most of the analyzed brands.
Acknowledgments
The authors are grateful to CAPES, CNPq, and Funda-ção Araucária for the financial support.
References
1. Turatti, J. M.; Gomes, R. A. R.; Athié, I.; Lipídeos: Aspectos
Fun-cionais e Novas Tendências, Ed. UNICAMP: Campinas, 2002.
2. Enig, M. G.; Pallansch, L. A.; Sampugna, J.; Keeney, M.;
J. Am. Oil Chem. Soc.1983,60, 1788.
3. Wolff, R. L.; J. Am. Oil Chem. Soc.1993,70, 219.
4. Hénon, G.; Kemény, Z.; Recseg, K.; Zwobada, F.; Kovari, K.;
J. Am. Oil Chem. Soc.1996,76, 73.
5. Sanibal, E. A. A.; Mancini-Filho, J.; Ciênc. Tecnol. Aliment.
2004,24, 27.
6. Ascherio, A.; Katan, M. B.; Zock, P. L.; Stampfer, M. J.; Willett,
W. C.; N. Engl. J. Med.1999,340, 1994.
7. Hunter, J. E.; Nutr. Res.2005, 25, 499.
8. Vermunt, S. H.; Beaufrère, B.; Riemersma, R. A.; Sebédio, J. L.;
Chardigny, J. M.; Mensink, R. P.; Br. J. Nutr.2001,85, 387.
9. Hartman, L.; Lago, R. C.; Lab. Pract.1973,22, 475.
10. Grangirard, A.; Prevost, F. J.; Sebedio, J. L.; J. Am. Oil Chem.
Soc.1987, 64, 1434.
11. Wolff, R. L.; J. Am. Oil Chem. Soc.1992,69, 106.
12. Ackman, R. G.; Progr. Chem. Fats Lipids1972,12, 165.
13. StatSoft, Statistica 5.1 software; Tucksa, USA, 1996.
14. Karabulut, I.; Kayahan, M.; Yaprak, S.; Food Chem. 2003,81, 453.
15. Kris-Etherton, P. M.; Taylor, D. S.; Yu-Poth, S.; Huth, P.;
Moriarty, K.; Fishell, V.; Hargrove, R. L. R. L.; Zhao, G.;
Etherton, T. D.; Am. J. Clin. Nutr.2000,71, 179S.
16. Tasan, M.; Dermici, M.; J. Am. Oil Chem. Soc.2003,80, 825.
17. Tang, T. S.; J. Oil Palm Res.2002,14, 1.
18. ANVISA-Agência Nacional de Vigilância Sanitária;
Resolução-RDC no 360, de 23 de dezembro de 2003 (Administrative Rules RDC No. 360, December 23, 2003). http://e-legis.anvisa.gov. br/leisref/public
19. Dionisi, F.; Golay, P. A.; Fay, L. B.; Anal. Chim. Acta2002,
465, 395.
20. Danish Ministry of Food, Agriculture and Fisheries no 160;
Executive Order on the Content of Trans Fatty Acids in Oils
and Fats. Danish Veterinary and Food Administration, 2003.
Received: April 2, 2007