JÉSSICA SCHMIDT
YIELD LOSS CAUSED BY Phakopsora PACHYRHIZI ON SOYBEAN BASED ON PHYSIOLOGICAL COMPONENTS
Thesis presented to Federal University of Viçosa in partial fulfillment of the requirements to the Plant Pathology Post-graduation program for the degree of Doctor Scientiae.
VIÇOSA
Ficha catalográfica preparada pela Seção de Catalogação e Classificação da Biblioteca Central da UFV
T
S352y 2009
Schmidt, Jéssica
Yield loss caused by Phakopsora Pachyrhizi on soybean based on physiological components / Jéssica Schmidt – Viçosa, MG, 2009.
xiii, 83f.: il. (algumas col.) ; 29cm.
Orientador: Francisco Xavier Ribeiro do Vale. Tese (doutorado) - Universidade Federal de Viçosa. Inclui bibliografia.
1. Ferrugem-da-soja. 2. Soja – Doenças e pragas
3. Phakopsora pachyrhiziI. Universidade Federal de
Viçosa. II.Título.
JÉSSICA SCHMIDT
YIELD LOSS CAUSED BY Phakopsora PACHYRHIZI ON SOYBEAN BASED ON PHYSIOLOGICAL COMPONENTS
Thesis presented to Federal University of Viçosa in partial fulfillment of the requirements to the Plant Pathology Post-graduation program for the degree of Doctor Scientiae.
“WHAT WE KNOW IS A DROP,
WHAT WE IGNORE IS AN OCEAN”
I saac New t on
To my parents Cláudio and Clara
for all the opportunities and unconditional support...
To my brother Adriano Elias, for being always my best friend…
To my fiancée Luciano,
for being present in all moments….
ACKNOWLEDGEMENTS
First of all, I would like to thank God for giving me health during this four years in Viçosa. Just after having a really bad pneumonia, I realized why being a healthy person is the first and most necessary thing in our lives… Without it, I would never have been able to accomplished all my tasks.
I am grateful to my parents, Cláudio and Clara Bernardete Schmidt, who always supported me in whatever I decided to do. Their unconditional love and support not only kept me on track, but they made me who I am. More than dedicating this work to you, my success will always be yours too! To Diná da Silva and Iara Maria Schein, for taking care of me.
Thanks to my brother Adriano Elias Schmidt, who was always my best friend and shared all the moments (good and bad ones) in my life since we were kids and still does it! And to Luiz Luciano Bellini, my fiancée, for supporting me when I was very sick, when I was stressed and for being so lovely, comprehensive and for reminding me what is really important in life.
challenging and quite hard sometimes, but we can only discover our limits when they are pushed forward.
I am very grateful to Dr. Pierce Anderson Paul for giving me this marvelous opportunity of working in his lab, for giving me all the support abroad, for putting me in touch with his graduate students and making possible to share ideas.
I also thank my colleagues in the lab Max Lenine R de Oliveira, Thiago Alves, Wilker N. Medeiros, Bruno A., Ramirez Azevedo, Marcelo Lara, Isaías Cacique, Cristian A. Souza and Gisele Domiciano for their valuable help and Diego Carretero from Plant Physiology for helping in physiological analysis. Without you guys, collecting all the data would never have been possible. Special thanks to Antonio Macabeu for helping me with the experiments, but specially about his precious advices for life.
Of course, I could not leave my friends out of this section. I have made really good friends in Viçosa and this cannot be paid for with any money. For your true friendship, Hyana E. Lima, Maria S. Xavier Filha, Roseli R. Goulart, Christiana Bruce, Leonardo Aquino, Vívian C. Missio, Mirian Fumiko, Nadson Pontes, Juan H. Rivera, Tatiana Rodrigues and the new friends I have made in USA that received me so kindly and were my family there, Valdir Correa, Hugo Resque, Maria Elena Hernandes, Silviane and Luciano dos Santos, Elisama Rocha and Elizabeth de Nardo. A special thanks to Kylea Odenbach for all the culture and history information shared, specially about USA and more than everything, for giving me a real home and excelent company, even when it was just about knitting and watching tv!
I would also like to thank the department staff for their help and kindness Mário and spouse (Neusa), Braz, Rita, Délio, Sueli, Jesus, Bruno and Camilo.
Special thanks to Fundação de Amparo a Pesquisa do Estado de Minas Gerais (FAPEMIG) for having supported me during this time in Viçosa; to Cordenação de Aperfeiçoamento de Pessoal de Nível Superior (CAPES) for the financial support that allowed me to go to The Ohio State University; and to Conselho Nacional de Desenvolvimento Científico e Tecnológico (CNPq) for sponsored this work.
BIOGRAPHY
JÉSSICA SCHMIDT, daughter of Cláudio Schmidt and Clara Bernardete Schmidt, was born in Taquara in the State of Rio Grande do Sul on July 25th of 1977.
In 1995, she started an undergraduate course in Biological Sciences: teaching at the University of Vale do Rio dos Sinos (UNISINOS). From 1996 to 2000, she worked in Botany Department on plant anatomy under the supervision of professor DSc. Nelson Sabino Bittencourt. In 1999, she taught classes in the course of Serviço Social da Indústria (SESI) and at a public high school. Still in 1999, she worked on a final paper on biogeography under the supervision of professor MSc. João la Rocca.
In 2000, Jessica started on undergraduate course in Biological Sciences: bachelor at University of Vale do Rio dos Sinos (UNISINOS). During six months, she was trainee at the Plant Pathology Clinic in Federal University of Rio Grande do Sul (UFRGS) under the supervision of professor PhD Valmir Duarte.
In 2005, she started doctorate degree at Federal University of Viçosa (UFV) in Plant Pathology – epidemiology, advised by professor DSc. Francisco Xavier Ribeiro do Vale. The pathosystem studied was Asian Soybean Rust – soybean. During that time, she had a scholarship from Fundação de Amparo a Pesquisa do Estado de Minas Gerais (FAPEMIG) and during a sandwich in the United States of America, a scholarship from Cordenação de Aperfeiçoamento de Pessoal de Nível Superior (CAPES).
In 2008, she spent four months at The Ohio State University under the supervision of professor PhD Pierce Anderson Paul, working on data analysis.
SUMMARY
Página
RESUMO ... x
ABSTRACT... xii
1. GENERAL INTRODUCTION ... 1
1.1. Hypothesis ... 2
2. LITERATURE REVIEW ... 3
2.1. Soybean history ... 3
2.1.1. Soybean history in Brazil... 4
2.2. Soybean significance ... 5
2.2.1. Uses... 6
2.3. Botany... 7
2.3.1. Soybean growth stages... 9
2.3.2. Cultivars used in trials ... 9
2.4. Diseases ... 10
2.4.1. Asian Soybean Rust (ASR)... 11
2.4.1.1. Taxonomy of Phakopsora pachyrhizi... 11
2.4.1.2. Organism information... 12
2.4.1.3. Disease cycle and epidemiology ... 13
2.4.1.4. Symptoms ... 13
Página
2.5.1. Quantification of yield loss ... 15
2.5.2. Models ... 15
2.5.3. Integral models use to quantify yield loss... 16
2.5.4. Yield losses in soybean caused by Asian Soybean Rust ... 21
3. REFERENCES ... 23
ASIAN SOYBEAN RUST EFFECTS ON PHYSIOLOGICAL COMPONENTS AND YIELD ... 30
1. ABSTRACT... 30
2. INTRODUCTION ... 31
3. MATERIALS AND METHODS ... 34
3.1. Field experiments... 34
3.2. Crop growth ... 35
3.3. Disease severity and defoliation ... 35
3.4. Yield and yield loss ... 36
3.5. Integral variables... 36
3.6. Data analysis ... 38
3.7. Climate data... 38
4. RESULTS ... 39
4.1. Temperature and solar radiation ... 39
4.2. Disease severity and defoliation ... 39
4.3. Crop growth ... 40
4.4. Yield and yield loss ... 42
4.5. Integral variables related to yield ... 43
4.5.1. Area Under Disease Progress Curve (AUDPC) ... 43
4.5.2. Leaf Area Index (LAI) and Healthy Leaf Area Index (HLAI) 46 4.5.3. Leaf Area Duration (LAD) and Healthy leaf area Duration (HAD)... 46
4.5.4. Radiation Interception (RI) and Radiation Interception by the Healthy tissue (HRI)... 46
4.5.5. Healthy leaf Area Absorption (HAA) and Radiation Use Efficiency (RUE)... 47
Página
6. REFERENCES ... 56
IMPACT OF ASIAN SOYBEAN RUST ON SOYBEAN PHYSIOLOGY: EFFECTS ON PHOTOSYNTHESIS AND YIELD ... 62 1. ABSTRACT... 62
2. INTRODUCTION ... 63
3. MATERIAL AND METHODS... 66
3.1. Field experiments ... 66
3.2. Gas exchange measurements ... 67
3.3. Crop growth, disease severity, defoliation and yield ... 68
3.4. Integral variables... 68
3.5. Laboratory work ... 69
3.6. Use of β in estimates of AUDPC, HAD and HAA ... 69
3.7. Data analysis ... 70
4. RESULTS ... 71
5. DISCUSSION... 75
5.1. Acknowledgements ... 79
4. REFERENCES... 80
RESUMO
SCHMIDT, Jéssica, D. Sc., Universidade Federal de Viçosa, fevereiro de 2009. Quantificação de danos em soja causados por Phakopsora pachyrhizi com base em componentes fisiológicos. Orientador: Francisco Xavier Ribeiro do Vale. Coorientadores: Waldir Cintra de Jesus Junior e Fábio Murilo da Mata.
ABSTRACT
SCHMIDT, Jéssica, D. Sc., Federal University of Viçosa, February of 2009. Yield loss caused by Phakopsora pachyrhizi on soybean based in physiological components. Advisor: Francisco Xavier Ribeiro do Vale. Co-advisors: Waldir Cintra de Jesus Junior and Fábio Murilo da Mata.
1. GENERAL INTRODUCTION
Soybean (Glycine max (L.) MERRIL) is an important commodity responsible for generating approximately US$ 215 billion/year in a production area of 93.9 million hectares (USDA, 2009). In Brazil, the second largest producer, the planted area was 20.69 million hectares in the 2006/2007 growing season, which generated US$ 9.3 billion for the Brazilian economy and represented 6.77% of the total exports (CONAB, 2008).
Soybean plants are host of a number of pathogens, among them Phakopsora pachyrhizi, that causes the disease known as ASR. This disease occurs in almost every region where soybeans are grown, been considered of generalized occurrence (Rossman, 2009). In Brazil, among all producing States, only Roraima still has not register its presence (Embrapa, 2008).
In this sense, this work had as objective to study the effects of ASR on soybean yield to find usefull variables to be used in the future in a model to establish a secure crop management system in this pathosystem.
1.1. Hypothesis
2. LITERATURE REVIEW
2.1. Soybean history
Soybean (Glycine max (L.) Merrill) origin is attributed especially in the region of the Yangtze river in China. There is some controversy as to when soybean was first cultivated, but Hymowitz & Shurtleff (2005) investigated facts and myths about it and they explain that there is too much wrong information about soybean history. According to them, soybean was grown for the first time in China 3100 years ago and not 5000 as many authors affirm.
In China, some ancient crops were considered sacred and among them, soybean (CISoja, 2008; Embrapa, 2008). Although it has been planted for so many centuries in Asia, soybean is not the oldest domesticated crop in the world. There are archeological records of at least 30 crops older than it; among them, wheat, corn, chick-pea, beans, pumpkin, fava bean and pepper (Hymowitz & Shurtleff, 2005).
Industries started showing interest in soybeans because of its oil and protein value, but the first attempts to introduce plants in commercial fields failed in Russia, England and Germany, probably because of the unfavorable weather conditions (Embrapa, 2008). The first in the western world to be successful at growing soybeans on a large scale were the Americans, who developed new commercial varieties (CISoja, 2008).
2.1.1. Soybean history in Brazil
Soybean introduction in Brazil varies depending on the reference that is used. As Ho (1955) explained, the dissemination of plants has many possible channels, such as traders, travelers, emissaries, and government officials, who have left little or no record. There is little chance that a certain plant is introduced into a new area only once and by a certain route. A new plant may score an immediate success in one region and remain neglected in another for a considerable time, because sometimes only through repeated trial and error, they can strike root. In this way, a new plant may actually be introduced more than once (Ho, 1955).
In Brazil, soybean introduction has two different pathways: the first was from the United States, around the year 1882 in the state of Bahia State by Gustavo Dutra, a researcher at the Bahia Agronomy School (CISoja, 2008). Other path mentioned was from Japan, with the Japanese immigrants to Brazil in 1908, being officially introduced the state of Rio Grande do Sul by the year 1914 (Kamizake et al., 2006; Barreto, 2008, EMBRAPA, 2008).
At the end of the 60’s, two internal factors made Brazil pay attention to soybean as a rentable crop: by that time, wheat was the main crop in the South region and soybean was an option to be grown during the summer and, the second factor was that production of pigs and hens was growing, which made the demand necessity for animal food to increase (Embrapa 2008).
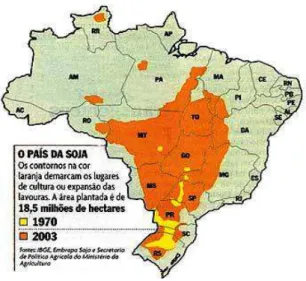
conditions. As a result, from being grown only Southern region in the 60`s, after the 80`s soybean started to be grown in the “cerrado”, which is nowadays the biggest area of production in Brazil. Connected to this crop movement from the South to the center of Brazil, is the population movement to areas that were previously uninhabited (CISoja 2008). After the 90`s, the Northwest and Northern region initiated their production and with this, soybean was economically consolidated in all regions of the Country (CISoja 2008). Figure 1 illustrates the increasing area in Brazil where soybean is grown.
Figure 1 – Comparison of soybean production area between the years of 1970 (yellow) and 2003 (orange) (Delcidio, 2008).
2.2. Soybean significance
Nowadays, the leading countries in order of importance are the United States, Brazil, Argentina, China, India and Paraguay (Embrapa, 2008). Together, USA and Brazil produce 135.69 million tons and are responsible for 60% of the world’s production.
of tons, at 2.82 kg/ha (CONAB, 2008) and Argentina produced 45 million tons (FAO, 2008).
Soybean production in Brazil has increased 260 fold in the last few decades. This is due mainly to research in developing cultivars that are better adapted to Brazil`s conditions, specially the weather (EMBRAPA, 2009), making possible to increase the area cultivated. The major soybean producing states in Brazil are located in the south, southeast and mid-west regions, states of Mato Grosso, Paraná, Goiás and Rio Grande do Sul, in order of importance (CONAB, 2008).
In the 2007/2008 growing season of, soybeans were grown by 300,000 producers and generated 389,000 direct and 778,000 indirect jobs (CISoja, 2008).
This rapid growth and spread of soybean in Brazil lead to huge changes in the Country`s economy and society. In the beginning, together with wheat, both were responsible for the rising of commercial agriculture and this includes mechanization. Soybean was directly responsible for the expansion of agricultural border, professionalization and increase in international trade, for technological improvement in other cultures (especially maize), as well as stimulated expansion of pigs and poultry production (EMBRAPA, 2008).
Besides the already cited economic improvements, soybean has caused deep changes in population. It has not only caused modifications in the diets of Brazilians, but revolutionized the pattern of population distribution in Brazil. Soybean provoked rapid urbanization of the countryside in the South, Southeast and coasts in the of North and Northeast to regions that were previously unhabited (EMBRAPA, 2009).
2.2.1. Uses
bakery, products for meat, combined with cereals, beverages, baby food, etc. Soybean is used not only to feed humans, but animals too.
In industry, it is used to prepare seasonings, foam, manufacture fiber, covering and emulsion for inks. Currently, Soybean is being tested to be used as an alternative source of fuel, called biodiesel (CISoja, 2008, EMBRAPA, 2009).
2.3. Botany
Prior to the 20th century, soybean (Glycine max (L.) Merrill) seeds were different from the way they are today, they were black, green, brown, yellowish-green or mottled. With breeding, today they are largely yellow. Seeds grow in pods, usually 2-3 in each pod. Leaves are trifoliate and are covered with brown hairs, as are pods and stems (Shurtleff & Aoyagi, 2007).
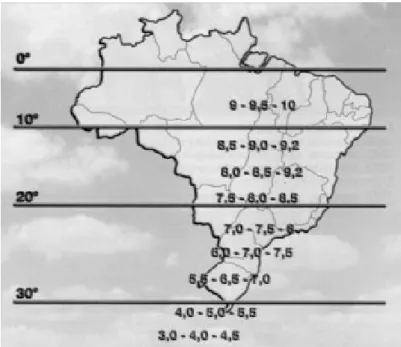
Soybeans are unique among legumes, because in most plants, flowering and ripening are controlled by air temperature and in soybean, they are governed by photoperiod (Shurtleff & Aoyagi, 2007), which is the number of hours of sun and moonlight. Since day length changes with latitude, there is diversity of cycles, and soybeans will flower and mature later in the North and earlier in the South of the globe. This is very important in choosing the cultivars, because when photoperiod is shorter during plant vegetative growth, flowering occurs precociously and yield is reduced (CISoja, 2008).
region (Shurtleff & Aoyagi, 2007; CISoja, 2008). International maturity groups for Brazil are illustrated in Figure 2.
Figure 2 – Soybean Maturity Groups (MG) in Brazil, classified according to the latitude. International convention (Penariol, 2000).
2.3.1. Soybean growth stages
Soybeans growth stages description can be discussed as (Fehr et al.,1971):
Vegetative
V1. Completely unrolled leaf at the unifoliolate node;
V2. Completely unrolled leaf at the first node above the unifoliolate node;
V3. Three nodes on main stem beginning with the unifoliolate node; V(n). N nodes on the main stem beginning with the unifoliolate node;
Reproductive
R1. One flower at any node;
R2. Flower at node immediately below the uppermost node with a completely unrolled leaf;
R3. Pod 0.5 cm long at one of the four uppermost nodes with a completely unrolled leaf;
R4. Pod, 2 cm long, at one of the four uppermost nodes with a completely unrolled leaf;
R5. Beans beginning to develop (can be felt when the pod is squeezed) at one of the four uppermost nodes with a completely unrolled leaf;
R6. Pod containing full size green beans at one of the four uppermost nodes with a completely unrolled leaf;
R7. Pods yellowing; 50% of leaves yellow. Physiological maturity; R8. 95% of pods brown. Harvest maturity.
2.3.2. Cultivars used in trials
Monarca
period for sowing is between October and December (Vasconcelos, 2006, Syngenta Seeds, 2008).
Conquista
In the market since 1995, this cultivar named as MGBR-46, is adapted to Minas Gerais, Rondônia, Tocantins, Roraima, Goiás, Distrito Federal, Mato Grosso, Bahia e São Paulo. Conquista belongs to maturity group 8.1 with a medium to semi-delayed cycle in Minas Gerais. The best period for sowing is between October and December, however, because of its long vegetative period, it can be sown during winter when complementary irrigation is present (EMBRAPA, 2009).
Vencedora
Commercially available since 1998, this cultivar named BRSMG-68, is adapted to São Paulo, Minas Gerais, Goiás, Distrito Federal, Mato Grosso e Bahia. Vencedora is of maturity group 8.0 cycle semi-precocious to medium cycle in Minas Gerais State. The best period for sowing is between October and November (EMBRAPA, 2009).
2.4. Diseases
One of the main factors limiting maximum soybean yields is disease effect. In Brazil, approximately 40 soybean diseases caused by fungi, bacteria, nematodes and viruses have already been identified and this number continues to increase with the expansion of soybean to new areas and increase in monoculture (Embrapa, 2008).
myrothecium leaf spot (Myrothecium roridum), sudden death syndrome (Fusarium solani), charcoal rot disease (Macrophomina phaseolina) and stem rot disease (Sclerotium rolfsii) is common.
Other diseases that occur are frogeye leaf spot (Cercospora sojina), bacterial leaf blight (Pseudomonas syringae pv. glycinea), bacterial pustule disease (Xanthomonas campestris pv. glycines) in areas where it was used susceptible cultivars, presenting considerable yield loss and a particular problem to some areas is soybean cyst nematode (Heterodera glycines) (Meyer & Yorinori, 1999; Embrapa, 2008).
Although all these diseases occur and cause yield losses, one of the most important diseases of the soybean in the world is Asian Soybean Rust (Phakopsora pachyrhizi). It has been a problem in almost all soybean-growing regions of the world (Purdue, 2008). In Brazil, ASR is the worst disease affecting soybeans, and in almost all 15 producing States, except for Roraima, yield losses due to this disease occurrence. However, due to government efforts in the last growing season disease was less severe than it was in previous years (Embrapa, 2008).
2.4.1. Asian Soybean Rust (ASR)
2.4.1.1. Taxonomy of Phakopsora pachyrhizi
(NPAG, 2002).
Phylum: Basidiomycota Class: Uredioniomycetes Order: Uredinales
Family: Phakopsoraceae Genera: Phakopsora Species: pachyrhizi
2.4.1.2. Organism information
Soybean Rust (ASR) is caused by two related species of fungi, the most aggressive is Phakopsora pachyrhizi Sydow (anamorph Malupa sojae), and the less aggressive species, Phakopsora meibomiae (Arthur) Arthur (anamorph Malupa vignae), has only been found in limited areas in the Western Hemisphere and is not known to cause severe yield losses in soybean (Hartman et al., 1996).
Like other rusts, ASR pathogen requires a living host to grow and reproduce; it can survive away from soybean as urediniospores for few days under natural conditions. P. pachyrhizi produce only two types of spores: urediniospores and teliospores; the uredinial stage is the repeating stage. Epidemics develop quickly from pustules – spores are produced from seven to ten days after infection, and each pustule can produce hundreds of new urediniospores. Teliospores are produced in old lesions and aecia or spermogonia are unknown (Rupe & Sonyers, 2008).
P. meibomiae, is referred as the American or New World rust. Asian rust caused by P. pachyrhizi is extremely aggressive and is listed as a select biological agent (Title 7, Code of Federal Regulations, Part 331.2), determined to have the potential to pose a threat to plant health or plant products (USDA, 2009).
Phakopsora pachyrhizi is ranked as 22nd of the top 100 most dangerous and exotic pests and diseases (Cooper, 2009). It is an air-borne fungal pathogen that, under favorable environmental conditions, cause serious economic and crop losses (Embrapa, 2008).
a resistant cultivar, but it was overcomed with an isolate from Mato Grosso (Embrapa, 2008).
Until now, chemical control using fungicides has been successful at obtaining good yields, specially myclobutanil and propiconazole in USA (Clayton, 2005). In Brazil, azoxystrobin, ciproconazole, propiconazole, tebuconazole and nine other – in blend or alone - are registered by MAPA to use against ASR (Embrapa, 2008). The problem is that producers have added production costs because of the need for at least three sprays during soybean cycle.
2.4.1.3. Disease cycle and epidemiology
P. pachyrhizi has many alternative hosts the legumes family, which may serve as sources of inoculum, although they are not needed for the fungus to complete its cycle (Rupe & Sonyers, 2008).
ASR epidemics begin with the arrival of airborne urediniospores, and once viable spores have landed on the leaf surface of the host, if environmental conditions are favorable, infection begins with the breaching of the epidermis (Rupe & Sonyers, 2008; Embrapa, 2008; Consórcio, 2009). Generally, infection occurs when leaves are wet and temperatures are between 8°C and 28°C, with an optimum of 16°C to 28°C. At 25°C, some infections occur in as little as 6 hours of leaf wetness, but 12 hours are optimal. After infection, urediniospores appear in seven to eight days, and the cycle re-starts (Rupe & Sonyers, 2008).
2.4.1.4. Symptoms
3) and loss of leaf tissue results in yield reductions from fewer and smaller seeds (Figure 4). Lesions may be either tan - many pustules that produce numerous urediniospores or red-brown - few pustules that produce only few urediniospores. As pustules age, they may turn black due to the formation of a layer of teliospores. Germination of teliospores has been observed only in the laboratory and does not seem to make a significant contribution to the perpetuation of this disease in the field. Besides leaves, soybean rust can also appear on petioles, stems, and even cotyledons, but most rust lesions occur on leaves (Rupe & Sonyers, 2008; Embrapa, 2008; Consórcio, 2009).
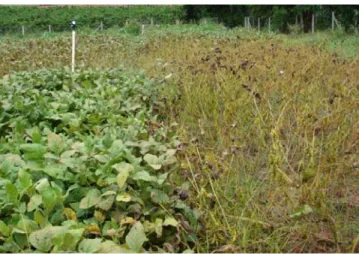
Figure 3 – Early defoliation in soybean caused by Asian Soybean Rust (ASR) – on the left treatment with three tebuconazole sprays and on the right, control with no spray. Viçosa, MG, Brazil. 2008.
Soybean rust epidemics can progress from below detectable levels to defoliation within a month and may seem to progress even faster than that, because early infections occur in the lower canopy and are harder to find. Yield losses as high as 30 to 80% have been reported, but the amount of loss depends on when the disease begins and how rapidly it progresses (Rupe & Sonyers, 2008).
2.5. Yield Loss
2.5.1. Quantification of yield loss
Before talking about yield loss, it is necessary to just define yield and loss, because is common in Plant Pathology, some concepts are used in different ways. In this work, yield is considered the plants commercial part, measured as pod and grain number and weight and loss is the reduction in quality and/or quantity of these commercial parts.
2.5.2. Models
To estimate yield loss, information summarized in the form of quantitative relationships called models; consequently, those that can be defined as a simplified representation of a system, in which variables related to disease and loss are used. Models used to estimate yield loss can be one of three kinds (Bergamin Filho et al., 1995; Cooke, 2007):
1. Critical point: for many pathosystems it is possible to identify a definite stage of host growth when severity can be related to yield loss. In this kind of model, only one assessment is used to represent an entire epidemic. This model, is often criticized because it is based on a small portion of epidemics.
3. Integral models: These models are based in many assessments to represent the entire epidemic, and the importance of a given intensity of disease depends on the time during the season when that disease intensity occurs.
From now on, only integral models are going to be considered.
2.5.3. Integral models use to quantify yield loss
Despite the importance of plant diseases, the relationship between disease and resulting yield was not studied for most diseases, until recent decades. When they finally commenced being studied, researchers were seeking for answers on correlations between crop yield and disease severity. Teng (1985) showed that the traditional method used – a simple correlation between crop yield and disease severity in some host growth stages – was not sufficient to explain what was happening.
The yield loss quantification started with two simple methods, disease incidence and severity (James & Teng, 1979), but the results obtained were disappointing, considering that sometimes they were appropriated and sometimes they were not. There was a need for different methods of assessments.
Waggoner & Berger (1987) worried about this lack of good results, probably were the first plant pathologists at the end of the last century to look back to another branch of science: plant physiology. Crop physiologists started to look for the principles of yield physiological processes a long time before plant pathologists. The biggest advance was obtained by West et al. (1920) and Briggs et al. (1920) when they developed growth functions that combined physiology with field work. One of them was net assimilation rate (NAR), defined as weight increased by leaf surface in time. “NAR” can be considered photosynthesis minus loss due to plant breathing (Gregory, 1926):
in which w1 and w2 are the dry weight, L1 and L2 leaf area, in time t1 e t2, respectively.
Twenty seven years after Gregory’s work, it was found high correlation between yield and leaf area index (LAI), showing the remarkable role of LAI in the growth on many crops, among them wheat, barley, sugar beet and potato (Watson, 1947). Furthermore, Watson realized that more important than just the leaf area, was the integral of LAI during all growth stages of the plants that should be taken into account, because yield was even better correlated to leaf area duration (LAD). This was because LAD considers the size of the leaves and how long they persist. This is the concept of Leaf Area Duration = LAD, calculated as
LAD = Σ ((LAIi (ti -ti-1) / 2)),
in which LAD is the duration of leaf area (in days), LAI is leaf area index (without dimension), and t, is time.
These concepts of LAI and LAD represented a remarkable progress toward the comprehension of the bases of production and opened the doors to other concepts that would be based on them more than twenty years later.
With this in mind, the knowledge of a healthy host phenology is also necessary because the action of senescent parts can clearly be differentiated from diseased parts lost due to pathogens.
This completely new way to look at yield loss trough host-pathogens relationship was left aside until Lim & Gaunt`s (1981) work. With their research on leaf area, they highlighted the role of leaf area in yield quantification. In the same year (1981), Carver and Griffiths had similar conclusions as Lim and Gaunt (1981) about the importance of leaves. These authors were the first to use concept of Green Leaf Area, which would be the same concept as HAD (Healthy Area Duration) defined two years later by Waggoner and Berger (1987).
The traditional approach did not consider the size and quantity of leaves, neither the radiation intercepted by them, nor their capacity to carry out photosynthesis. Most of the physiological processes related to host growth to the later storage occur in the leaves. When a pathogen interrupts this natural process, all or at least part of it is interrupted, generating disease and this affects yield.
Now it is possible to understand why the relationship between disease and yield was weak and it explains the disappointing results obtained when plant pathologists considered only the pathogen and disease instead of the host when qualifying yield loss.
Waggoner & Berger (1987) called attention to the fact that yield, or dry matter of a plant, is function to a large extent, of the photosynthesis that occurs in the leaves. They gathered data from many previous articles from different places and pathosystems and showed that photosynthesis is more directly related to the absorption of solar radiation by leaves than LAI.
Generally, the Beer`s law is used to express the transmission of solar radiation I (MJ m-2) through the foliage. Thus, the absorbed fraction ‘f’ is given by:
f = (1 - exp ( - kLAI) ) ,
in which k is the extintion coefficient (value close to one for plants with horizontal leaves and around to 0.3 for plants with erect leaves) and depends on LAI. The production of dry matter w (g m-2) becomes related to LAI and solar radiation through the equation:
Previous studies on yield loss quantification
had focused on the
increase in lesions number or in disease severity progress in time.
Disease progress curves are summarized by means of rate changes, r
(day
-1), or area under disease progress curve (AUDPC) (days)
(Vanderplank, 1963). None of these variables used (r and AUPDC)
supply information regarding foliage size, how long it remains
functional or how much solar radiation it absorbs.
To relate disease progress curve to host growth, it should be
deduc
ted the lesioned areafrom
LADvalue and
by the integration of the healthy and operational leaf area with host growth over the time, results in what Waggoner & Berger (1987) called Healthy Area Duration (HAD) (days):HAD = Σ ( 1 - y1) LAIi (ti - ti - 1) / 2)
A similar thing can be done with LAA, which includes diseased area and gives rise to the Healthy Area Absorption (HAA) (MJ m-2) Waggoner & Berger (1987):
HAA = Σ ( I (1 - y1) (1 - exp ( -kLAIi) (ti - ti -1) / 2 )
rice-Pyricularia grisea (= oryzae) (Bastiaans, 1991; Pinnschmidt et al., 1994); corn-Phaeosphaeria maydis (Godoy et al., 2001); common bean-Colletotrihum lindemuthianum (Gianasi, 2002), Phaeosariopsis griseola (Jesus Junior et al., 2003; Cantery & Godoy, 2005), Uromyces appendiculatus (Bassanezi et al., 2001; Jesus Junior et al., 2001a, 2001b), Xanthomonas axonopodis pv. phaseoli (Díaz et al., 2001); sunflower-Alternaria helianthi (Leite et al., 2006); alamus-Melampsora medusae (May-de Mio et al., 2006).
Johnson (1987) replied to Waggoner & Berger`s (1987) letter, stating that the effect of the pathogens could be even worse, because they don`t only affect radiation interception and absorption by causing the hosts to drop their leaves through defoliation, but they could also affect the use of the radiation intercepted, showing the importance of the pathogen`s action on radiation use efficiency (RUE).
Griffiths (1984) perceived that not all pathosystems present the same high correlation between the integral of the green leaf area and yield mentioned by Waggoner & Berger (1987). As possible explanations, are photosynthesis reduction in areas distant from the lesions, variations in harvest index, increase of plant breathing due to infection, the peculiar contribution to yield by specific leaves and changes in growth regulators. Bastiaans (1991) found the same results with rice-leaf blast and more than this, the area that pathogens affect can be greater than one can see. This effect can be due to toxins, for example and called this “virtual lesion”, because it can be measured, but it cannot be seen.
To obtain beta value, the interaction on the photosynthetic rates of healthy and diseased leaves are determined by gas-exchange analysis and used in the equation (Bastiaans,1991):
Px/P0 = (1 - x)β
In virtual lesion concept, when beta values are equal to 1, the area that is affected by pathogen is just the same that can be seen as diseased: visual and virtual areas are the same. The longer the beta value is above 1, the bigger is the area affected in relation to visually lesioned area on the leaves.
Plant pathogens can be divided into groups, based on their nutritional behavior, such as biotrophic and necrotrophic. Those that do not kill their hosts immediately and depend on viable tissue to complete their development are called biotrophic; rusts are examples (Agrios, 2007). Lopes (1999) explains that the pattern of response and the reduction in photosynthesis are related to the type of trophic relationship, but it cannot be assumed that all biotrophic agents act in a similar manner concerning the mechanisms of infection.
Generally, when necrotrophic microorganisms are involved, they use toxins that diffuse into the tissue and result in bigger values of β, being similar to hemibiotrophic pathogens (Bassanezi et al., 2001). In the case of biotrophic microorganisms, as they are less destructive to the tissue because of their mode of living, they usually present values of β equal or close to one. Some research that corroborate this idea are Bastiaans (1991) – wheat rust; Bastiaans & Roumen (1993) – rice blast; Bassanezi et al. (2001) – rust, angular leaf spot and common bean anthracnose; Lopes & Berger (2001) – bean rust; Diaz et al. (2001) – common bacterial blight on bean.
It is important to highlight that every pathosystem is unique and pathogen`s effect on green leaf tissue vary and may present different results, for example McGrath & Pennypacker (1990) work with wheat rust, Elings et al. (1999) with bacterial blight on rice and Robert et al. (2005) with septoria on wheat.
2.5.4. Yield losses in soybean caused by Asian Soybean Rust
(Câmara, 2000) which depend on radiation intercepted and the right use of this intercepted radiation (Shibles & Weber, 1965). Thus, any factor that causes reduction in leaf area, can affect yield (Diogo, 1997).
One of the most important factors is ASR, because it affects the photosynthetic potential of plants due to yellowing and early defoliation (Yorinori, 2003). Under favorable weather conditions and depending on the time of infection, ASR cause yield loss of up to 80% (Hartman et al., 1991; Dorrance et al., 2005).
3. REFERENCES
AGRIOS, G. N. 2005. Plant pathology. 6th ed. San Diego, CA. Elsevier Academic Press. 948p.
AQUINO, V. M.; SHOKES, F. M.; BERGER, R. D.; GORBET, D. W. & KUCHAREK, T. A. 1992. Relationships among late leaf spot, healthy leaf area duration, canopy reflectance, and pod yield of peanut. Phytopathology, 82(5): 546-52.
BARRETO, C. A. Os impactos socioambientais do cultivo de soja no Brasil. 10p. 2008. Available at: <http://www.anppas.org.br/encontro_anual/ encontro2/GT/GT05/clarissa_barreto.pdf>. Access Oct 12.
BASSANEZI, R. B.; AMORIM, L.; BERGAMIN FILHO, A.; HAU, B. & BERGER, R. D. 2001. Accounting for photosynthetic efficiency of bean leaves with rust, angular leaf spot and anthracnose to assess crop damage. Plant Pathology, 50: 443-452.
BASTIAANS, L. 1991. Ratio between virtual and visual lesion size as a measure to describe reduction in leaf photosynthesis of rice due to leaf blast, Phytopathology, 81: 611-615.
BERGAMIN FILHO, A.; LOPES, D. B.; AMORIM, L.; GODOY, C. V. & BERGER, R. D. 1995. Avaliação de danos causados por doenças de plantas. Revisão Anual de Patologia de Plantas, 3:133-184.
CAMPBELL, C. L. & MADDEN, L. V. 1990. Crop loss assessment and modeling. In: CAMPBELL, C. L. & MADDEN, L. V. Introduction to plant disease epidemiology. New York: John Wiley & Sons. Chap. 14, p. 393-422.
CANTERI, M. G. & GODOY, C. V. 2005. Influência de mancha angular na eficiência fotossintética da área foliar sadia de feijoeiro, sob condições de campo. Ciências Agrárias, 26(2): 179-186.
CARVER, T. L. W. & GRIFFITHS, E. 1981. Relationship between powdery mildew infection, green leaf area and grain yield of barley. Annals of Applied Biology, 99: 255-66.
CISOJA – Centro de Inteligencia da Soja. 2008. Histórico. http://www.cisoja.com.br/index.php?p=historico. Acess Oct 12.
CLAYTON, J. 2005. Soybean rust control with Micronair rotary atomizers. Available at: <http://www.agairupdate.com/aau/articles/2005/ May2005.html>. Acess in jan. 31st 2009.
CONAB – Companhia Nacional de Abastecimento. 2008. Available at: <http://www.conab.gov.br/conabweb>. Access in Oct 12.
CONSÓRCIO Antiferrugem. 2009. Ciclo e Epidemiologia. Available at: <http://www.consorcioantiferrugem.net/index.php?Conhe%E7a_a%26nbsp% 3Bferrugem%26nbsp%3B:Ciclo_e_epidemiologia%26nbsp%3B>. Acess in Jan 31st.
COOKE, B. M. 2007. Chapter 12: Disease assessment and yield loss. In: ADDEN, L. V.; HUGHES, G. & AN DEN BOSCH, F. The study of plant disease epidemics. APS Press, St. Paul, Minnesota.
COOPER, B. 2009. Soybean Rust. Availabe at: <http://bldg6.arsusda.gov/~pooley/soy/cooper.html>. Acess in jan. 31st.
DAAMEN, R. A. & JORRITSMA, I. T. M. 1990. Effects of powdery mildew and weather on winter wheat yield. 2. Effects of mildew epidemics. Netherlands Journal of Plant Pathology, 6: 35-46.
DELCIDIO, A. A construção do Brasil novo. Brasília: Ed. do Senado Federal, 2003. Disponível em: <www.delcidio.com.br/livro/foto_pag77.jpg>. Acesso em: 12 out. 2008.
DIOGO, A. M. 1997. Influência da remoção de folhas, em vários estágios de desenvolvimento, na produção de grãos e em outras características agronômicas da soja (Glycine max (L.) Merrill). Viçosa, MG. Masters Dissertation.
DORRANCE, A. E.; DRAPER, M. A. & RSHMAN, D. E. 2005. Using foliar fungicides to manage soybean rust: Economic importance of soybean rust. Land Grant Universities Cooperating, NC-504.
ELINGS, A.; ROSSING, W. A. H. & AN DER WERF, W. 1999. Virtual lesion extension: A measure to quantify the effects of bacterial blight on rice leaf CO2 exchange. Phytopathology, 9:789-795.
EMBRAPA – Empresa Brasileira de Pesquisa Agropecuária. 2008. A soja no Brasil in Tecnologias de produção de soja – Região Central do Brasil, 2004. Sistema de Produção N. 1. Embrapa Soja, Londrina, PR. Available at: <http://www.cnpso.embrapa.br/producaosoja/SojanoBrasil.htm>. Acess in jan. 31st.
EMBRAPA – Empresa Brasileira de Pesquisa Agropecuária. 2009. Diferentes usos do grão. Embrapa Soja, Londrina, PR. vailable at: <ttp://www.cnpso.embrapa.br/index.php?op_page=25&cod_pai=29>. Access in jan. 31st.
FAO – Food and Agriculture Organization of the United Nations. 2008. Available at: <http://www.fao.org>. Acess in Oct.12.
FEHR, W. R.; CAVINESS, C. E; BURMOOD, D. T. & NING, J. S. 1971. Stages of development descriptions for soybean, Glycine max (L.). Merrill. Crop Science, 11: 929-930.
FUNDAÇAO MERDIONAL de Apoio a Pesquisa Agropecuária. Histórico. Disponível em: <http://www.fundacaomeridional.com.br/soja/historico.htm>. Acesso em: 12 out. 2008.
GIANASI, L. 2002. Relações entre doença, área foliar sadia e produção no patossistema feijoeiro-Colletotrichum lindemuthianum (Sacc. & Magn.) Scrib. Ciências Agrotécnicas, 26(1): 99-107.
GODOY, C. V.; AMORIM, L. & BERGAMIN FILHO, A. 2001. Alterações na fotossíntese e na transpiração de folhas de milho infetadas por Phaeosphaeria maydis. Fitopatologia Brasileira, 26: 209-215.
GODOY, C. V. & CANTERY, M. G. 2004. Efeito da severidade de oídio e crestamento foliar de cercospora na produtividade da cultura da soja. Fitopatologia Brasileira, 29(5): 526-531.
GRIFFITHS, E. 1984. Foliar diseases: the damage caused and its effect on yield. In: WOOD, R. K. S. & JELLIS, G. J. Plant diseases: infection, damage and loss. Oxford, Blackwell Scientific Publications, Chap. 12, p. 149-59. HARTMAN, G. L.; SINCLAIR, J. B. & RUPE, J. C. 1996. Rust. P.25 - 26. In: HARTMAN, G. L.; SINCLAIR J. B. & RUPE, J. C. Compendium of soybean diseases. The American Phytopathological Society, St. Paul, Minnesota. HO, P. T. 1955. The introduction of American food plants into China. American Anthropologist, 57: 191-201.
HYMOVITZ, T. & SHURTLEFF, W. R. 2005. Debunking Soybean Myths and Legends in the Historical and Popular Literature. Crop Science, 45: 473-476. HYMOVITZ, T. 1990. Soybeans: the success story. Advances in new crops. Portland, Oregon, Timber Press. 163p.
JAMES, W. C. & TENG, P. S. 1979. The quantification of production constraints associated with plant diseases. Applied Biology, 4: 201-67. JENKYN, J. F. 1976. Effects of mildew (Erysiphe graminis) on green leaf area of Zephyr spring barley, 1973. Annals of Applied Biology, 82: 485-8. JESUS JUNIOR, W. C.; VALE, F. X. R.; COELHO, R. R.; HAU, B.; ZAMBOLIM, L.; COSTA, L. C. & BERGAMIN FILHO, A. 2001a. Effects of angular leaf spot and rust on yield loss of Phaseolus vulgaris. Phytopathology, 91: 1045-1053.
JESUS JUNIOR, W. C.; VALE, F. X. R.; COELHO, R. R.; PAUL. P. A.; HAU, B.; BERGAMIN FILHO, A.; ZAMBOLIM, L. & BERGER, R. D. 2003. Relationships between angular leaf spot, healthy leaf area, effective leaf area and yield of Phaseolus vulgaris. European Journal of Plant Pathology, 109: 625-632.
JESUS JUNIOR, W. C.; VALE, F. X. R.; MARTINEZ, C. A.; COELHO, R. R.; COSTA, L. C.; HAU, B. & ZAMBOLIM, L. 2001b. Effects of angular leaf spot and rust on leaf gas exchange and yield of common bean (Phaseolus vulgaris). Photosynthetica, 39(4): 603-606.
JOHNSON, K. B. & TENG, P. S. 1990. Coupling a disease progress model for early blight to a model of potato growth. Phytopathology, 80(4): 416-25. JOHNSON, K. B. 1987. Defoliation, disease and growth: a reply. Phytopathology, 77(11): 1495-7.
KUMUDINI, S.; KENNEDY, B.; GODOY, C. V.; OMIELAN, J.; PRIOR, E.; HERSHMAN, D. & TOLLENAAR, M. 2008. Impact of Phakopsora pachyrhizi infection on soybean leaf photosynthesis and radiation absorption. Crop Science, 48: 2343-2342.
LAST, F. T. 1955. Effect of powdery mildew on the yield of spring sown barley. Plant Pathology, 4: 22-4.
LEITE, R. M.V. B. C.; AMRORIM, L. & BERGAMIN FILHO, A. 2006. Relationships of disease and leaf area variables with yield in the Alternaria helianthi-sunflower pathosystem. Plant Pathology, 55: 73-81.
LIM, L. G. & GAUNT, R. E. 1981. Leaf area as factor in disease assessment. Journal of Agricultural Science, 97: 481-3.
LOPES, D. B. 1999. Photosynthetic competence of bean leaves with rust and anthracnose. 1999. 166 f. Thesis. University of Florida.
MAY-DE MIO, L. L.; AMORIM, L. & MOREIRA, L. M. 2006. Progresso de epidemias e avaliação de danos da ferrugem em clones do álamo. Fitopatologia Brasileira, 31(2): 133-139.
MCGRATH, M. T. & PENNYPACKER, S. P. 1990. Alteration of physiological processes in wheat ag leaves caused by stem rust and leaf rust. Phytopathology, 80: 677-686.
MEYER, M. C. & YORINORI, J. T. 1999. Incidência de doencas da soja em regioes tropicais. In: CONGRESSO BRASILEIRO DE SOJA, 1999, Londrina. Anais... Londrina, PR: Embrapa Soja, 1999. p. 457.
MONTEITH, J. L. 1977. Climate and the efficiency of crop production in Britain. Philosophical Transactions of the Royal Society of London, 281: 277-329.
NPAG. 2002. Phakopsora pachyrhizi Australasian soybean rust. December. 14p. Available at: <http://168.68.129.70/plant_health/plant_pest _info/soybean_rust/downloads/UreMelPp502.pdf>. Acess in Oct. 12 2008. PENARIOL, A. 2000. Soja: cultivares no lugar certo. Cultivar, 16: 31-32. PINNSCHMIDT, H. O. & TENG, P. S. 1993. Empirical versus mechanistic approaches to adjust yield expectations for multiple pest damage on rice. In: International Congress of Plant Pathology, 6., Montreal, Canadian Phytopathological Society, p. 116. (Abstr.).
PURDUE University. 2008. Soybean rust. Available at: http://www.ppdl.purdue.edu/PPDL/soybean_rust.html. Access in Oct 12.
REA, B. L. & SCOTT, R. K. 1973. The effects of mildew (Erysiphe graminis) on leaf growth and yield of spring barley. In: British Inseticide and Fungicide Conference, 7., Bracknell, British Crop Protection Council, p. 29-37.
ROSSING, W. A. H.; VAN OIJEN, M.; VAN DER WEF, W.; BASTIANNS, L. & RABBINGE, R. 1992. Modeling the effects of foliar pests and pathogens on light interception, photosynthesis, growth rate and yield of field crops. In: AYRES, P.G. (Ed.). Pests and pathogens: plant responses to foliar attack. Oxford, Bios Scientific Publishers, p. 161-80.
ROSSMAN, A.Y. 2009. The Impact of invasive fungi on agricultural ecosystems in the United States. Biological Invasions, 11 (1), 97-107.
RUPE , J. & SONYERS, L. 2008. Soybean Rust. the plant health instructor. DOI: 10.1094/PHI-I-2008-0401-01. Available at: <http://www.apsnet.org/education/LessonsPlantPath/sbRust>. Acess in Jan 31st 2009.
SAVARY, S. & ZADOKS, J. C. 1992. Analysis of crop loss in the multiple pathosystem groundnut-rust-late leaf spot. I. Six experiments. Crop Protection. 11(2): 99-109.
SHAH, S. F. A.; MCKENZIE, B. A.; GAUNT, R. E.; MARSHALL, J. W. & FRAMPTON, C. M. 2004a. Effect of early blight (Alternaria solani) on healthy area duration and healthy area absortion of potatoes (Solanum tuberosum) grown in Canterbury New Zealand with different nitrogen application and stress from potato cyst nematode (Globodera rostochiensis). New Zealand Journal of Crop and Horticultural Science, 32: 85-102.
SHAH, S. F. A.; MCKENZIE, B. A.; GAUNT, R. E.; MARSHALL, J. W. & FRAMPTON, C. M. 2004b. Empirical models of the relationships between early blight (Alternaria solani) and yield of potato (Solanum tuberosum) crop grown under different production environments. New Zealand Journal of Crop and Horticultural Science, 32: 103-112.
SHAW, M.W. & ROYLE, D.J. 1989. Estimation and validation of a function describing the rate at which Mycosphaerella graminicola causes yield loss in winter wheat. Annals of Applied Biology, 115- 425-42.
SHIBLES, R. M. & WEBER, C. R. 1965. Leaf area, solar radiation and dry matter production by soybeans. Crop Science, 575-578.
SIEBEN, A. & MACHADO, C. A. Histórico e contextualizacao sócio-economica e ambiental da soja (Glycine max) no Brasil. Jataí, GO. Geo-ambiente online, 7: 71-88, jul./dez. 2006.
SUBBA RAO, K. V.; YANG, X. B.; BERGGREN, G. T. & SNOW, J. P. 1989. A multiple regression model to estimate the contributions of leaves and the effects of leaf rust on yield of winter wheat. Phytopathology, 79(11): 1233-8. SYNGENTA Seeds, 2008. Variedades de soja: soja Monarca. Available at: <http://www.syngentaseeds.com.br/novosite/nk_soja_monarca.asp>. Access in Oct. 2.
TAIZ, L. & ZIEGER, E. 2004. Fisiologia vegetal. 3. ed. Porto Alegre: Artemed. 719p.
TENG, P. S. 1985 Construction of predictive models: II. Forecasting crop losses. Advances in Plant Pathology, 3:179-206.
USDA – United States Department of Agriculture. 2009. Available at: <http://www.usda.gov>. Access in jan. 31st.
VAN OIJEN, M. 1990. Photosynthesis is not impaired in healthy of blighted potato plants. Netherlands Journal of Plant Pathology, 96: 55-63.
VANDERKPLANK, J. E. 1963. Plant disease: epidemics and control. New York, Academic Press.
VASCONCELOS, E. S. 2006. Avaliação da qualidade de sementes e estimativa de parâmetros genéticos e do padrão de resposta às variações ambientais, em soja (Glycine max (L.) Merrill). 2006. f. Dissertação (Mestrado) – Universidade Federal de Viçosa, Viçosa.
WAGGONER, P.E. & BERGER, R.D. 1987. Defoliation, disease, and growth. Phytopathology, 77: 393-398.
WATSON, D. J. 1947. Comparative physiological studies on the growth of field crops. I. Variation in net assimilation rate and leaf area between species and varieties, and within and between years. Annals of Botany, 11(41): 41-76.
WEST, C.; BRIGGS, G. E. & KIDD, F. 1920. Methods and significant relations in the quantitative analyses of plant growth. New Phytologist, 19: 200.
YANG, X. B.; DOWLER, W. M.; TSCHANZ, A. T. & WANG, T. C. 1992. Comparing the effects of rust on plot yield, plant yield, yield components, and vegetative parts of soybean. Journal of Phytopathology, 136: 46–56.
ASIAN SOYBEAN RUST EFFECTS
ON PHYSIOLOGICAL COMPONENTS AND YIELD
1. ABSTRACT
2. INTRODUCTION
The United States is the world's leading soybean producer and exporter (70.70 million metric tons), followed by Brazil (58.19 million metric tons) and Argentina (45.5 million metric tons) (FAO, 2008).
These figures show the soybean importance for these country economics, and among the causes that reduce productivity, are the losses caused by diseases.
One of the most important diseases of the soybean is the Asian Soybean Rust (ASR). It has been a problem to almost all soybean-growing regions of the world (Purdue, 2008). The ASR is a severe disease caused by the fungus Phakopsora pachyrhizi that leads to significant crop losses, mainly because the infected leaves fall prematurely, which is preceded by yellowing and necrotic areas, limiting grain formation. When ASR occurs early in reproductive growth, the intense defoliation cannot be overcome from the plants and this can lead to pod abortion and fallen (Yorinori & Paiva, 2002). These kinds of losses have been attributed to reduction in the Leaf Area Index, because leaf necrosis and defoliation reduces light interception and photosynthesis (Aquino et al., 1992).
good conditions to pathogen, thus ultimately making disease management a difficult task. The effect on yield depends on the disease severity earliness in the host growth stage and can reduce yield as much as 80% (Ogle et al., 1979).
The crop loss assessment had been made in the past by correlating yield with disease severity, but most of the times, they cannot be used in other seasons and locations due to the indirect relationship between yield and disease, especially when a crop is grown under different production environments (Shah et al. 2004). Principally because of this problem, plant pathologists started to search for other variables that could conduct to a better understanding of yield loss.
The method proposed by Waggoner & Berger (1987) changed the focus from the pathogen to the host. Instead of disease severity, the parameters started to be based on host attributes, such as the leaves total area projected on a square meter of soil - Leaf Area Index (LAI) and healthy leaves (HLAI); how much time they persist in the plant - Leaf Area Duration (LAD) and the persistence of the healthy tissue - Healthy Leaf Area Duration (HAD); how much radiation can their leaves intercept – Radiation Interception (RI) and that intercepted by the leaves that still remain green in the plant - Healthy Leaf Area Absorption (HAA). Finally, Johnson (1987) replied that the pathogens not only affect the host capacity of radiation interception, but in their capacity to use it too – Radiation Use Efficiency (RUE).
Since this approach was proposed, many pathosystems have been studied and better relations between disease and production have been found. Advances have been made especially with beans (Bergamin Filho et al., 1997; Silva et al. 1998; Díaz et al., 2000; Jesus Junior et al., 2001; Bassanezi et al., 2001; Gianasi, 2002; Jesus Junior et al., 2003), soybean (Hartman & Sinclair, 1995; Koga et al., 2007), sunflower (Leite et al., 2005); potato (Shah et al. 2004a, 2004b, 2004c), peanut (Aquino et al., 1992); wheat and oats (McKirdy et al., 2002) and Populus spp. (May-De Mio et al., 2006).
Most of these studies did not take measurements of defoliation when it occurred, because it is so hard to take. Even so, Rotem et al. (1983) and Aquino et al. (1992) made some considerations about the importance to consider that plants can have the same disease severity, but different amounts of healthy foliage and the replacement or not of the fallen leaves. This is very important on the P. pachyrhizi - soybean pathosystem, because the disease comes from the bottom to the upper part of the plant and the most diseased leaves fell off in the soil and then, disease can seem to decrease or to be stable, when it is getting higher.
3. MATERIALS AND METHODS
3.1. Field experiments
Four field experiments were conducted at the Universidade Federal de Viçosa, Viçosa county, Minas Gerais State, Brazil. The experiments, independent from each other, were conducted in the rain and dry seasons: from November 2005 to March 2006 (rain), August to November 2006 (dry), October 2006 to February 2007 (rain) and October 2007 to January 2008 (rain) with soybean cv. ‘‘Monarca’’ in the first one, ‘‘Conquista’’ in the second and ‘‘Vencedora’’ for third and fourth trials. All cultivars are susceptible to rust and have determinate habit of growth. ‘‘Conquista’’ was used during winter season, because it is a medium-delayed cultivar and there is no need for too many sunlight hours, while ‘‘Vencedora’’ had needs longer days.
The soil was prepared in traditional way. The fertilization was based on chemical soil analysis. Before sowing, seeds were treated with fungicide (Thiram) and inoculated with Bradyrhizobium japonicum.
Each plot (14 m2) consisted of 4-m-long rows, spaced 0.5 m apart. There was 1.5 m between adjacent plots. To minimize interplot interference, only the five central rows of each plot were used for assessment (0.5 m at the end of each row was omitted).
used in commercial fields, which included planting, foliage fertilization by spray, insecticide sprays, weeding and irrigation.
Plants were naturally infected by Phakopsora pachyrhizi and irrigated during winter when the weather condition was dry. Irrigation was necessary to provide infection`s moisture conditions, ensuring enough leaf wetness to have the infection guaranteed. In order to obtain a range of disease levels, plants in different plots were sprayed with a fungicide (Tebuconazole) with a manual applicator until the running point. The treatments were, for the first experiment: (1) n spray = control; (2) 25% of the recommended fungicide dose (rfd) = 0.125 l/ha, (3) 50% rfd = 0.25 l/ha, (4) 75% rfd = 0.375 l/ha and (5) 100 rdf = 0.5 l/ha; for other experiments: 1: control (no sprayed); 2: 30 days after emergence (DAE); 3: 60 DAE; 4: 90 DAE = ; 5: two sprays, 30 and 60 DAE; 6: two sprays, 30 and 90 DAE; 7: two sprays, 60 + 90 DAE; and three sprays: 8: 30 + 60 + 90. The experiments were set in a randomized complete block design and five replications.
Every measurement was taken in three plants in each plot, randomly harvested, total of 75 plants in the first trial and 96 plants in the other trials, assessed weekly.
3.2. Crop growth
Crop growth was quantified by measuring soybean leaves. The increase in growth was measured in cm2 in all leaves of the harvested plants, using a Leaf Area Meter LI-3100C (LICOR Biosciences, Lincoln, NE).
3.3. Disease severity and defoliation
Disease severity was accessed using a diagrammatic scale (Godoy et al., 2006) on every leaf of three plants sampled weekly (n=96), starting with the appearance of the first symptoms. These total readings were divided by the number of leaves present to give an average rust for each plant (in percentage).
their total number. Defoliation data were used to correct disease severity values according to Aquino et al (1992):
yt = [( 1 – d ) yv ] + d
in which yt represents total disease severity, yv is the proportion of visible
disease, and d is the proportion of defoliation.
A correction of the natural defoliation was made through discounting the values obtained in the plots without disease incidence from the diseased ones.
Growth stage of plants harvested in each plot was determined and recorded at every assessment date, according to the descriptive scale of Fehr and Caviness (1977).
3.4. Yield and yield loss
Yield (Y) was determined at harvest maturity (growth stage R8). Ten relatively uniform plants were removed randomly from the 5 center rows, in each plot, to determinate the yield components. The yield components per plant were directly counted: filled and unfilled (shriveled) pods per plant, grains per pod, 100-seed weight, and total seed weight (g/plant), and total yield (g/m2). Weight was always determined after grains were dry to correct moisture to 12%.
Yield loss was determined by the comparison of yield (g/m2) on the plots with lower disease values against all the others and converted to percentage to allow comparisons, since cultivars have different actual yields.
3.5. Integral variables
number of observations among experiments, all the measurements made, were standardized (by average) by plant growth stage.
AUDPC was calculated as:
In which Yi= disease severity (% per unit) at the ith observation, Xi= time (days) at the ith observation, and n= total number of observations.
With 24 plants per m2, Leaf Area Index (LAI) was calculated, multiplying the average leaf area by 24. From the LAI, the Healthy Leaf Area Index (HLAI) (Waggoner and Berger, 1987) could be obtained as follows:
in which, X = asian soybean rust severity. And through LAI values, its integration over time reflects the Leaf Area Index Duration (LAD), which was defined by Watson (1947) as:
Healthy Leaf Area Duration (HAD) in days was calculated for each plant accordingly to Waggoner and Berger (1987):
Being the Radiation Intercepted (RI) in (MJ m-2) given by:
in which I= average of the incident solar radiation (MJ m-2) in the period between evaluations; k = extinction coefficient, for soybean k = 0.6 (Pengelly et al. 1999).
Healthy Leaf Area Absorption (HAA) for each plant was calculated as follows (Waggoner and Berger, 1997):
3.6. Data analysis
Calculations of the integral variables were made with Excel (Microsoft Office, 2005). All analysis of covariance were performed on the software SAS system (SAS Institute, Cary, NC), including the check of experiments three and four, with the same cultivar, to verify if they could be polled together.
3.7. Climate data
4. RESULTS
4.1. Temperature and solar radiation
Usually, in Brazilian southeast region, the summer (December to March) season is wet and it is called “the rainy season”, while it is dry in the winter (June to September) it is dry.
The average incident solar radiation values during the experiment period, from the sowing to R7 in the years 2005/2006, 2006 and 2007/2008 ranged from 12.41 (July, 2006) to 22.01 (January, 2006).
4.2. Disease severity and defoliation
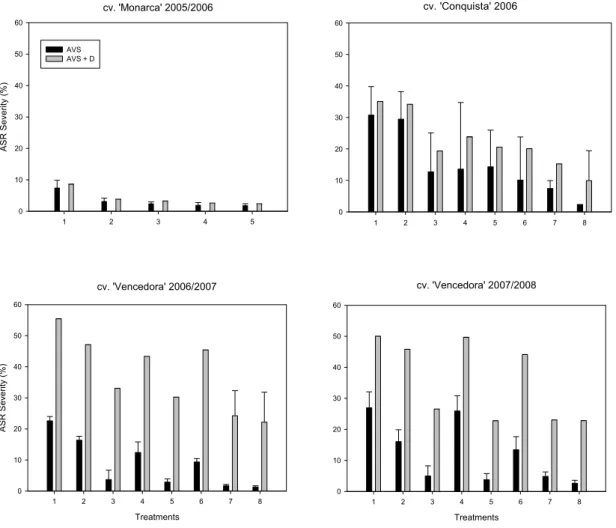
Healthy plants were not observed in any of the experiments at the end of epidemics. Plants sprayed three times were healthier for a longer period, but could not be maintained in this condition until the end of the host cycle (Figure 1).
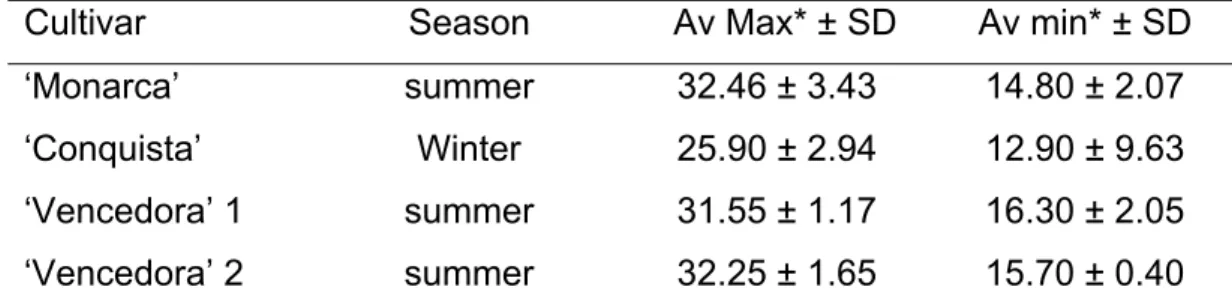
Table 1 – Temperature (°C) during trials for cultivars ‘Monarca’ (summer 2005/2006), ‘Conquista’ (winter 2006) and ‘Vencedora’ (summer 2006/2007 = 1 and 2007/2008 = 2). Viçosa, MG, Brazil
Cultivar Season Av Max* ± SD Av min* ± SD
‘Monarca’ summer 32.46 ± 3.43 14.80 ± 2.07 ‘Conquista’ Winter 25.90 ± 2.94 12.90 ± 9.63 ‘Vencedora’ 1 summer 31.55 ± 1.17 16.30 ± 2.05 ‘Vencedora’ 2 summer 32.25 ± 1.65 15.70 ± 0.40 AV max and AV min = average among maximum and minimum temperatures during the season, respectively. SD= standard deviation.
Epidemics duration varied in all four trials, leading to different assessment results, because evaluations started with the appearance of the first symptoms. To make comparisons, a standardization of the values was performed by averaging the values obtained in the same host growth stage. These averages were used in this work to weight host phenology instead of days after sown, because disease and host growth vary in different seasons and producing regions as weather conditions change.
During the experiments, natural infections occurred in all plots, and lesions caused by P. pachyrhizi were first noted right before or during bloom (between V8 and R1). The ASR severity was significantly different between non sprayed and sprayed treatments, irrespective of the experiment and cultivar (P<0.01).
Defoliation varied among experiments, but the maximum visual rust severity on attached leaves was higher in all experiments when defoliation was considered (Figure 1). As occurred with severity, the defoliation was significantly different between non sprayed and sprayed treatments, irrespective of the experiment and cultivar (P<0.01).
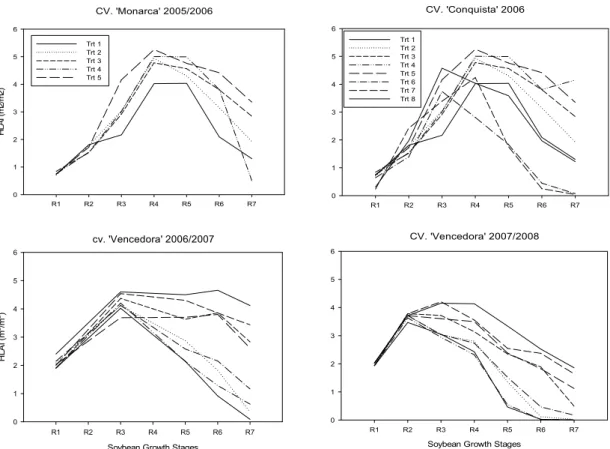
4.3. Crop growth
(Figure 2) because of the early defoliation provoked by the action of pathogens. Plants located in control plots (unprotected) reached stages R7 and R8 between 10 and 15 days before the protected ones, in all experiments, regardless of the cultivar.
cv. 'Monarca' 2005/2006
1 2 3 4 5
AS R Sev e ri ty ( % ) 0 10 20 30 40 50 60 AVS AVS + D
cv. 'Conquista' 2006
1 2 3 4 5 6 7 8
0 10 20 30 40 50 60
cv. 'Vencedora' 2006/2007
Treatments
1 2 3 4 5 6 7 8
A S R S e ve ri ty (%) 0 10 20 30 40 50 60
cv. 'Vencedora' 2007/2008
Treatments
1 2 3 4 5 6 7 8
0 10 20 30 40 50 60
CV. 'Monarca' 2005/2006
R1 R2 R3 R4 R5 R6 R7
HL AI ( m 2 /m 2 ) 0 1 2 3 4 5 6 Trt 1 Trt 2 Trt 3 Trt 4 Trt 5
CV. 'Conquista' 2006
R1 R2 R3 R4 R5 R6 R7 0 1 2 3 4 5 6 Trt 1 Trt 2 Trt 3 Trt 4 Trt 5 Trt 6 Trt 7 Trt 8
cv. 'Vencedora' 2006/2007
Soybean Growth Stages
R1 R2 R3 R4 R5 R6 R7
HL AI ( m 2/m 2) 0 1 2 3 4 5 6
CV. 'Vencedora' 2007/2008
Soybean Growth Stages
R1 R2 R3 R4 R5 R6 R7 0 1 2 3 4 5 6
Figure 2 – Healthy Leaf Area Index (HLAI) in different soybean growth stages, for all treatments, in three different soybean cultivars between 2005 and 2008. Viçosa, MG, Brazil. Treatments were obtained with fungicide tebuconazole: ‘Monarca’ = 1: no fungicide spray, the others, three sprays with different concentrations: 2: 0.125 l/ha, 3: 0.25 l/ha; 4: 0.375 l/ha and 5: 0.5 l/ha; to ‘Conquista’ and ‘Vencedora’ = 1: no spray; 2: 0.5 l/ha, in R1; 3: 0.5 l/ha, in R3; 4: 0.5 l/ha, in R5; 5: 0.5 l/ha, two sprays, R1and R3; 6: 0.5 l/ha, two sprays, R1 and R5; 7: 0.5 l/ha, two sprays, R3 and R5; and 0.5 l/ha, three sprays: R1, R3 and R5.
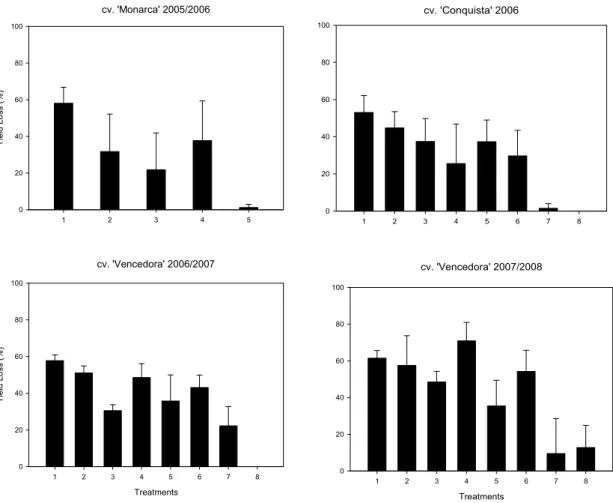
4.4. Yield and yield loss
The maximum winter yield was lower than those obtained in summer, as it is typical for this crop in Brazil, and the yield in all experiments was further lowered by rust epidemics, increasing yield loss (Figure 3).
cv. 'Monarca' 2005/2006
1 2 3 4 5
Yi e ld L os s (% ) 0 20 40 60 80 100
cv. 'Conquista' 2006
1 2 3 4 5 6 7 8
0 20 40 60 80 100
cv. 'Vencedora' 2006/2007
Treatments
1 2 3 4 5 6 7 8
Yi e ld L os s (%) 0 20 40 60 80 100
cv. 'Vencedora' 2007/2008
Treatments
1 2 3 4 5 6 7 8
0 20 40 60 80 100
Figure 3 – Yield loss (percentage reduction of grams per plant from treatment 8 - three fungicide sprays in relation to other treatments) in soybean, caused by Phakopsora pachyrhizi in three different soybean cultivars in consecutive years. Viçosa, MG, Brazil. Treatments were obtained with fungicide tebuconazole: ‘Monarca’ = 1: no fungicide spray; 2: 0.125 l/ha; 3: 0.25 l/ha; 4: 0.375 l/ha and 5: 0.5 l/ha; ‘Conquista’ and ‘Vencedora’ = 1: no spray; 2: 0.5 l/ha, in R1; 3: 0.5 l/ha, in R3; 4: 0.5 l/ha, in R5; 5: 0.5 l/ha, two sprays, R1and R3; 6: 0.5 l/ha, two sprays, R1 and R5; 7: 0.5 l/ha, two sprays, R3 and R5; and 0.5 l/ha, three sprays: R1, R3 and R5. Vertical bars represent ± standard error.
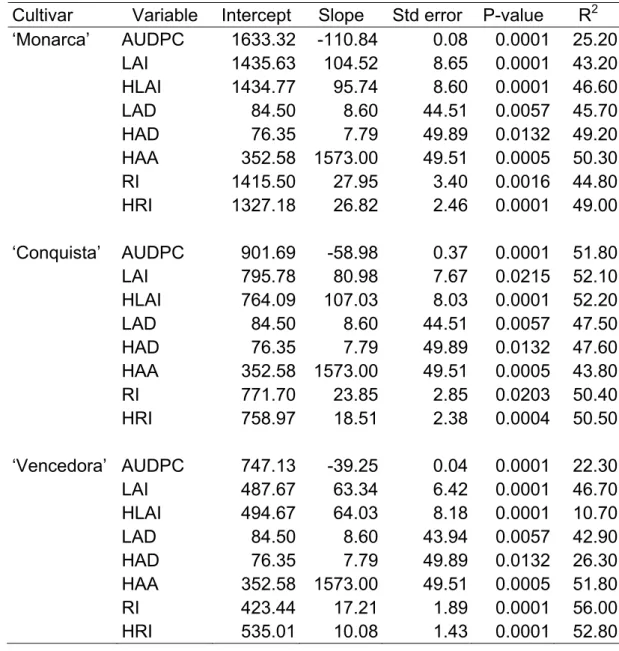
4.5. Integral variables related to yield
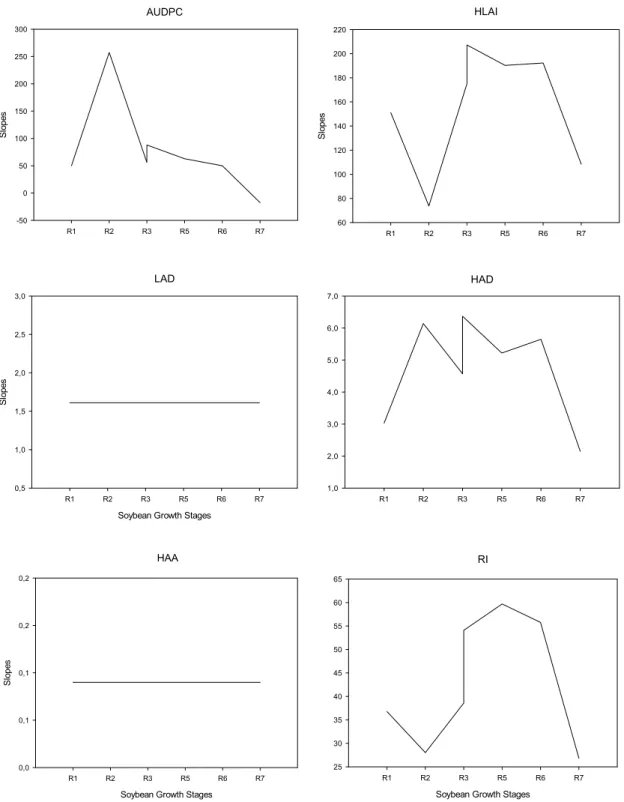
4.5.1. Area Under Disease Progress Curve (AUDPC)
Table 2 – Parameters of regression models (intercept and slope) , probability and coefficient of determination (R2) between soybean yield (g/m-2) and Area Under Disease Progress Curve (AUDPC), Leaf Area Index (LAI – m-2/m-2), Healthy Leaf Area Index (HLAI - m-2/m-2), Leaf Area Duration (LAD - days), Healthy Area Duration (HAD - days), Healthy Area Absorption (HAA – MJm-2), Intercepted Radiation (IR - MJm-2) and HRI (Radiation Intercepted by the Healthy leaf area - MJm-2) for cultivars ‘Monarca’, ‘Conquista’ and ‘Vencedora’, in consecutive years (2005-2008). Viçosa, MG, Brazil. (n=2181)
Cultivar Variable Intercept Slope Std error P-value R2 ‘Monarca’ AUDPC 1633.32 -110.84 0.08 0.0001 25.20
LAI 1435.63 104.52 8.65 0.0001 43.20
HLAI 1434.77 95.74 8.60 0.0001 46.60
LAD 84.50 8.60 44.51 0.0057 45.70
HAD 76.35 7.79 49.89 0.0132 49.20
HAA 352.58 1573.00 49.51 0.0005 50.30
RI 1415.50 27.95 3.40 0.0016 44.80
HRI 1327.18 26.82 2.46 0.0001 49.00
‘Conquista’ AUDPC 901.69 -58.98 0.37 0.0001 51.80
LAI 795.78 80.98 7.67 0.0215 52.10
HLAI 764.09 107.03 8.03 0.0001 52.20
LAD 84.50 8.60 44.51 0.0057 47.50
HAD 76.35 7.79 49.89 0.0132 47.60
HAA 352.58 1573.00 49.51 0.0005 43.80
RI 771.70 23.85 2.85 0.0203 50.40
HRI 758.97 18.51 2.38 0.0004 50.50
‘Vencedora’ AUDPC 747.13 -39.25 0.04 0.0001 22.30
LAI 487.67 63.34 6.42 0.0001 46.70
HLAI 494.67 64.03 8.18 0.0001 10.70
LAD 84.50 8.60 43.94 0.0057 42.90
HAD 76.35 7.79 49.89 0.0132 26.30
HAA 352.58 1573.00 49.51 0.0005 51.80
RI 423.44 17.21 1.89 0.0001 56.00
AUDPC
R1 R2 R3 R5 R6 R7
S lop es -50 0 50 100 150 200 250 300 HLAI
R1 R2 R3 R5 R6 R7
S lop es 60 80 100 120 140 160 180 200 220 LAD
Soybean Growth Stages
R1 R2 R3 R5 R6 R7
Slo p e s 0,5 1,0 1,5 2,0 2,5 3,0 HAD
R1 R2 R3 R5 R6 R7
1,0 2,0 3,0 4,0 5,0 6,0 7,0 HAA
Soybean Growth Stages
R1 R2 R3 R5 R6 R7
S lop es 0,0 0,1 0,1 0,2 0,2 RI
Soybean Growth Stages
R1 R2 R3 R5 R6 R7
25 30 35 40 45 50 55 60 65