Original Article
Artigo Original
Culturally diverse attitudes and beliefs of
students majoring in speech-language
pathology
Maria Claudia Franca1
Linda McCabe Smith1
Jane Luanne Nichols1
Dianna Santos Balan1
Keywords
Attitudes Beliefs Bias Multicultural Diversity Higher Education in SLP
Correspondence address:
Maria Claudia Franca
Rehabilitation Institute, Southern Illinois University Carbondale Rehn Hall, Mail Code 4609, Carbondale, IL 62901, USA. E-mail: [email protected]
Received: September 24, 2015
Accepted: April 29, 2016
Study carried out at Communication Disorders and Sciences Program, Rehabilitation Institute, Southern Illinois University Carbondale - Carbondale (IL), USA.
1 Southern Illinois University Carbondale - Carbondale (IL), USA.
Financial support: nothing to declare.
Conlict of interests: nothing to declare.
ABSTRACT
INTRODUCTION
When working with multicultural populations, speech-language pathologists (SLPs) should provide services that are culturally appropriate. Increasing culturally competent research and education
in the speech-language pathology (SLP) ield are important steps
to prepare professionals for serving consumers within an ethical environment, infused by shared trust and respect(1). The United
States Census Bureau(2) provides clear evidence that diversity
is steadily growing. There are more U.S. residents speaking more languages and dialects of the English language than ever before, and an increasing number of adults learning English as a second language (ESL)(3). It stands to reason that the ideal
SLP education philosophy should consider multicultural issues. In order to meet the communication needs of a growing multicultural population in increasingly globalized communities, SLPs are challenged to provide culturally competent services. This may not be a simple task, with approximately 90% of
ASHA afiliated SLPs identifying with a Caucasian background, as estimated by the demographic proile of certiicate holders
from the American Speech-Language-Hearing Association (ASHA)(4). These professionals may lack the understanding of
other cultures and may be uncertain about designing assessments for individuals from a diverse background. They must receive adequate education, with multicultural awareness, in order to build knowledge of a variety of culturally appropriate techniques(5,6).
Hence, culturally competent SLPs should be aware of their own values and biases and be sensible to the values and needs of individuals with diverse backgrounds(7). SLPs must develop
a thoughtful and sensitive attitude about cultural background because there are no established solutions for dealing with every situation involving a diverse caseload(8).
According to ASHA’s system of accreditation for college and university graduate programs, academic education in
communication disorders should be speciically designed to
prepare students for entry into professional practice and provide
curriculum that relects current knowledge, skills, technology,
scope of practice, and the diversity of society(9). However, faculty
are often unsure how to develop and implement multicultural competence instruction(10). Moreover, rather than leading
students to become aware of their own stereotypes and beliefs, typical multicultural training and literature tend to focus on the differences of the clients such as diversity of origins and cultural backgrounds(8). Therefore, students may be trained to acknowledge
differences, but they may lack the necessary personal insight to change their own behaviors to correspond with the treatment needs of clients from diverse cultures. Incongruities between the commitment to multicultural training and the execution of producing culturally competent SLPs should be addressed(11).
It has been suggested that accessibility to cultural and linguistic diversity (CLD) may impact attitudes and beliefs of pre-professional clinicians toward diversity, particularly in light of a previous similar investigation involving students majoring in rehabilitation. The aforementioned study’s outcomes unveiled concerns associated with general needs of increasing education and awareness toward cultural diversity in higher education(12).
Additionally, Kritikos conducted an investigation involving SLPs, concluding that lack of education regarding language
diversity resulted in low eficacy in providing services to CLD
individuals(13). Furthermore, Preis revealed that studies involving
SLP students suggested that CLD coursework may impact their attitudes and behavior surrounding diversity(14).
A pluralistic education should encourage future professionals to adjust to the client’s worldview(15). As such, examination
of diversity self-perceptions is fundamental in multicultural education, ultimately having an impact on the development of clinical skills(15,16). Thus, in addition to implementation of
preferred models of cultural competence such as infusion, in which multicultural concepts and issues are treated as integral components throughout the entire training program(11),
self-assessment of attitudes and beliefs toward diversity should be a starting point in multicultural education(17,18). Furthermore,
increased exposure to multicultural coursework may result in higher levels of multicultural competency.
This study seeks to examine the relationship between aspects that represent multicultural experiences and attitudes toward
language diversity in SLP students, speciically examining attitudes
and beliefs of SLP students toward the accents of nonnative speakers of Standard American English (SAE). This strategy for
collecting data may also generate relections and considerations
regarding multicultural awareness in respondents.
Communication with an accent
Language, more than any other aspect of human communication,
deines origins(19). An accent refers to a phonetic trait from a
person’s original language that is carried over a second language, and a dialect refers to a language variation associated with a particular region, social class, or ethnicity(20). Both concepts are
applicable to all languages and all speakers(21,22).
Research in language acquisition demonstrates that most people retain their original accents when acquiring a second language after childhood(23,24). It is natural that the native
language’s phonological system has an impact on ESL(24). Historically, the U.S. has a wide range of inlux of people from
several linguistic and cultural backgrounds(25). It is reasonable
to expect that many of these individuals’ use of English will be characterized by an accent. As such, accents should be treated as a fundamental part of cultural diversity.
Moreover, accent is a subjective concept. An individual does not have to be from another country to have an accent. Individuals from different regions of the same country can sound very dissimilar. Interestingly, people are frequently convinced that they are the only ones without an accent(26). Nonetheless,
all individuals speak with an accent and/or a dialect, depending on the person’s origin and current location(20). Speech sound
production, its transmission, and perceptual features of listeners vary according to several elements, such as socio-economic status, education, geographic origin and cultural background(27,28). Further,
Bias
Despite general self and collective unawareness, people tend to act and react based on preconceived notions and attitudes(18).
The inability to consciously recognize personal bias may characterize an “implicit bias” which can shape interactions with others(29). The dilemma surrounding implicit bias stems
from the apparent seeming inevitability of stereotyping which plays a helpful role in creating associations for quick retrieval as part of our everyday cognitive functions, but has a negative
effect when these inevitable associations do not relect our true
values, appreciations or goals(29).
Clinicians should avoid developing stereotypes and keep the individual at the forefront of any clinical encounter. This includes developing the competence to accept and appreciate others’ cultural viewpoint(17,29). Efforts to increase cultural awareness
among future SLPs should prioritize self-examination, as an attempt to identify biases from their own culture and how this can have an impact in working with clients. Therefore, clinicians should conduct an examination of their personal attitudes and beliefs regarding diversity(17,29).
American Speech-Language-Hearing Association (ASHA)
position on accent
ASHA’s Code of Ethics states that SLPs and audiologists must deliver services equally to accented and non-accented clients.
ASHA afiliates are urged to encourage an understanding of
linguistic differences among consumers and the general population. Additionally, according to ASHA, SLPs and audiologists are responsible to educate clients, parents, and other professionals about CLD acceptance(21). That same nondiscriminatory behavior
is expected in recruiting students for higher education programs and hiring SLPs and audiologists(19,20). Students and professionals
in communication sciences and disorders who speak with an accent or a dialect can effectively provide speech, language, and audiological services to persons with communication disorders, provided that they have the expected level of knowledge about normal and disordered communication(20,21).
Furthermore, nonnative speakers who want to modify their speech production in order to accommodate speech-related tasks and needs, may choose to receive accent reduction services.
Accent modiication assistance is included under the scope of
practice in SLP, under elective services targeting communication performance enhancement(30).
Multicultural education in communication disorders Attitudes about racial issues have an impact on multicultural development in clinicians(16). Therefore, multicultural competence
should be added to the ability to develop attitudes, beliefs, knowledge, and skills in working with individuals from diverse backgrounds. An increase in exposure to CLD should lead to
higher levels of multicultural proiciency.
Communication disorders students should be aware about the impact of culture on communication. Moreover, they should acquire multicultural competence in order to work with clients from diverse cultures. Although multicultural content typically
has been included in curricula using infusion and embedding approaches(9), courses on multicultural issues may tend to address
broad principles of language and social structure regarding cultural group variations(11). Nevertheless, it is essential to address
personal issues such as bias, prejudice and discrimination as well. Increasing awareness regarding these topics could have a positive impact on perception, and ultimately on treatment of future clients(15).
Rationale
A need to reduce cultural bias in speech-language clinical management has been described in the literature(17,18). A study
conducted prior to this investigation using a population of pre-professionals in rehabilitation revealed that a greater exposure to individuals with CLD backgrounds may increase multicultural awareness in university students, which can in turn impact quality of professional services delivered in the future(12).
While the literature hints that increased CLD experiences tend to reduce cultural bias, there is a need to validate this
concept in order to advance evidence based practices in the ield. Furthermore, understanding the speciic role of accented speech
in cultural background should lead future clinicians to provide culturally relevant services. Outcomes from this introductory study shall enlighten critical aspects of attitudes and beliefs of pre-clinicians towards CLD, such as self-reported cultural bias.
Results ought to prompt relections for further investigation, as
well as considerations in developing curricula for SLP programs.
METHODS Participants
The participants in this investigation were 20 undergraduate university students from a large university located in the U.S. Midwest, with a current enrollment of approximately 20,000 students. The participants were majoring in speech-language pathology; 17 female and 3 male, ranging in age from 18 to 35 years, all of whom were native English speakers, identifying themselves as primarily from a Caucasian background. Following appropriate approval by the Institutional Review Board (Southern Illinois University Carbondale Human Subjects Committee, Protocol Number 15091), the researcher contacted and explained this investigation to instructors. After the instructors’ endorsement, their students were invited to participate. The legitimate population associated with the inferential process is an abstract population similar to those included in the sample.
Data collection
Questionnaire
The questionnaire implemented in this study was based on an instrument designed for a previous study applied to university students including demographic data in addition to questions related to attitudes about the announcement in particular and toward language diversity in general(12). Items included on a
research(13,14), and revised several times based on feedback from
University faculty.
The instrument included 50 questions regarding feelings concerning diversity, level of regular interaction with diverse populations, amount of information about diversity, and extent of CLD education. Participants were asked to indicate how true each statement was in their opinion by circling a number using a Likert-type scale. Association with level of agreement or disagreement with the statements posed were conducted using
numbers from one to ive. Additionally, participants were asked
to estimate weekly interaction time with people who are from diverse backgrounds, as well as weekly time spent acquiring information about diversity. Furthermore, questions involved the extent of knowledge about aspects of diversity acquired both at university and non-university levels (see Appendix A). Demographic information included age and gender, directly indicated on scan sheets.
Procedure
The research study and instructions for completing the consent form and questionnaire were presented by a research assistant. After obtaining a signed consent form to join the study from each participant, an oral announcement of 200 words, describing a research related event on campus of interest of the participants, was given by a graduate student who speaks English as a second language (ESL) with a nonnative accent. Immediately after listening to the announcement, participants were asked to record responses in scan sheets. The responses were then electronically captured by optical scanning equipment.
Design
Correlations between speciic concepts were applied to
the data in order to inspect key aspects of the study. Multiple regressions were also used in this investigation, as a tentative approach to extend examination of the data. An a-priori power
analysis indicated that with alpha coeficient and power set
at .05 and.80, the present study needed 20-40 participants to detect a small effect.
Variables
In this study, items from the questionnaire were used in bidirectional correlations as well as a dependent and independent variables (i.e., criterion and predictors), with emphasis in identifying factors that may suggest an association with self-reported cultural bias. Correlations of self-reported CLD bias and all other variables were tested. Furthermore,
statements such as “I usually have dificulty paying attention
to what ESL speakers are saying” and “I would rather have a native language speaker giving the announcement, were applied as predictors of item number 12, which stated “I have cultural biases.” Additional instances involved regularity of interaction and information about individuals from diverse characteristics such as age, gender, language, nationality, physical abilities, mental abilities, race, ethnicity, religion, and sexual orientation as predictors of self-reported cultural bias (see Appendix).
Data analysis
Statistical analyses were computed using SPSS software version 20.0 (SPSS Inc., Chicago. IL). Frequency distributions were also applied to examine the data. Because a change in
the level of signiicance will affect the risk for both Type I and
Type II error, the traditional alpha level of .05 was selected for the current study.
Variables in this study were analyzed using correlation statistical techniques. Prior to testing the hypotheses of the present study, the assumptions of correlation and multiple regression (i.e., normality, homoscedasticity, linearity, and independence of observations) were assessed. Results of the skewness and kurtosis analyses revealed that the data were normally distributed. Next, the assumption of homoscedasticity was tested using a visual analysis of bivariate scatter plots of residuals for all predictor and dependent variables. The visual analysis revealed that the variances of the error terms were normally distributed and constant, thus indicating the assumption of homoscedasticity was met. The assumption of linearity was tested by using a visual analysis of scatter plots of the variables of interest, demonstrating a linear relationship. Lastly, it was inferred that the assumption of independence of observations was met because each participant completed their own questionnaire individually.
RESULTS
Multicultural exposure
Frequency counts signaled limited exposure of participants to people of various cultures: 80% of the participants reported having minimal contact (i.e., less than one hour per week or no contact at all) with ESL speakers, approximately 50% of the participants reported having minimal contact with people from diverse race and ethnicity, and 60% of the participants reported having minimal contact with people of diverse nationalities. Furthermore, 75% of the participants reported having minimal access to information about ESL speakers; approximately 60% of the participants reported having minimal weekly access to information about people of diverse nationality, race, and
ethnicity. Possible limited CLD proiciency was suggested by
participants’ indication (i.e., agree/strongly agree) of making a special effort to interpret what the speaker was saying (85%), and hardly thinking about multicultural issues (30%). Only 15% of the participants acknowledged awareness of their own cultural bias (see Tables 1, 2, Figures 1, 2 and 3).
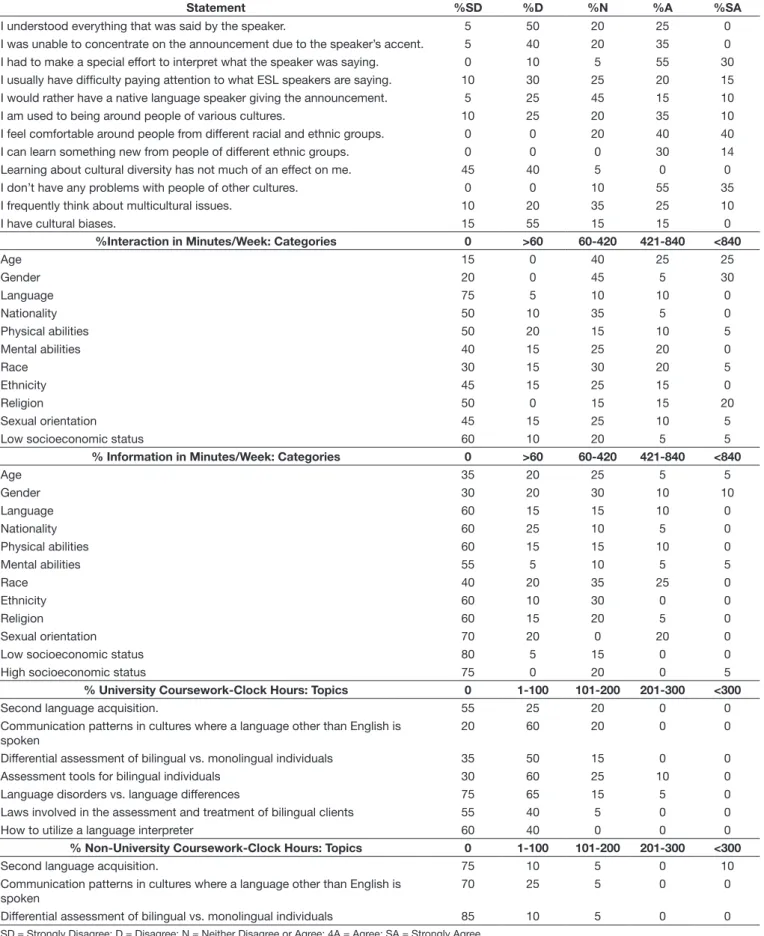
Table 1. Attitudes and beliefs toward CLD in SLP students: summary of responses
Statement %SD %D %N %A %SA
I understood everything that was said by the speaker. 5 50 20 25 0 I was unable to concentrate on the announcement due to the speaker’s accent. 5 40 20 35 0 I had to make a special effort to interpret what the speaker was saying. 0 10 5 55 30 I usually have difficulty paying attention to what ESL speakers are saying. 10 30 25 20 15 I would rather have a native language speaker giving the announcement. 5 25 45 15 10 I am used to being around people of various cultures. 10 25 20 35 10 I feel comfortable around people from different racial and ethnic groups. 0 0 20 40 40 I can learn something new from people of different ethnic groups. 0 0 0 30 14 Learning about cultural diversity has not much of an effect on me. 45 40 5 0 0 I don’t have any problems with people of other cultures. 0 0 10 55 35 I frequently think about multicultural issues. 10 20 35 25 10
I have cultural biases. 15 55 15 15 0
%Interaction in Minutes/Week: Categories 0 >60 60-420 421-840 <840
Age 15 0 40 25 25
Gender 20 0 45 5 30
Language 75 5 10 10 0
Nationality 50 10 35 5 0
Physical abilities 50 20 15 10 5
Mental abilities 40 15 25 20 0
Race 30 15 30 20 5
Ethnicity 45 15 25 15 0
Religion 50 0 15 15 20
Sexual orientation 45 15 25 10 5
Low socioeconomic status 60 10 20 5 5
% Information in Minutes/Week: Categories 0 >60 60-420 421-840 <840
Age 35 20 25 5 5
Gender 30 20 30 10 10
Language 60 15 15 10 0
Nationality 60 25 10 5 0
Physical abilities 60 15 15 10 0
Mental abilities 55 5 10 5 5
Race 40 20 35 25 0
Ethnicity 60 10 30 0 0
Religion 60 15 20 5 0
Sexual orientation 70 20 0 20 0
Low socioeconomic status 80 5 15 0 0
High socioeconomic status 75 0 20 0 5
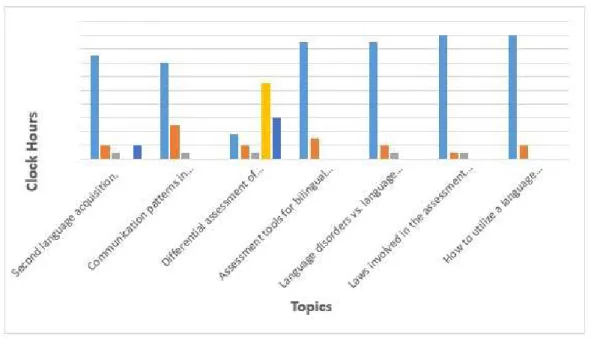
% University Coursework-Clock Hours: Topics 0 1-100 101-200 201-300 <300
Second language acquisition. 55 25 20 0 0
Communication patterns in cultures where a language other than English is spoken
20 60 20 0 0
Differential assessment of bilingual vs. monolingual individuals 35 50 15 0 0
Assessment tools for bilingual individuals 30 60 25 10 0
Language disorders vs. language differences 75 65 15 5 0
Laws involved in the assessment and treatment of bilingual clients 55 40 5 0 0
How to utilize a language interpreter 60 40 0 0 0
% Non-University Coursework-Clock Hours: Topics 0 1-100 101-200 201-300 <300
Second language acquisition. 75 10 5 0 10
Communication patterns in cultures where a language other than English is spoken
70 25 5 0 0
Differential assessment of bilingual vs. monolingual individuals 85 10 5 0 0
Table 1. Continued...
Statement %SD %D %N %A %SA
Assessment tools for bilingual individuals 85 15 0 0 0
Language disorders vs. language differences 85 10 5 0 0
Laws involved in the assessment and treatment of bilingual clients 90 5 5 0 0
How to utilize a language interpreter 90 10 0 0 0
SD = Strongly Disagree; D = Disagree; N = Neither Disagree or Agree; 4A = Agree; SA = Strongly Agree
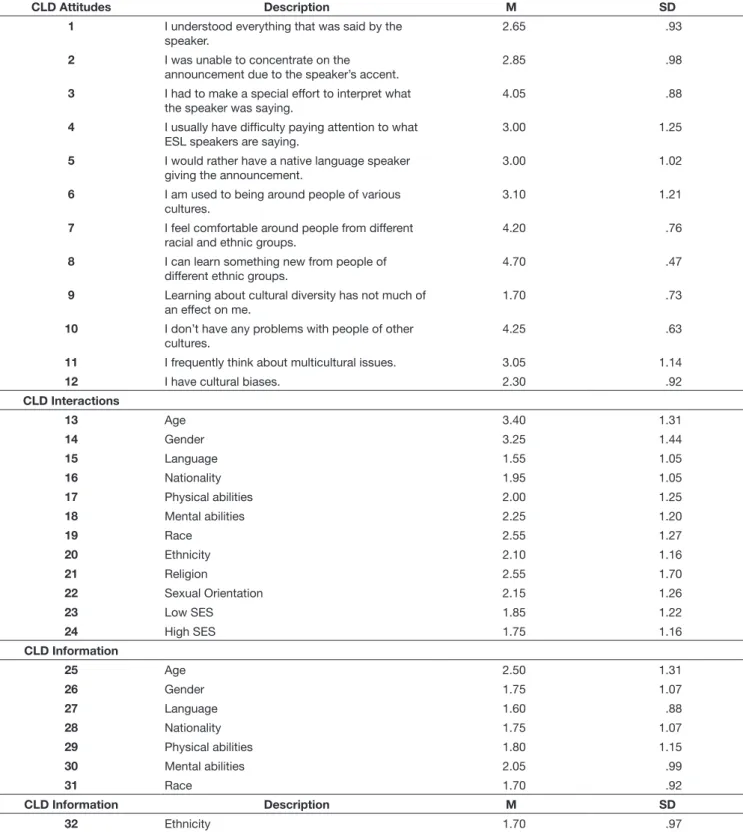
Table 2. Descriptive statistics
CLD Attitudes Description M SD
1 I understood everything that was said by the speaker.
2.65 .93
2 I was unable to concentrate on the announcement due to the speaker’s accent.
2.85 .98
3 I had to make a special effort to interpret what the speaker was saying.
4.05 .88
4 I usually have difficulty paying attention to what ESL speakers are saying.
3.00 1.25
5 I would rather have a native language speaker giving the announcement.
3.00 1.02
6 I am used to being around people of various cultures.
3.10 1.21
7 I feel comfortable around people from different racial and ethnic groups.
4.20 .76
8 I can learn something new from people of different ethnic groups.
4.70 .47
9 Learning about cultural diversity has not much of an effect on me.
1.70 .73
10 I don’t have any problems with people of other cultures.
4.25 .63
11 I frequently think about multicultural issues. 3.05 1.14
12 I have cultural biases. 2.30 .92
CLD Interactions
13 Age 3.40 1.31
14 Gender 3.25 1.44
15 Language 1.55 1.05
16 Nationality 1.95 1.05
17 Physical abilities 2.00 1.25
18 Mental abilities 2.25 1.20
19 Race 2.55 1.27
20 Ethnicity 2.10 1.16
21 Religion 2.55 1.70
22 Sexual Orientation 2.15 1.26
23 Low SES 1.85 1.22
24 High SES 1.75 1.16
CLD Information
25 Age 2.50 1.31
26 Gender 1.75 1.07
27 Language 1.60 .88
28 Nationality 1.75 1.07
29 Physical abilities 1.80 1.15
30 Mental abilities 2.05 .99
31 Race 1.70 .92
CLD Information Description M SD
32 Ethnicity 1.70 .97
Table 2. Continued...
33 Religion 1.50 .94
34 Sexual Orientation 1.35 .74
35 Low SES 1.60 1.14
36 High SES 2.65 .93
M = mean; SD = standard deviation; CLD = Cultural and Language Diversity
Frequency: 1=Strongly Disagree, 2=Disagree, 3=Neither Disagree or Agree, 4=Agree, 5 = Strongly Agree. Attitude Statements: I understood everything that was said by the speaker; I was unable to concentrate on the announcement due to the speaker’s accent; I had to make a special effort to interpret what the speaker was saying; I usually have difficulty paying attention to what ESL speakers are saying; I would rather have a native language speaker giving the announcement; I am accustomed to being around people of various cultures; I feel comfortable around people from different racial and ethnic groups; I can learn something new from people of different ethnic groups; Learning about cultural diversity has not much of an effect on me; I don’t have any problems with people of other cultures; I frequently think about multicultural issues; I have cultural biases
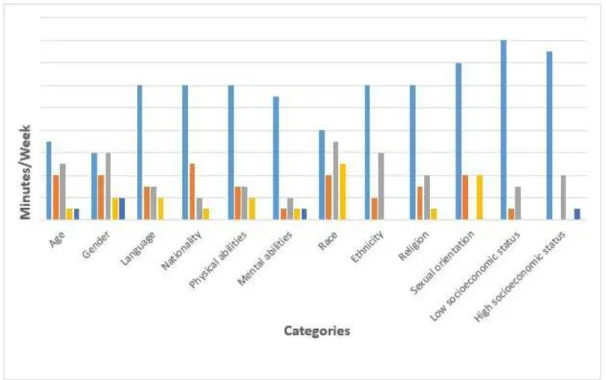
Figure 1. Attitudes and beliefs toward CLD in SLP students: Summary of responses
Minutes/Week: 1=0, 2=>60, 3=60,-420, 4=421-840, 5=<840. Categories: age, gender, language, nationality, physical abilities, mental abilities, race, ethnicity, religion, LSE, HSE
Cultural bias
In this study Pearson’s correlations were used to test relationships of self-reported cultural bias (i.e., I have cultural bias) and several variables (i.e., attitudes towards language diversity, level of CLD interaction and information, amount of university and non-university CLD coursework). Statistically
signiicant positive correlations were detected between cultural
bias and effort in interpreting CLD speech, r = .495, p = .013,
as well as between cultural bias and dificulty paying attention
to CLD speech, r = .454, p = .022. This indicates that higher levels of cultural bias were related to higher levels of effort in
interpreting CLD speech as well as dificulty paying attention
to CLD speech. Positive correlations were also demonstrated by the relationship between cultural bias and (a) level of interaction with low SES, r = .646, p = .001, as well as in (b) level of interaction with high SES, r = .465, p = .019 (see Table 3).
None of the other correlations were signiicant.
Stepwise multiple regression analysis was used as a tentative approach to further examine the strength of correlation between self-reported cultural bias and CLD attitudes and beliefs. Results from a combination model including all 11 statements from section A of the questionnaire (see Appendix A) indicated a
signiicant relationship among these factors, F = 5.835, p = .027,
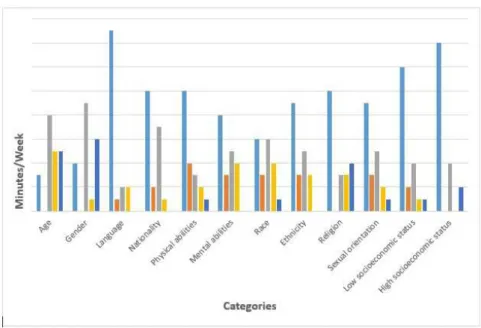
R2 = .245 (see Table 4). Making a special effort in interpreting CLD speech was found to have the strongest beta coeficient, Minutes/Week: 1=0, 2=>60, 3=60,-420, 4=421-840, 5=<840. Categories: age, gender, language, nationality, physical abilities, mental abilities, race, ethnicity, religion, LSE, HSE
Figure 3. Information in minutes/week
Clock Hours: 1=0, 2=1-100, 3=101-200, 4=201-300, 5=<300. Topics: Second language acquisition; Communication patterns in cultures where a language other than English is spoken; Differential assessment of bilingual vs. monolingual individuals; Assessment tools for bilingual individuals; Language disorders vs. language differences; Laws involved in the assessment and treatment of bilingual clients; How to utilize a language interpreter
indicating that this variable was the strongest contributor to the overall R2 followed by having dificulty paying attention
to CLD. Furthermore, cultural bias was predicted by level of interaction with individuals from diverse characteristics such as age, gender, language, nationality, physical and mental abilities, race, ethnicity, religion, sexual orientation, and socioeconomic status (see Appendix A). These combined variables statistically
signiicantly predicted cultural bias, F = 12.914, p = .002, R2 = .418;
the strongest contributors to the overall R2 in this model were
associated with interactions with diverse SES. A similar approach
applied to level of information about individuals from diverse
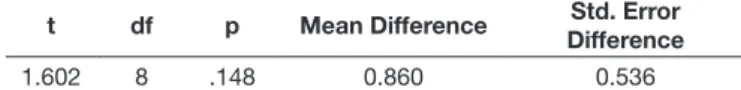
characteristic did not reach statistical signiicance (see Table 4). Additional analyses were performed using self-reported bias as criterion and responses to attitudes’ statements (i. e., questionnaire, section A) organized by “positive” and “negative” (i.e., 1, 6, 7, 8, 10 and 2, 3, 4, 5, 9 respectively) as predictors. A t-test revealed no differences between means of positive and negative statements (see Table 5). Lack of statistically signiicant decreases for some of the comparisons may be explained by the small sample size used in this stud as large sample sizes.
Table 3. Attitudes and beliefs toward language diversity in SLP students: Statistically significant correlations
Statements r p
Self-reported Cultural Bias & Special Effort to Interpret CLD Speech .495 .013 Self-reported Cultural Bias & Difficulty Paying Attention to CLD Speech .454 .022 Self-reported Cultural Bias and Interaction with Low SES .646 .001 Self-reported Cultural Bias and Interaction with High SES .465 .019
Table 4. Stepwise regression summaries Attitudes
Statements
R R2 R2 Change F Change df p F
.495 .245 .245 .027 19 .027 5.835
CLD
Interaction R R2 R2 Change F Change df p F
Overall .646 .418 .418 12.914 13 .002 12.914
CLD
Information R R2 R2 Change F Change df p F
Overall .928 .861 .861 2.862 13 .102 2.862
Criterion: I have cultural biases. Predictors: Attitude Statements; I understood everything that was said by the speaker; I was unable to concentrate on the announcement due to the speaker’s accent; I had to make a special effort to interpret what the speaker was saying; I usually have difficulty paying attention to what ESL speakers are saying; I would rather have a native language speaker giving the announcement; I am used to being around people of various cultures; I feel comfortable around people from different racial and ethnic groups; I can learn something new from people of different ethnic groups; Learning about cultural diversity has not much of an effect on me; I don’t have any problems with people of other cultures; I frequently think about multicultural issues
Clock Hours: 1=0, 2=1-100, 3=101-200, 4=201-300, 5=<300. Topics: Second language acquisition; Communication patterns in cultures where a language other than English is spoken; Differential assessment of bilingual vs. monolingual individuals; Assessment tools for bilingual individuals. Language disorders vs. language differences; Laws involved in the assessment and treatment of bilingual clients; How to utilize a language interpreter
DISCUSSION
The main objective of this study was to examine procedures and aspects involved in a broad investigation regarding attitudes
and beliefs regarding language diversity, by speciically examining
attitudes and beliefs of SLP students toward the accented speech of individuals who are nonnative Standard American English
(SAE) speakers. Understanding the speciic role of accented
speech in cultural background should lead future clinicians to provide culturally competent services.
Outcomes from this introductory study shall enlighten critical aspects of attitudes and beliefs of pre-clinicians towards CLD, such as self-reported cultural bias. Results should prompt
relections for further investigation, as well as considerations
in developing curricula for SLP programs.
Results of this work indicated critical areas that need to be further investigated so that a more comprehensive knowledge base can be established to include priority items for consideration when developing multicultural curricula in SLP programs.
The results suggest that exposure to CLD may impact attitudes and beliefs of SLP students toward diversity. This pilot study revealed correlations between students’ effort in interpreting CLD speech as well ability to pay attention to CLD speech with self-reported cultural bias. This may be associated with the
inding that a large of the participants reported having minimal
contact with those who are ESL speakers. Research in several disciplines has suggested that even minimal exposure to varied cultural groups may be associated with more positive attitudes, suggesting that educational activities allowing increased exposure
to varied cultural groups may be a beneicial addition to SLP
curricula. More than half of the participants reported having minimal access to information about ESL speakers and access to information about people of diverse nationality. Increasing exposure through the inclusion of guest speakers, through media supports and community activities are feasible additions to increase cultural competency. These outcomes are concurrent
with previous indings associated with needs of increasing
awareness towards cultural diversity in higher education, as
well as eficacy of services delivered(13,14).
CONCLUSION
Results of this study have a variety of implications and uses. While the recommendations for increased CLD training is a logical and intuitive conclusion for practice, fostering awareness
of implicit bias among students, given its dwelling unconscious nature, is much more complicated than fostering awareness of its explicit counterpart, which is consciously endorsed.
Data reported may help in determining procedures applicable in larger investigations regarding the effect of attitudes and beliefs toward language diversity in SLP. These results may also be considered when developing curricula in SLP programs. Finally, this study could inspire future research about attitudes and beliefs toward aspects of diversity.
REFERENCES
1. Wyatt T. Assessment issues with multicultural populations. In: Battle D, editor. Communication disorders in multicultural populations. 4th ed. St. Louis: Elsevier Mosby; 2012. p. 23-45.
2. United States Census Bureau [Internet]. U.S. Census Bureau projections show a slower growing, older, more diverse nation half a century from now. Washington: United States Census Bureau; 2012 [cited 2016 Oct 11]. Available from: https://www.census.gov/newsroom/releases/archives/ population/cb12-243.html
3. Huer M, Saenz T. Challenges and strategies for conducting survey and focus group research with culturally diverse groups. Am J Speech Lang Pathol. 2003;12(2):209-20. PMid:12828534. http://dx.doi.org/10.1044/1058-0360(2003/067).
4. ASHA: American Speech-Language-Hearing Association [Internet]. Demographic profile of ASHA certificate holders. Rockville: ASHA; 2015 [cited 2016 Oct 11]. Available from: http://www.asha.org/uploadedFiles/Demographic-Profile-Certificate-Holders-by-State.pdf#search=%22Demographic%22 5. Cartwright B. Multicultural counseling training: a survey of CORE-accredited
programs. Rehabil Educ. 2001;15(3):233-42.
6. Pedersen P. A handbook for developing multicultural awareness. 3rd ed. Alexandria: American Counseling Association; 2000.
7. Smith T, Chandler L, Wells C. The effect of an examiner’s race on the performance of African American children on the SCAN. Lang Speech Hear Serv Sch. 2000;31(2):116-25. http://dx.doi.org/10.1044/0161-1461.3102.116. 8. Davis B. Tools for teaching. 2nd ed. Indianapolis: Wiley; 2009. 9. ASHA: American Speech-Language-Hearing Association [Internet].
Multicultural/multilingual issues (MMI) in CSD curricula: resources for infusion. Rockville: ASHA; 2015 [cited 2016 Oct 10]. Available from: http://www. asha.org/about/leadershipprojects/multicultural/faculty/mmi. htm
10. Boysen G, Vogel D. Bias in the classroom: types, frequencies, and responses. Teach Psychol. 2009;36(1):12-7. http://dx.doi.org/10.1080/00986280802529038. 11. Horton-Ikard R, Munoz ML. Addressing multicultural issues in communication sciences and disorders. Contemp Issues Commun Sci Disord. 2010;37:167-73.
12. Franca M, Simpson K. Knowledge and attitudes of university students toward cultural and linguistic diversity. RCEA. 2011;4:21-32.
13. Kritikos E. Beliefs about the language assessment of bilingual/bicultural individuals. Am J Speech Lang Pathol. 2003;12(1):73-91. PMid:12680815. http://dx.doi.org/10.1044/1058-0360(2003/054).
14. Preis J. Education in cultural diversity: what makes a difference? In: Annual Convention of the American Speech-Language-Hearing Association; 2006 Nov 16-18; Miami. Proceedings. Rockville: ASHA; 2006. p. 1-7. 15. Franca M, Flowers C, Smith L, Pitt J. The impact of multiculturalism in
rehabilitation education. RCEA. 2007;1(1):51-9.
16. Cumming-McCann A, Accordino M. An investigation of rehabilitation counselor characteristics, white racial attitudes, and self-reported multicultural counseling competencies. Rehabil Couns Bull. 2005;48(3):167-76. http:// dx.doi.org/10.1177/00343552050480030501.
17. Moxley A. What’s your multicultural IQ? ASHA Lead. 2003;36:1-3. 18. Law B. Not all bias is obvious-even our own. ASHA Lead.
2013;18(1):46-50.
Table 5. Attitudes and beliefs toward language diversity in SLP students: Comparisons between positive and negative attitude’s statements
t df p Mean Difference Std. Error Difference
1.602 8 .148 0.860 0.536
19. Player M. Federal law of employment discrimination. 5th ed. St. Paul: West Group; 2004.
20. ASHA: American Speech-Language-Hearing Association [Internet]. Students and professionals who speak English with accents and non-standard dialects: issues and recommendations. Rockville: ASHA; 1998. Technical Report. [cited 2016 Oct 11]. Available from www.asha.org/policy
21. ASHA: American Speech-Language-Hearing Association [Internet]. Knowledge and skills needed by speech-language pathologists and audiologists to provide culturally and linguistically appropriate services. Rockville: ASHA; 2004. Knowledge and skills. [cited 2016 Oct 11]. Available from www.asha.org/policy
22. Myers-Jennings C. Phonological disorders in culturally diverse populations: intervention issues and strategies. In: Coleman T. Clinical management of communication disorders in culturally diverse children. Boston: Allyn & Bacon; 2000. p. 173-196.
23. Lippi-Green R. English with an accent: language, ideology, and discrimination in the United States. New York: Routledge; 1997.
24. Pantos A, Perkins A. Measuring implicit and explicit attitudes toward foreign accented speech. J Lang Soc Psychol. 2013;32(1):3-20. http:// dx.doi.org/10.1177/0261927X12463005.
25. Bauman-Waengler J. Articulatory and phonological impairments: a clinical focus. 2nd ed. Norman Heights: Allyn & Bacon, 2012.
26. Wolfram W, Christian D. Dialects in schools and communities. Mahwah: Lawrence Erlbaum; 1999.
27. Grunwell P. Clinical phonology. Baltimore: Williams & Wilkins; 1987. 28. Halle M, Stevens K. Some reflections on the theoretical basis of phonetics. In:
Limblom B, Ohman S, Fant G, editors. Frontiers of speech communication. London: Academic Press; 1979. p. 123-134.
29. Banaji M, Greenwald A. Blindspot: hidden biases of good people. New York: Delacorte Press; 2013.
30. ASHA: American Speech-Language-Hearing Association [Internet]. Scope of practice in speech-language pathology. Rockville: ASHA; 2015 [cited 2016 Oct 11]. Available from: http://www.asha.org/policy/SP2016-00343/
Author contributions
Appendix A. Attitudes and Beliefs Toward Cultural and Language Diversity (CLD) in University Students
Section A
Immediately after listening to the announcement made by a person who speaks English as a Second Language, please indicate how true is each statement by circling the appropriate number using the following scale:
1 = strongly disagree 2 = disagree 3 = neither disagree or agree 4 = agree 5 = strongly agree
Section B
Please refer to the following scale in order to answer questions 13-36:
A. 0
B. Less than 60 minutes per week
C. 60-420 minutes per week
D. 421-840 minutes per week
E. More than 840 minutes per week
Estimate the amount of time, in minutes per week, you interact with (talk /write to) people who are different from yourself in terms of the following characteristics:
13. Age
14. Gender
15. Language
16. Nationality
17. Physical abilities
18. Mental abilities
19. Race
20. Ethnicity
21. Religion
22. Sexual orientation
23. Low SES
24. High SES
1. I understood everything that was said by the speaker. 1 2 3 4 5 2. I was unable to concentrate on the announcement due to the speaker’s accent. 1 2 3 4 5 3. I had to make a special effort to interpret what the speaker was saying. 1 2 3 4 5 4. I usually have difficulty paying attention to what ESL speakers are saying. 1 2 3 4 5 5. I would rather have a native language speaker giving the announcement. 1 2 3 4 5 6. I am used to being around people of various cultures. 1 2 3 4 5 7. I feel comfortable around people from different racial and ethnic groups. 1 2 3 4 5 8. I can learn something new from people of different ethnic groups. 1 2 3 4 5 9. Learning about cultural diversity has not much of an effect on me. 1 2 3 4 5 10. I don’t have any problems with people of other cultures. 1 2 3 4 5 11. I frequently think about multicultural issues. 1 2 3 4 5
Estimate the amount of time, in minutes per week, you read, watch, or listen to factual information (as opposed to iction) about
people who are different from yourself in terms of the following characteristics:
25. Age
26. Gender
27. Language
28. Nationality
29. Physical abilities
30. Mental abilities
31. Race
32. Ethnicity
33. Religion
34. Sexual orientation
35. Low SES
36. High SES
Please refer to the following scale in order to answer questions 37-50:
A. 0
B. 1-100 h
C. 101-200 h
D. 201-300 h
E. More than 300 h
How many clock hours (not semester credit hours) have you had of university coursework that addressed the following?
37. Second language acquisition.
38. Communication patterns in cultures where a language other than English is spoken.
39. Differential assessment of bilingual vs. monolingual individuals.
40. Assessment tools for bilingual individuals.
41. Language disorders vs. language differences.
42. Laws involved in the assessment and treatment of bilingual clients.
43. How to utilize a language interpreter.
How many clock hours (not semester hours) have you had in non-university experiences that addressed the following?
44. Second language acquisition.
45. Communication patterns in cultures where a language other than English is spoken.
46. Differential assessment of bilingual vs. monolingual individuals.
47. Assessment tools for bilingual individuals.
48. Language disorders vs. language differences.
49. Laws involved in the assessment and treatment of bilingual clients.
50. How to utilize a language interpreter.