Predicting the Physiological Role of Circadian Metabolic
Regulation in the Green Alga
Chlamydomonas
reinhardtii
Sascha Scha¨uble1., Ines Heiland1
*., Olga Voytsekh2
, Maria Mittag2, Stefan Schuster1
1Department of Bioinformatics, Friedrich Schiller University Jena, Jena, Germany,2Institute of General Botany and Plant Physiology, Friedrich Schiller University Jena, Jena, Germany
Abstract
Although the number of reconstructed metabolic networks is steadily growing, experimental data integration into these networks is still challenging. Based on elementary flux mode analysis, we combine sequence information with metabolic pathway analysis and include, as a novel aspect, circadian regulation. While minimizing the need of assumptions, we are able to predict changes in the metabolic state and can hypothesise on the physiological role of circadian control in nitrogen metabolism of the green algaChlamydomonas reinhardtii.
Citation:Scha¨uble S, Heiland I, Voytsekh O, Mittag M, Schuster S (2011) Predicting the Physiological Role of Circadian Metabolic Regulation in the Green Alga
Chlamydomonas reinhardtii. PLoS ONE 6(8): e23026. doi:10.1371/journal.pone.0023026
Editor:Miguel A. Blazquez, Instituto de Biologı´a Molecular y Celular de Plantas, Spain
ReceivedMarch 16, 2011;AcceptedJuly 9, 2011;PublishedAugust 22, 2011
Copyright:ß2011 Scha¨uble et al. This is an open-access article distributed under the terms of the Creative Commons Attribution License, which permits unrestricted use, distribution, and reproduction in any medium, provided the original author and source are credited.
Funding:The study was funded by the German Federal Ministry of Education and Research (BMBF project 0315260A; http://www.bmbf.de/; http://www.forsys. net/). The funders had no role in study design, data collection and analysis, decision to publish, or preparation of the manuscript.
Competing Interests:The authors have declared that no competing interests exist.
* E-mail: heiland.ines@uni-jena.de
.These authors contributed equally to this work.
Introduction
Metabolic pathway analysis is a well established and very useful tool in Systems Biology [1,2]. One concept in this field is that of elementary flux modes (EFMs), which represents a minimal set of reactions that can operate at steady state with all reactions proceeding in the thermodynamically feasible direction [3]. The EFM approach has proved its value in diverse biotechnological applications [4]. It has been used to find efficient routes for the production of particular target compounds, such as fatty acids in plants [5], or methionine [6] and cyanophycin [7] in bacteria, to find possible targets for the engineering of metabolic networks through knock-outs or knock-ins [8,9], as well as to assess the impact of enzyme deficiencies [10,11] or the robustness of metabolic networks [12]. Note that in contrast to optimality based approaches like Flux Balance Analysis [13], EFM analysis has the advantage of providing a more comprehensive overview of the existing routes through a given network by providing a complete data set of possible fluxes rather than solely an optimality restricted set. A disadvantage arises from the problem of combinatorial explosion [14]. Therefore, it is impossible to compute all EFMs in genome-scale models up to now, although advances have been made recently coping with large networks [15].
Beside a growing number of methods for the analysis of metabolic networks, connecting experimental data to reconstruct-ed models remains a major task to systems biology [16–20]. However, this potential should not be underestimated, as immense data are produced by modern techniques, such as high throughput sequencing, as well as microarrays and proteomics. Moreover, inherent information in DNA sequences, like recognition motifs, can be utilised as well and ultimately applied to network analysis,
linking genomics, proteomics and metabolomics. This offers an access to regulation processes that possibly lead to altered metabolic fluxes and consequently influence the entire metabolism of an organism.
arginine, which permits physiological interpretation and compar-ison to known data from other organisms. These amino acids were chosen as they are either overrepresented inC. reinhardtiior contain a high nitrogen content in their side chain and, thus, are particularly suitable for nitrogen storage.
As we will show, the application of optimality principles that solely focus on analysing maximum yields like in Flux Balance Analysis [13], only offers a limited view on a given system and is therefore not suitable for our approach as the complete capability of the network has to be taken into account.
Results
As it is not feasible to analyse the complete metabolism ofC. reinhardtii using elementary flux mode analysis, we first had to confine our model.C. reinhardtiiis able to grow either autotrophi-cally, heterotrophically or mixotrophically. As we simulate only metabolism during the night here, we have chosen acetate and glucose-6-phosphate (G6P) as carbon sources. G6P is provided by starch degradation. The degradation is not explicitly included into the model.
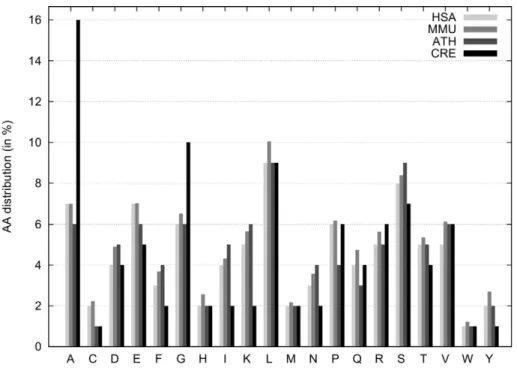
To model the nitrogen uptake, we analysed the biosynthesis of five different amino acids. First, we selected amino acids that have the highest nitrogen to carbon ratio, those are lysine, asparagine and arginine. Furthermore, we analysed the amino acid composition of all predicted proteins inC. reinhardtiiand identified glycine and alanine as most abundant and highly overrepresented amino acids compared to other organisms (Fig. 1). Additionally, glutamate, glutamine and aspartate are present in the model as intermediates.
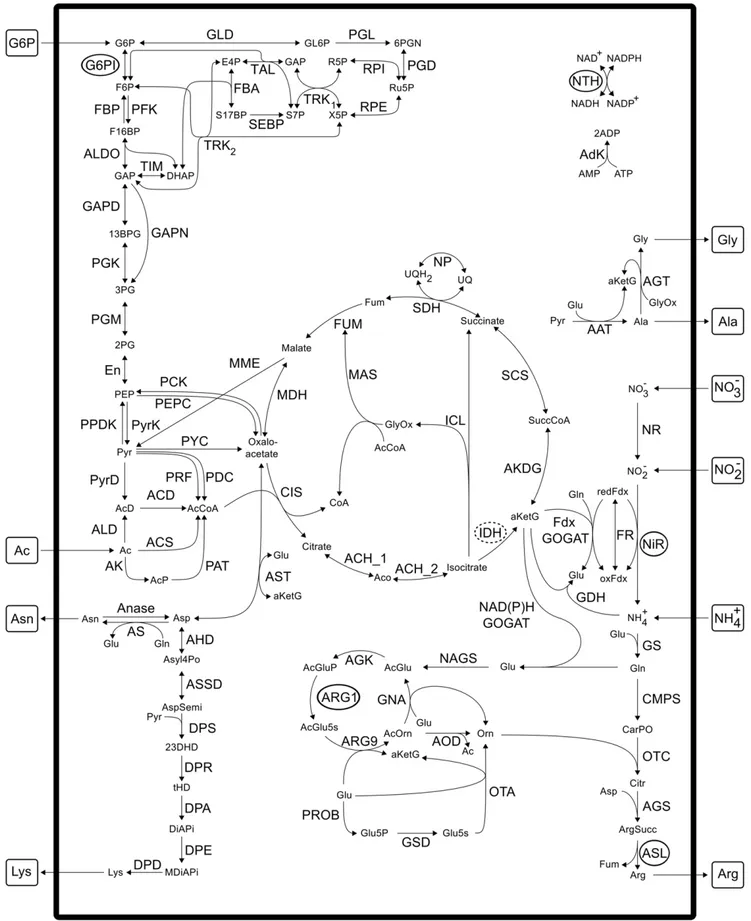
Taken together, our reconstructed model of nitrogen metabo-lism of C. reinhardtiicomprises 105 reactions and 95 metabolites. An overview is given in Fig. 2, while a complete list of reactions can be found in the Supplementary Tables S1 and S2. The sequence analysis revealed that six enzymes are entirely encoded
by mRNAs that containUG§7-repeats in their 39UTRs and are hence presumably under control of CHLAMY1 (Fig. 2).
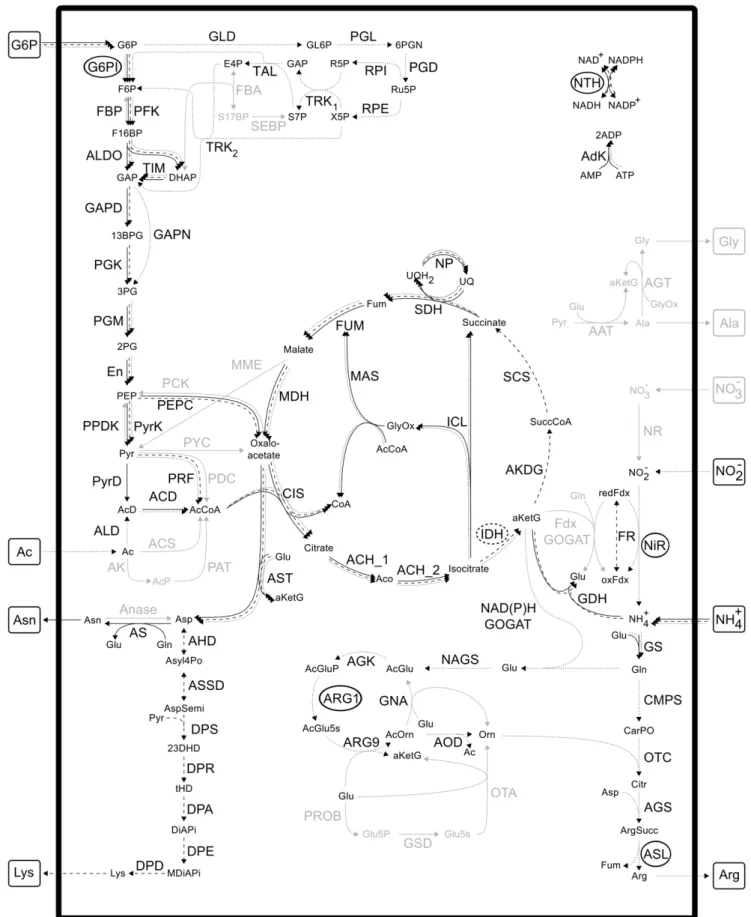
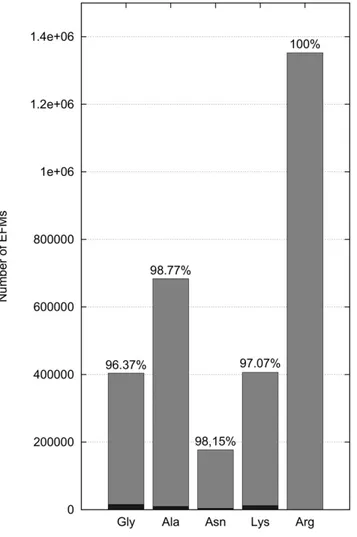
The computation of EFMs gave rise to 404252 EFMs for glycine, 684036 EFMs for alanine, 177294 EFMs for asparagine, 406560 EFMs for lysine and 1352352 EFMs for arginine biosynthesis, when G6P as well as acetate were assumed to be available. Three example EFMs are depicted in Fig. 3. The shown EFMs producing asparagine and lysine are the most efficient ones with respect to the yield of amino acids under study per mole carbon source. As for arginine, a less efficient mode is shown to reduce overlap with the other depicted modes and to show another variant, running via the pentose phosphate pathway.
Maximum carbon yields
To compare the biosynthetic yield of different amino acids, we calculated a so called carbon yield. As described in the Analysis section it was calculated based on the stoichiometric equations of EFMs. It represents the number of carbon atoms in the target amino acid divided by the number of carbon atoms in the carbon source. As beside G6P and acetate, CO2 was the only carbon source that was set external, a carbon yield lower than 1 corresponds to a release of CO2during biosynthesis. In contrast, a carbon yield greater than one corresponds to a non photosynthetic incorporation of CO2.
We compared maximum carbon yields of EFMs for the unperturbed system and the extreme case, where the mRNAs of enzymes under control of CHLAMY1 are completely downreg-ulated. For this analysis, we first computed all EFMs that convert one of the given carbon sources (G6P or acetate) into glycine, alanine, asparagine, lysine or arginine (Fig. 4). During a second run we removed those enzymes whose translation is potentially downregulated during the night by CHLAMY1. As argininosuc-cinate lyase (ASL) is encoded by an UG§7-repeat-containing mRNA and subsequently modelled inactive, there are no EFMs for arginine synthesis left under these conditions. Furthermore,
Figure 1. Distribution of amino acids among different species.Percentage share of amino acids are given for each amino acid using one letter code. The amino acid compositions of selected organisms were derived from complete genome ORF prediction from different databases (see Analysis section). HSA:Homo sapiens, MMU:Mus musculus, ATH:Arabidopsis thaliana, CRE:Chlamydomonas reinhardtii.
Figure 2. Overview of the reconstructed network of nitrogen metabolism inC. reinhardtii.Co-factors such as ATP and NAD(P)H creation or consumption, or CO2, phosphate and water as well as the reactions of pyrophosphatase and the electron transport chain are not shown. For a list of all abbreviations, modelled reactions and species, see Supplementary Tables S1 and S2. External metabolites are framed and enzymes, whose mRNAs are downregulated by CHLAMY1 are encircled. As only the NADPH dependent variant of isocitrate dehydrogenase (IDH) is affected by CHLAMY1, it is marked with a dashed circle.
doi:10.1371/journal.pone.0023026.g002
Figure 3. Three example elementary flux modes (EFMs).Solid arrows, most efficient EFM producing asparagine; dashed arrows, most efficient EFM producing lysine; dotted arrows, one selected EFM producing arginine via the pentose phosphate pathway.
since nitrite reductase has the same property, we do no longer find EFMs with nitrate and nitrite consumption if we assume complete downregulation of CHLAMY1 regulated mRNAs and thus, corresponding enzymes. Hence, in this case all EFMs use ammonium as sole nitrogen source.
Beside glycine, the maximum yields for biosynthesis of all amino acids are reduced, if complete downregulation by CHLAMY1 was assumed. However, analysing maximum yields only uses a very small portion of the information about the network’s metabolic capabilities. In contrast, EFMs offer a more detailed view on the metabolic capacity. This significant advantage will be exploited below.
Yield distribution
To make use of the full potential of flux distribution, we first took all EFMs and respective yields into account, rather than analysing solely optimised fluxes with respect to carbon yields. Again, as ASL is a key step in arginine biosynthesis that is inactivated by CHLAMY1, we did not conduct any further analysis of arginine metabolism.
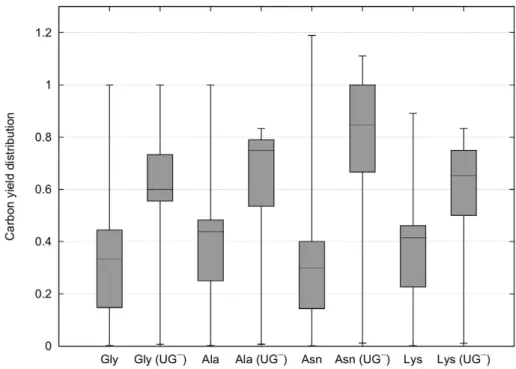
From Fig. 5 it can be observed that CHLAMY1 predominantly downregulates pathways that have lower yields. Although, the maximum yields decrease the mean carbon yields for all amino acids increase after removing EFMs affected by CHLAMY1 (Fig. 6).
Weighted influence
Note that until now all EFMs were discarded that contain at least one reaction that is under influence of CHLAMY1. However, such drastic downregulation is questionable and asks for a more realistic modelling.
In the following calculations we therefore circumvented the need to inactivate fluxes, regulated by CHLAMY1, which is usually enforced by EFM analysis. We now assume downregulation of the corresponding fluxes to 10% due to CHLAMY1 binding, rather than complete inactivation. We reduced the impact of inhibited EFMs by weighting EFMs differently, depending on whether they are under CHLAMY1 control or not (Fig. 7). The extent of downregulation by CHLAMY1 is chosen arbitrarily, as corre-sponding quantitative data is not available. However, reduction factors deviating slightly from 10% do not change the result qualitatively here. Note that downregulation leads to a reduced increase of the interquartile range compared to inactivation (see also Fig. 5). This is due to the large portion of CHLAMY1 controlled fluxes numbering 388832 (96.19%) for glycine, 674436 (98.6%) for alanine, 173543 (97.88%) for asparagine and 394404 (97.01%) for lysine biosynthesis, respectively (Fig. 8). However, this provides a more realistic view on the metabolic state than complete downregulation.
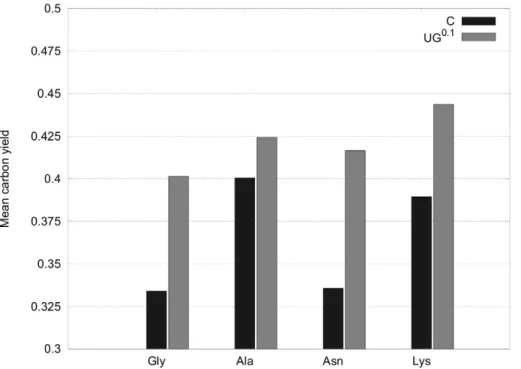
Additionally, we calculated the mean of molar yields by using the formula for weighted means given by Eq. (3). This enables us to weight every derived yield and hence, also the underlying flux, represented by its respective EFM. We applied a weight of 10% to EFMs affected by CHLAMY1 and a unity weight to all remaining fluxes. The resulting mean yield is considerably increased upon CHLAMY1 binding (Fig. 9).
Discussion
In this study, we have outlined a method that interconnects sequence based knowledge with metabolic pathway analysis. The method has been illustrated by nitrogen metabolism of C. reinhardtii, which is under the control of the circadian clock. The Figure 4. Comparison of maximum carbon yields that are obtained by EFM analysis. The carbon yield was calculated based on stoichiometric equations as described in the Analysis section. It represents the number of carbon atoms in the target amino acid divided by the number of carbon atoms in the carbon source. The comparison is based on ammonium uptake and all possible carbon sources (G6P and acetate). Yields correspond to two different conditions: C, the complete set of enzymes are active at normal rate;UG{
, all CHLAMY1 regulated mRNAs and thus, related enzymes are completely inactive. In this all-or-nothing modelling approach, growth on nitrate or nitrite, as well as arginine biosynthesis, is impossible if CHLAMY1 regulation is considered, since nitrite reductase (NiR) and argininosuccinate lyase (ASL) are essential for these processes (see text and Fig. 2).
doi:10.1371/journal.pone.0023026.g004
calculated elementary flux modes provide a data set that is well-suited for quantifying and understanding the complex architecture of this network. The large number of modes (e. g. 1352352 for
arginine) point to a considerable redundancy of this network. Intriguingly, our results show that downregulation of circadian controlled enzymes improves carbon distribution and thus, Figure 5. Carbon yield distribution considering complete inactivation.Box plots (with whiskers ranging from minimum to maximum and thick solid line indicating the median) of carbon yield distribution for glycine (Gly), alanine (Ala), asparagine (Asn) and lysine (Lys) associated pathways based on all available carbon sources. Complete inactivation of CHLAMY1 affected reactions is considered here. Knockout of ASL completely inhibits arginine biosynthesis and is hence, not shown (see also Fig. 2). If not marked withUG{
, boxplots show complete EFM distribution. Otherwise, they show distribution for all EFMs that are not affected by CHLAMY1 downregulation.
doi:10.1371/journal.pone.0023026.g005
Figure 6. Mean yields assuming complete downregulation by CHLAMY1.In contrast to Fig. 4, the carbon yields of either all EFMs (C) or all those EFMs that do not have CHLAMY1 regulated mRNAs (UG{
decreases energy consumption. The somewhat counter-intuitive result that knocking out or downregulating several enzymes may lead to an increase in average yield arises, because poor pathways are deleted or downregulated, so that more efficient pathways become more dominant. A similar phenomenon was observed earlier in the context of strain optimisation [9,27,28]. Our approach focuses on analysing altered fluxes due to regulatory influences in general. We compare two or more physiological situations (e. g. day- and night-time) rather than manipulated setups. Other examples may be provided by hibernation vs. summertime stage or different developmental stages such as embryonic vs. adult. The regulatory information can be provided in a wide variety of forms, including transcriptional regulatory events as time-dependent constraints [29].
Additionally, we have considered information derived from sequence data. Since it is known that many regulatory proteins bind to specific motifs in the mRNA or to promoters, such information is extremely useful in modelling regulation of metabolism. Moreover, measuring fluxes in detail is already a demanding task for simple model organisms, likeEscherichia colior Saccharomyces cerevisiae, but might be virtually infeasible for higher organisms, when regulatory complexity becomes more sophisti-cated. Thus, our approach proves to be an easy-to-use, helpful method to determine the type and impact of influences of regulatory factors.
Considering only the maximum carbon yields of pathways summarised in Fig. 4, indicates thatC. reinhardtiiremains able to synthesise glycine, alanine, asparagine and lysine but with reduced theoretical effectiveness while not being able to synthesis arginine if one assumes complete downregulation by CHLAMY1 at night-time. However, as there are more than three million possible routes within the network producing the target amino acids and the main portion of all EFMs (above 96% for all amino acids, see also Fig. 8) is affected by CHLAMY1 action, solely focusing on
maximum carbon yields provides a limited view and would lead to misinterpretations. Furthermore, the calculation of the maximal yield is sensitive to the size of the model and the carbon sources chosen. If we use glyceraldehyde-3-phosphate (GAP) and acetate as carbon source and thus, remove glycolysis and the pentose phosphate pathway from the model, the maximum yield does not change between sets of EFMs with and without CHLAMY1 affected reactions (see Fig. 10).
To study the spectrum of metabolic capabilities, we analysed the whole yield distribution. The results, shown in Fig. 5, reveal that CHLAMY1 influences the mRNA expression of enzymes mainly taking part in EFMs that realise low yields. Thus, translational downregulation by CHLAMY1 during the night leads to an increased median yield for the considered amino acid production whereas the maximum yield decreases.
During night-time, photosynthesis is impossible and, hence, energy is largely limited. A prohibition of energy-consuming reactions that usually contribute to low carbon yields during the night has already been observed experimentally for Arabidopsis thaliana[30]. The decrease in maximum carbon yield observed in our analysis is mainly due to the fact that G6PI is regulated by CHLAMY1 and thus, G6P is forced to enter the pentose phosphate pathway (PPP). This might be necessary as the PPP is required for the synthesis of nucleotides. As DNA-replication occurs preferentially during the night, this regulatory compromise can be considered as an optimised outcome of evolution.
Taken together, our results are in good agreement with experimental observations and evolutionary considerations. In contrast to the dependency of the decrease of the maximum yields on the model size and carbon source chosen, the increase of the yield distribution can be found for both G6P and GAP as carbon source (see Fig. 5 and Fig. 10, respectively).
Beside ASL and NiR, CHLAMY1 regulated enzymes are identified based on UG-repeats found in the annotated 39UTR of Figure 7. Carbon yield distribution considering partial downregulation.Weighted mean value of carbon yield distribution for the same pathways as in Fig. 5 based on all available carbon and nitrogen sources, considering downregulation of CHLAMY1 affected enzymes to 10%. Either all enzymes are active at normal rate or CHLAMY1 is assumed to downregulate mRNAs withUG§7-repeat–motif to 10% activity (UG0:1) leading subsequently to reduced yield contribution of the affected EFMs.
doi:10.1371/journal.pone.0023026.g007
the respective genes. For ASL and NiR CHLAMY1 binding has been shown experimentally and the introduction of the respective 39 UTR sequences into luciferase constructs lead to a robust circadian enzyme activity [25]. Furthermore, NiR activity has been shown to cycle in circadian manner [26]. To analyse how the prediction of CHLAMY1 regulated enzymes based on sequence analysis might influence our results we calculated the yield distribution with only ASL and NiR downregulated by CHLAMY1 for comparison. As Fig. 11 shows, NiR and ASL are the enzymes mainly contributing to an increased yield. As G6PI is still active in this case the maximum yield is equal to that of the complete model. This again demonstrates that the calculation of the maximum yield alone is relatively sensitive to changes in the model and may lead to misinterpretations.
The analysis presented here was restricted to the influence of CHLAMY1 regulation on metabolism. There might be other processes influencing the circadian regulation of nitrogen metab-olism like transcriptional and posttranslational regulation. It has been described that the transcription of some enzymes included in our model are regulated in a circadian manner [31]. However, all enzymes described in the aforementioned approach have isoen-zymes that are not under the control of the circadian clock. As we did not distinguish between different isoforms as long as they use
the same cofactors, an inclusion of transcriptional regulation would not affect our simulations. Furthermore, we did not include any compartmentalisation in our model, as due to the resulting complexity the calculation of all EFMs would not be feasible.
Here, we have assumed that all fluxes contribute with equal probability to an overall flux, as done earlier in the case of incomplete knowledge [11]. This assumption probably does not describe reality properly. However, it allows one to analyse the robustness and full flexibility against altered environmental conditions. Moreover, it enables us to predict qualitative changes of the metabolic system under investigation. Furthermore, it has been noticed that approaches based on optimality principles are dependent on the applied constraints [13,32–34] and matching them to experimental results meets with various difficulties [35,36]. As we have shown in this study, weighting EFMs affected by regulating factors differently from unaffected EFMs, preserves the EFM inherent yield, while changing the overall yield distribution (Fig. 7). Additionally, computing a weighted arithme-tic mean of all carbon yields provides valuable information about effects of the regulating factors, while circumventing artificial all-or-none simulations. The simplicity of this approach provides the advantage that no parameters, like reaction rates, are required and no additional assumption have to be made.
Further analysis of the calculated EFMs shows that only approximately 1/50th of the original set of EFMs is still fully active after CHLAMY1 binding. Therefore, the metabolic flux through the system is considerably reduced during the night-time, which is in line with the reduction of carbon and energy consumption when photosynthesis is inactive. This holds independently of the carbon source chosen. Particularly EFMs with a low yield are suppressed, so that the average yield increases. If CHLAMY1 binding is reduced at the end of the night resulting in the expression of target enzymes at the beginning of the day when photosynthetic energy is again available, the metabolic capability and robustness of nitrogen metabolism is greatly increased and allows fast incorpo-ration of nitrogen into the organism. As energy is no longer limiting, there is no need to restrict to those reactions with high yields and low energy consumption. Therefore, CHLAMY1 binding during the night appears to ensure energy conservation while still allowing nitrogen fixation. Due to the stabilisation of mRNA by CHLAMY1 and release at the end of the night [23,25,26], it furthermore enables a high metabolic capacity as soon as enough energy is available.
Fig. 7 reveals that downregulation rather than inactivation of CHLAMY1 affected reactions, still leads to an increase in global carbon yields, although the increase is remarkably lower. This is due to the large portion of CHLAMY1 influenced fluxes.
In general, using weighted influences instead of the simplified all-or-none approach, can be used to study the impact of two regulators leading to different residual activity of enzymes. Furthermore, it could also be used to interpret microarray or other expression data. Here, fold changes could be used as weighting factors to simulate metabolic changes of a given system. Hence, it provides a useful tool to connect the growing amount of high throughput expression data to pathway analysis.
Analysis
Calculating amino acid composition
The amino acid compositions of selected organisms were derived from complete genome open reading frame (ORF) prediction data in fasta file format. The fasta files from Homo sapiens, Mus musculus, and Arabidopsis thaliana were obtained from the UniProt database [37], while the fasta file forChlamydomonas Figure 8. Number of EFMs with and without circadian
regulation.More than 96% of all elementary flux modes (gray) are influenced by CHLAMY1. Remaining elementary flux modes, assuming complete downregulation by CHLAMY1, are shown in black.
Figure 9. Mean yields assuming partial downregulation of genes by CHLAMY1.All EFMs have been used to calculate a weighted mean according to Eq. 3. An increase of the weighted mean yield can again be observed for all amino acids as in Fig. 6. However, the increase is less pronounced.
doi:10.1371/journal.pone.0023026.g009
Figure 10. Yield distribution for GAP and acetate as carbon source. Carbon yield distribution was calculated assuming complete inactivation. In contrast to Fig. 5 GAP and acetate were used as carbon source and the maximum yields (upper whiskers) do not change between EFM sets including all enzyme or those that are not affected by CHLAMY1 downregulation (UG{
). Box plots (with whiskers ranging from minimum to maximum and thick solid line indicating the median) of carbon yield distribution for glycine (Gly), alanine (Ala), asparagine (Asn) and lysine (Lys) associated pathways based on all available carbon sources.
doi:10.1371/journal.pone.0023026.g010
reinhardtii was fetched from a database provided by the Joint Genome Institute [38]. These files were scanned for total amino acid distribution and the results summarised in Fig. 1.
Pathway reconstruction
A metabolic network comprising the nitrogen metabolism inC. reinhardtii (Fig. 2) was reconstructed using the KEGG [39] and ChlamyCyc [40] databases, the biochemical pathways textbook [41] as well as bibliomic data. All reactions were manually curated, which included mass balancing if required and verification of reaction reversibility based on existing biochemical knowledge. If the irreversibility was not conclusive, we set the corresponding reaction reversible.
The carbohydrate metabolism under study includes glycolysis, gluconeogenesis, the pentose phosphate pathway, acetate uptake, the citrate cycle and the glyoxylate shunt. The nitrogen uptake model was reconstructed using data from [42–45]. Moreover, the biosynthetic pathways of glycine, alanine, asparagine, lysine and arginine, which provide the target metabolites of the model, are taken into account by comparing charts [41] with the above-mentioned databases and biological literature. The accessible
carbon sources are acetate, simulating heterotrophic growth, and glucose-6-phosphate (G6P), resulting from starch breakdown during the night. Moreover, molecular nitrogen is provided by nitrate, nitrite or ammonium uptake. Consequently, those substances as well as G6P, acetate and the five above-mentioned amino acids are modelled as external metabolites, that is, their concentrations are considered to be buffered. In contrast, we modelled all energy and redox carriers, such as ATP, NAD(P)H and ferredoxin, as internal. The network in SMBL A SBML version of the network is provided in the Supplements.
Sequence analysis
The mRNA sequences that are associated to the enzymes included in the model were analysed for perfect UG§7-repeats (UG UG UG) in annotated 39UTR [22] of models from the Joint Genome Institute database version 4.0 ofC. reinhardtii[38].
Special emphasis had to be put on isoenzymes, as in several cases mRNAs encoding enzymes containedUG§7-repeats, while others associated to enzymes catalysing the same reaction did not. As we did not regard localisation of enzymes and did not distinguish between isoenzymes as long as they use the same cofactors, the corresponding reactions were simulated not to be under control of the circadian clock via CHLAMY1 for the EFM analysis.
Computation of elementary flux modes
EFMs were computed with efmtool [46] inside the MATLAB environment, version 2008b (The MathWorks, Natick, MA, USA). Details of elementary flux mode calculation are described elsewhere [46,47].
Calculation of yields
In order to compare the effectiveness of different modelled amino acid pathways, we computed carbon yields according to:
carbon yield~ #C(aa)
#C(G6Pzacetate), ð1Þ
where#C(aa) and#C(G6Pzacetate)refer to the numbers of carbon atoms in the considered target amino acid (aa) and in the substratesG6Pandacetate, respectively. The number of carbon atoms were obtained from the overall chemical equation of each elementary mode. The mean yields yy of all yields yi were calculated according to standard formula for mean calculation:
y y~1
n Xn
i~1
yi, ð2Þ
Weighted yields
To calculate the effect of CHLAMY1 downregulation rather than full inactivation of the influenced enzymes, yields from EFMs were weighted differently in the resulting yield distribution. We arbitrarily assumed downregulation to 10% as experimental measures for the degree of downregulation are not available. For the calculation of the yield distribution and visualisation in boxplot graphics the yields unaffected by CHLAMY1 were counted ten times, whereas yields affected by that regulator were only taken into account once.
Additionally, we calculated weighted mean yields for a simplified visualisation of the downregulating effect of CHLAMY1. To do so we computed the weighted arithmetic Figure 11. Combined carbon yield distribution for complete
downregulation by CHLAMY1.For the depicted boxplots the yield distribution for all amino acids including arginine have been combined into one yield distribution. Box plots (with whiskers ranging from minimum to maximum and thick solid line indicating the median) of carbon yield distribution are based on all available carbon and nitrogen sources. Complete inactivation of CHLAMY1 affected enzymes is considered here.
mean yieldyywaccording to the following equation:
y yw~
P
iwiyi
P
i
wi
, ð3Þ
withwi being the weight of the derived carbon yield yi. These weighting factors can be defined in various ways. Here, we use the definition given above based on the fractional extent of downregulation.
Supporting Information
Table S1 Overview of modelled metabolites and corresponding
abbreviations. (PDF)
Table S2 Overview of modelled enzymes and corresponding EC–numbers, abbreviations as well as JGI database IDs (cre v4.0;
http://genome.jgi-psf.org/Chlre4/). The code of the UG§7 -repeats is as follows: i – intron, e – exon, 59/39 UTR – the 59 or 39untranslated region of an enzyme. For bold marked UG§7 -repeat entries CHLAMY1 binding has been shown experimen-tally.
(PDF)
Acknowledgments
We thank Christoph Kaleta, Jo¨rn Behre and Luı´s F. Figueiredo for fruitful discussions and helpful remarks.
Author Contributions
Analyzed the data: IH SScha¨uble. Wrote the paper: IH SScha¨uble SSchuster MM OV. Calculations and figure preparation: SScha¨uble. Model reconstruction: SScha¨uble IH. Directed the project: SSchuster IH. Contributed biological expertise: OV MM.
References
1. Feist AM, Herrga˚rd MJ, Thiele I, Reed JL, Palsson BØ (2009) Reconstruction of biochemical networks in microorganisms. Nat Rev Microbiol 7: 129–143. 2. Ruppin E, Papin JA, de Figueiredo LF, Schuster S (2010) Metabolic
reconstruction, constraintbased analysis and game theory to probe genome-scale metabolic networks. Curr Opin Biotechnol 21: 502–510.
3. Schuster S, Hilgetag C (1994) On elementary ux modes in biochemical reaction systems at steady state. J Biol Syst 2: 165–182.
4. Trinh CT, Wlaschin A, Srienc F (2009) Elementary mode analysis: a useful metabolic pathway analysis tool for characterizing cellular metabolism. Appl Microbiol Biotechnol 81: 813–826.
5. Schwender J, Goffman F, Ohlrogge JB, Shachar-Hill Y (2004) Rubisco without the Calvin cycle improves the carbon efficiency of developing green seeds. Nature 432: 779–782.
6. Kro¨mer JO, Wittmann C, Schro¨der H, Heinzle E (2006) Metabolic pathway
analysis for rational design of L-methionine production byEscherichia coliand
Corynebacterium glutamicum. Metab Eng 8: 353–369.
7. Diniz SC, Voss I, Steinbu¨chel A (2006) Optimization of cyanophycin production
in recombinant strains ofPseudomonas putida andRalstonia eutrophaemploying
elementary mode analysis and statistical experimental design. Biotechnol Bioeng 93: 698–717.
8. Carlson R, Fell D, Srienc F (2002) Metabolic pathway analysis of a recombinant yeast for rational strain development. Biotechnol Bioeng 79: 121–134.
9. Trinh CT, Srienc F (2009) Metabolic engineering ofEscherichia colifor efficient
conversion of glycerol to ethanol. Appl Environ Microbiol 75: 6696–6705. 10. Schuster S, Kenanov D (2005) Adenine and adenosine salvage pathways in
erythrocytes and the role of S-adenosylhomocysteine hydrolase. A theoretical study using elementary ux modes. FEBS J 272: 5278–5290.
11. Kenanov D, Kaleta C, Petzold A, Hoischen C, Diekmann S, et al. (2010) Theoretical study of lipid biosynthesis in wild-type Escherichia coli and in a protoplast-type L-form using elementary ux mode analysis. FEBS J 277: 1023–1034.
12. Behre J, Wilhelm T, von Kamp A, Ruppin E, Schuster S (2008) Structural robustness of metabolic networks with respect to multiple knockouts. J Theor Biol 252: 433–441.
13. Varma A, Palsson BØ (1994) Stoichiometric ux balance models quantitatively predict growth and metabolic by-product secretion in wild-type Escherichia coli W3110. Appl Environ Microbiol 60: 3724–3731.
14. Acua V, Marchetti-Spaccamela A, Sagot MF, Stougie L (2010) A note on the complexity of finding and enumerating elementary modes. Biosystems 99: 210–214.
15. Kaleta C, de Figueiredo LF, Schuster S (2009) Can the whole be less than the sum of its parts? Pathway analysis in genome-scale metabolic networks using elementary ux patterns. Genome Res 19: 1872–1883.
16. Stelling J, Klamt S, Bettenbrock K, Schuster S, Gilles ED (2002) Metabolic network structure determines key aspects of functionality and regulation. Nature 420: 190–193.
17. Covert MW, Knight EM, Reed JL, Herrgard MJ, Palsson BØ (2004) Integrating high-throughput and computational data elucidates bacterial networks. Nature 429: 92–96.
18. Schwarz R, Liang C, Kaleta C, Ku¨hnel M, Ho_mann E, et al. (2007) Integrated network reconstruction, visualization and analysis using YANAsquare. BMC Bioinformatics 8: 313.
19. Schwartz JM, Gaugain C, Nacher JC, de Daruvar A, Kanehisa M (2007) Observing metabolic functions at the genome scale. Genome Biol 8: R123. 20. Shlomi T, Cabili MN, Herrga˚rd MJ, Palsson BØ, Ruppin E (2008)
Network-based prediction of human tissue-specific metabolism. Nat Biotechnol 26: 1003–1010.
21. Daniel-Vedele F, Filleur S, Caboche M (1998) Nitrate transport: a key step in nitrate assimilation. Curr Opin Plant Biol 1: 235–239.
22. Zhao B, Schneid C, Iliev D, Schmidt EM, Wagner V, et al. (2004) The circadian RNA-binding protein CHLAMY 1 represents a novel type heteromer of RNA recognition motif and lysine homology domain-containing subunits. Eukaryot Cell 3: 815–825.
23. Mittag M (1996) Conserved circadian elements in phylogenetically diverse algae. Proc Natl Acad Sci U S A 93: 14401–14404.
24. Waltenberger H, Schneid C, Grosch JO, Bareiss A, Mittag M (2001) Identification of target mRNAs for the clock-controlled RNA-binding protein
Chlamy 1 fromChlamydomonas reinhardtii. Mol Genet Genomics 265: 180–188.
25. Kiaulehn S, Voytsekh O, Fuhrmann M, Mittag M (2007) The Presence of
UG-repeat sequences in the 39-UTRs of reporter luciferase mRNAs mediates
circadian expression and can determine acrophase inChlamydomonas reinhardtii.
J Biol Rhythms 22: 275–277.
26. Iliev D, Voytsekh O, Schmidt EM, Fiedler M, Nykytenko A, et al. (2006) A heteromeric RNAbinding protein is involved in maintaining acrophase and period of the circadian clock. Plant Physiol 142: 797–806.
27. Wlaschin AP, Trinh CT, Carlson R, Srienc F (2006) The fractional
contributions of elementary modes to the metabolism ofEscherichia coliand
their estimation from reaction entropies. Metab Eng 8: 338–352.
28. Ha¨dicke O, Klamt S (2010) CASOP: a computational approach for strain optimization aiming at high productivity. J Biotechnol 147: 88–101. 29. Covert MW, Schilling CH, Palsson BØ (2001) Regulation of gene expression in
ux balance models of metabolism. J Theor Biol 213: 73–88.
30. Piques M, Schulze WX, Ho¨hne M, Usadel B, Gibon Y, et al. (2009) Ribosome and transcript copy numbers, polysome occupancy and enzyme dynamics in Arabidopsis. Mol Syst Biol 5: 314.
31. Kucho KI, Okamoto K, Tabata S, Fukuzawa H, Ishiura M (2005) Identi_cation of novel clockcontrolled genes by cDNA macroarray analysis in Chlamydomo-nas reinhardtii. Plant Mol Biol 57: 889–906.
32. Edwards JS, Ibarra RU, Palsson BØ (2001) In silico predictions of Escherichia coli metabolic capabilities are consistent with experimental data. Nat Biotechnol 19: 125–130.
33. Ibarra RU, Edwards JS, Palsson BØ (2002)Escherichia coli K-12 undergoes
adaptive evolution to achieve in silico predicted optimal growth. Nature 420: 186–189.
34. Famili I, Forster J, Nielsen J, Palsson BØ (2003) Saccharomyces cerevisiae phenotypes can be predicted by using constraint-based analysis of a genome-scale reconstructed metabolic network. Proc Natl Acad Sci U S A 100: 13134–13139.
35. Schuster S, Pfeiffer T, Fell DA (2008) Is maximization of molar yield in metabolic networks favoured by evolution? J Theor Biol 252: 497–504. 36. Feist AM, Palsson BØ (2010) The biomass objective function. Curr Opin
Microbiol.
37. UniProt Consortium (2010) The Universal Protein Resource (UniProt) in 2010. Nucleic Acids Res 38: D142–D148.
38. Merchant SS, Prochnik SE, Vallon O, Harris EH, Karpowicz SJ, et al. (2007) The Chlamydomonasgenome reveals the evolution of key animal and plant functions. Science 318: 245–250.
39. Kanehisa M, Araki M, Goto S, Hattori M, Hirakawa M, et al. (2008) KEGG for linking genomes to life and the environment. Nucleic Acids Res 36: D480–D484. 40. May P, Christian JO, Kempa S, Walther D (2009) ChlamyCyc: an integrative
systems biology database and web-portal forChlamydomonas reinhardtii. BMC
Genomics 10: 209.
41. Michal G, ed. (1999) Biochemical Pathways: An Atlas of Biochemistry and Molecular Biology John Wiley & Sons, 1st edition 1999 edition.
42. Quesada A, Galva´n A, Schnell RA, Lefebvre PA, Ferna´ndez E (1993) Five
nitrate assimilationrelated loci are clustered inChlamydomonas reinhardtii. Mol Gen
Genet 240: 387–394.
43. Gonza´lez-Ballester D, Camargo A, Ferna´ndez E (2004) Ammonium transporter genes in Chlamy-domonas: the nitrate-specific regulatory gene Nit2 is involved
inAmt1;1 expression. Plant Mol Biol 56: 863–878.
44. Gonza´lez-Ballester D, de Montaigu A, Higuera JJ, Galva´n A, Ferna´ndez E (2005) Functional genomics of the regulation of the nitrate assimilation pathway inChlamydomonas. Plant Physiol 137: 522–533.
45. Ferna´ndez E, Galva´n A (2007) Inorganic nitrogen assimilation inChlamydomonas.
J Exp Bot 58: 2279–2287.
46. Terzer M, Stelling J (2008) Large-scale computation of elementary ux modes with bit pattern trees. Bioinformatics 24: 2229–2235.