Clinical Implications of Having Reduced Mid
Forced Expiratory Flow Rates (FEF
25-75
),
Independently of FEV1, in Adult Patients with
Asthma
Craig M. Riley1☯, Sally E. Wenzel2‡
, Mario Castro3, Serpil C. Erzurum4‡, Kian Fan Chung5, Anne M. Fitzpatrick6, Benjamin Gaston7, Elliot Israel8, Wendy C. Moore9, Eugene
R. Bleecker9, William J. Calhoun10, Nizar N. Jarjour11, William W. Busse12, Stephen P. Peters9, W. Gerald Teague13, Ronald Sorkness14, Fernando Holguin2☯
*
1Department of Medicine, Division of Internal Medicine, University of Pittsburgh Medical Center, Pittsburgh, Pennsylvania, United States of America,2Department of Medicine, Division of Pulmonary, Allergy and Critical Care Medicine, University of Pittsburgh School of Medicine, Pittsburgh, Pennsylvania, United States of America,3Department of Medicine, Division of Pulmonary and Critical Care Medicine, Washington University School of Medicine in St. Louis, St. Louis, Missouri, United States of America,4Department of Pathobiology, Cleveland Clinic Foundation, Cleveland, Ohio, United States of America,5National Heart and Lung Institute, Imperial College London, London, United Kingdom,6Department of Pediatrics, Emory University School of Medicine, Atlanta, George, United States of America,7Department of Pediatrics, Division of Pediatric Pulmonary Medicine, University Hospitals, Cleveland, Ohio, United States of America,8Department of Medicine, Division of Pulmonary and Critical Care Medicine, Brigham and Women’s Hospital, Boston, Massachusetts, United States of America,9Department of Medicine, Division of Pulmonary, Critical Care, Allergy and Immunologic Medicine, Wake Forest University School of Medicine, Winston-Salem, North Carolina, United States of America,10 Department of Medicine, Division of Pulmonary, Critical Care and Sleep Medicine, University of Texas Medical Branch, Galveston, Texas, United States of America,11Department of Medicine, Division of Pulmonary and Critical Care Medicine, University of Wisconsin School of Medicine and Public Health, Madison, Wisconsin, United States of America,12Department of Medicine, Division of Allergy and Immunology, University of Wisconsin School of Medicine and Public Health, Madison, Wisconsin, United States of America,13Department of Pediatrics, Division of Respiratory Medicine, University of Virginia Children’s Hospital, Charlottesville, Virginia, United States of America,14School of Pharmacy, University of Wisconsin at Madison, Madison, Wisconsin, United States of America
☯These authors contributed equally to this work.
‡These authors also contributed equally to this work. *[email protected]
Abstract
Introduction
FEF25-75is one of the standard results provided in spirometry reports; however, in adult asthmatics there is limited information on how this physiological measure relates to clinical
or biological outcomes independently of the FEV1or the FEV1/FVC ratio.
Purpose
To determine the association between Hankinson’s percent-predicted FEF25-75(FEF25-75%)
levels with changes in healthcare utilization, respiratory symptom frequency, and biomarkers of distal airway inflammation.
OPEN ACCESS
Citation:Riley CM, Wenzel SE, Castro M, Erzurum SC, Chung KF, Fitzpatrick AM, et al. (2015) Clinical Implications of Having Reduced Mid Forced Expiratory Flow Rates (FEF25-75), Independently of FEV1, in Adult Patients with Asthma. PLoS ONE 10 (12): e0145476. doi:10.1371/journal.pone.0145476
Editor:Heinz Fehrenbach, Research Center Borstel, GERMANY
Received:September 3, 2015
Accepted:November 12, 2015
Published:December 30, 2015
Copyright:© 2015 Riley et al. This is an open access article distributed under the terms of the Creative Commons Attribution License, which permits unrestricted use, distribution, and reproduction in any medium, provided the original author and source are credited.
Data Availability Statement:All relevant data are within the paper and its Supporting Information files.
Funding:Funded by the National Institutes of Health HL069174-06. The funders had no role in study design, data collection and analysis, decision to publish, or preparation of the manuscript.
Methods
In participants enrolled in the Severe Asthma Research Program 1–2, we compared
out-comes across FEF25-75% quartiles. Multivariable analyses were done to avoid confounding
by demographic characteristics, FEV1, and the FEV1/FVC ratio. In a sensitivity analysis, we
also compared outcomes across participants with FEF25-75% below the lower limit of normal
(LLN) and FEV1/FVC above LLN.
Results
Subjects in the lowest FEF25-75% quartile had greater rates of healthcare utilization and
higher exhaled nitric oxide and sputum eosinophils. In multivariable analysis, being in the
lowest FEF25-75% quartile remained significantly associated with nocturnal symptoms (OR
3.0 [95%CI 1.3–6.9]), persistent symptoms (OR 3.3 [95%CI 1–11], ICU admission for
asthma (3.7 [1.3–10.8]) and blood eosinophil % (0.18 [0.07, 0.29]). In the sensitivity
analy-sis, those with FEF25-75%<LLN had significantly more nocturnal and persistent symptoms,
emergency room visits, higher serum eosinophil levels and increased methacholine responsiveness.
Conclusions
After controlling for demographic variables, FEV1and FEV1/FVC, a reduced FEF25-75% is
independently associated with previous ICU admission, persistent symptoms, nocturnal symptoms, blood eosinophilia and bronchial hyperreactivity. This suggests that in some
asthmatics, a reduced FEF25-75% is an independent biomarker for more severe asthma.
Introduction
Both the diagnosis of asthma and the monitoring of disease severity rely on the use of pulmo-nary function testing (PFT) data. Though the forced expiratory volume in one second (FEV1)
and the FEV1to forced vital capacity (FVC) ratio are the most commonly used spirometric
measurements to identify both the presence and degree of airflow obstruction, other values such as the forced expiratory flow between 25% and 75% of the FVC (FEF25-75) are also
com-monly reported [1]. Although variation in the FEF25-75was previously thought to reflect
changes exclusively in the small airways (<2mm) [2–4], subsequent studies using other
physi-ological or radiphysi-ological parameters have shown that changes in FEF possibly reflect distal air-flows that involve airways that have greater diameters. More importantly, there is limited information about its clinical usefulness, including the fact that current guidelines such as those from the Global Initiative for Asthma (GINA) and the Expert Panel Report 3 of the National Heart, Lung and Blood Institute do not provide specific recommendations for the use of FEF25-75in the evaluation or management of asthma [5,6]. In heterogeneous populations,
FEF25-75is seldom discordant from FEV1and FEV1/FVC [7]. However, reduced FEF25-75in
children with asthma has been shown to be associated with increased asthma severity, need for systemic steroid use and more frequent exacerbations in the setting of normal FEV1. It is not
known whether these results are also applicable to adult asthmatics [8].
To answer this question, we sought to determine whether the percent predicted FEF25-75
(FEF25-75%) is associated with clinical asthma outcomes among participants of the Severe
be associated with increased asthma morbidity independent of and beyond the severity implied by more traditional markers like FEV1%. We further hypothesized that FEF25-75% would be
associated with biomarkers linked to more distal airway inflammation.
Methods
The study population consisted of participants ages 18 or older from the multi-center SARP study who met criteria for asthma and also had FEF measurements. Asthma diagnosis was based on having either a 12% increase in FEV1after short acting bronchodilator or a 20% drop
in FEV1after inhalation of methacholine (PC2025 mg/ml). The SARP 1–2 study has been
pre-viously described in detail [9]. Briefly, the study population consisted of subjects recruited at SARP participating academic centers through the use of local advertisement and from their clinics who met eligibility criteria, including being a current nonsmoker with asthma and hav-ing less than 5 pack-years of tobacco use. Study participants were classified as havhav-ing either severe or not severe asthma. According to the American Thoracic Society (ATS) definition, severe asthma was defined as: at least 1 major criteria: a) Use of high-dose inhaled steroids for>50% of the preceding year or b) continuous or near-continuous oral steroids); and at
least 2 minor criteria: a) daily controller medication in addition to inhaled steroids, b) beta ago-nist required daily or near-daily, c) persistent airway obstruction, d) one or more urgent care visits for asthma per year, e) 3 or more oral corticosteroid bursts/year, f) clinical deterioration with reduction in oral steroid dose, and g) near-fatal asthma event in the past. Non-severe asth-matics included those with moderate (pre bronchodilator FEV1<80% with or without use of
inhaled corticosteroids (CS)) or mild (FEV180% with or without use of inhaled CS) asthma.
Clinical Data
After signing informed consent, study participants provided demographic information, smok-ing history, past medical history and frequency of respiratory symptoms in the 3 months pre-ceding enrollment, including cough, sputum production, chest tightness, nighttime asthma symptoms, wheezing, and shortness of breath. Subjects also completed the Juniper Asthma Quality of Life Questionnaire (AQLQ). As this specific project was performed as secondary analysis of the above data following de-identification, no further patient consent or institu-tional review board approval was required.
Allergy Skin Test
All participants underwent allergy skin testing for tree mix, grass mix, ragweed, weed mix, dogs, cats, molds, dust mites, and cockroach. To control for validity, diluting fluid and hista-mine were respectively used as negative and positive controls. Presence of atopy was defined as having at least one skin test reaction of3 mm and greater than the saline control.
Lung Function testing
Spirometry was done following ATS guidelines[10]. Post bronchodilator FEV1was recorded as
the maximum bronchodilator change between 4 and 8 puffs of albuterol. Patients with a base-line FEV1>50% and FEV11.5L underwent methacholine challenge, following a 7-dose
algorithm of incremental doses from 0.078mg/ml to maximum of 25 mg/ml. A provocation concentration (PC20) of<16 mg/ml was considered positive. This high value was chosen
because of the high and prolonged steroid doses in the population. Because of FEV1criteria,
using Hankinson’s regression models for each sex and by race [11]. Exhaled nitric oxide (eNO) was measured online following ATS and ERS standards [12].
Statistical Analysis
The FEF25-75% distribution was divided into quartiles to determine how the variability in this
measure associates with changes in healthcare utilization, frequency of respiratory symptoms and biomarkers of distal airway inflammation. Healthcare utilization included emergency department (ED) visits, hospitalizations and intensive care unit (ICU) admissions for asthma. The frequency of respiratory symptoms was defined as a binary variable for having or not hav-ing symptoms at least twice or more per week. Continuous parametric and non-parametric data were respectively compared across FEF25-75% quartiles using one way ANOVA or Kruskal
Wallis tests with Bonferroni pairwise comparisons. The Chi2 test was used to compare the dis-tribution of categories.
To evaluate for possible confounders, we performed logistic regression analysis that
included the following models: a) univariable, b) adjusted for demographic factors (age, gender, BMI, race), and c) full model adjusted for demographic variables + FEV1% predicted and the
FEV1/FVC ratio. The covariable model selection was based a priori and whether their p value
was<0.1 or the model’s estimate changed by10%. Given the high degree of correlation between FEF and FEV1or the FEV1/FVC ratio, all models were evaluated for collinearity using
the variance inflation factor (VIF). Due to the fact that in severe asthmatics, FVC accounts for most of the FEV1reversal after bronchodilation due to air trapping [13], a separate multivariate
analysis was run with adjustment for FVC rather than FEV1(S3 Table); both could not be
adjusted for in the same model due to collinearity. We also performed a sensitivity analysis to determine the study outcomes of discordant subjects with low FEF25-75% but no airway
obstruction, defined as having FEF25-75<LLN with FEV1/FVC>the lower limit of normal
(LLN). All statistics were done using Stata 13.0 (College Park, Tx).
Results
The characteristics of the study population are shown inTable 1, which consisted of 829 participants, of whom the majority was Caucasian, female and overweight. With decreasing FEF25-75% quartiles, there was a greater proportion of African American race, larger BMI,
lon-ger duration of asthma and a higher proportion of moderate to severe asthmatics. There was also a strong association between FEF25-75% quartiles with increased medication use health
care utilization, eNO, IgE and sputum eosinophil proportions. Similarly, participants in the lower quartile distribution were more likely to have required an oral corticosteroid burst, to be seen in the emergency room or to be hospitalized for asthma. Those in the lowest FEF25-75%
quartile had the highest likelihood of having been previously intubated for asthma. With progressive FEF25-75% decline, there was also a significant reduction in FVC, FEV1and the
FEV1/FVC ratio as shown inTable 2. Adjustment for FVC rather than FEV1did not
signifi-cantly change the results of the multivariate analysis (S3 Table).
Multivariable analyses
Respiratory symptoms. In the univariable analysis (S1 Table), compared to highest refer-ent FEF25-75% quartile (median 92.5 (IQR [80.1, 101.1]) category, the odds of having persistent
respiratory symptoms increased in association with lower FEF25-75% quartiles and remained
symptoms and persistent symptoms remained significantly associated with the lowest FEF25-75% quartile (median 25.6 [IQR 20.4, 32.2]) as shown inTable 3andFig 1A.
Healthcare utilization. In the univariable analysis, compared to the referent category, the odds of ever requiring hospitalizations, ED visits or ICU care increased in relation to lower Table 1. Characteristics of the study population by the FEF25-75% quartile distribution.
Q1 Q2 Q3 Q4 P-value
Overall 88 (74–146) 64 (56–74) 46 (37–55) 27 (9–37)
N = 829 N = 207 N = 207 N = 208 N = 207
Demographics
Age 36.8 (25.5, 46.6) 32.6 (22.2, 38.9) 35.3 (25.6, 42.0) 37.6 (26.7, 47.7) 41.7 (32.2, 49.6) P<0.0001
Sex—Female 65.1% 67.1% 70.5% 64.4% 58.4% P = .07
Sex—Male 34.9% 32.9% 29.5% 35.6% 41.6%
Race—White 64.9% 74.4% 69.6% 61.1% 54.6% P<0.0001
Race—Black 27.4% 15.0% 25.1% 31.7% 37.7%
Race—Other 7.7% 10.6% 5.3% 7.2% 7.7%
BMI 29.9 (23.9, 34.2) 28.0 (22.5, 32.5) 29.6 (23.8, 33.0) 30.8 (24.6, 35.0) 31.3 (25.1, 35.9) P<0.0001 Duration of asthma (yrs) 21.8 (11.8, 30.6) 17.9 (8.5, 23.8) 19.9 (10.6, 27.1) 23.0 (12.8, 32.1) 26.3 (15.6, 35.9) P<0.0001
Ever smoked 20.7% 18.0% 20.3% 21.2% 23.2% P = 0.6
Biomarkers
Exhaled NO (ppb) 38.0 (15.6, 48.1) 31.1 (13.5, 36.6) 37.1 (14.1, 49.7) 40.1 (17.8, 52.2) 43.8 (17.0, 49.3) P<0.01* IgE (IU/mL blood) 324 (54, 334) 197 (42, 226) 316 (52, 355) 401 (64, 362) 384 (56, 385) P<0.05* Eosinophil % (blood) 3.93 (2, 5) 3.40 (1.55, 5) 3.95 (2, 5) 3.66 (2, 5) 4.72 (2. 6) P<0.01**
Sputum eosinophil % 4.89 (0.2, 4.1) 3.22 (0.001, 1.9) 3.08 (0.2, 2.8) 3.66 (0.3, 4.0) 9.59 (0.6, 8.6) P<0.001**
PC20 1.15 (0.42, 3.89) 2.25 (0.89, 6.48) 1.28 (0.53, 3.99) 0.84 (0.27, 2.42) 0.46 (0.19, 1.44) P<0.0001* Outcomes
ER for breathing ever 67.9% 61.8% 58.5% 68.1% 83.1% P<0.001
Spent night in hospital ever 42.4% 33.3% 30.4% 38.8% 67.2% P<0.001
ICU ever 15.9% 6.4% 7.8% 14.7% 34.8% P<0.001
Intubated ever 8.3% 4.8% 5.8% 4.8% 18.0% P<0.001
Footnote: Continuous variables are shown as median (Inter quartile range). Categorical variables shown as percentage of total. Q: quartile, BMI: body mass index, NO: nitric oxide, WBC: white blood cell, PC20: provocation challenge, ER: emergency room, ICU: intensive care unit.
*P value calculated from log transformed data **P value calculated from Kruskal-Wallis test
doi:10.1371/journal.pone.0145476.t001
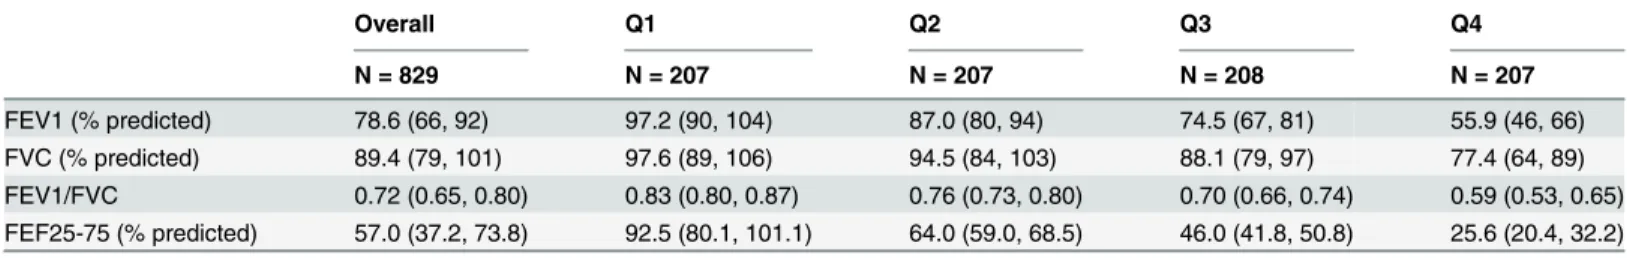
Table 2. Lung function parameters by the FEF25-75% quartile distribution.
Overall Q1 Q2 Q3 Q4
N = 829 N = 207 N = 207 N = 208 N = 207
FEV1 (% predicted) 78.6 (66, 92) 97.2 (90, 104) 87.0 (80, 94) 74.5 (67, 81) 55.9 (46, 66) FVC (% predicted) 89.4 (79, 101) 97.6 (89, 106) 94.5 (84, 103) 88.1 (79, 97) 77.4 (64, 89) FEV1/FVC 0.72 (0.65, 0.80) 0.83 (0.80, 0.87) 0.76 (0.73, 0.80) 0.70 (0.66, 0.74) 0.59 (0.53, 0.65) FEF25-75 (% predicted) 57.0 (37.2, 73.8) 92.5 (80.1, 101.1) 64.0 (59.0, 68.5) 46.0 (41.8, 50.8) 25.6 (20.4, 32.2)
Footnote: Values shown as median (Inter quartile range). Q: quartile, FEV1: forced expiratory volume in one second, FVC: forced vital capacity, FEF25-75: forced expiratoryflow between 25% and 75% of FVC.
FEF25-75% quartiles (S1 Table). After adjusting for demographics, these associations were
attenuated but remained significant. After adjusting for FEV1% and the FEV1/FVC ratio, only
those in the lowest FEF25-75% quartile had a significantly increased odds ratio (OR) of ever
hav-ing an ICU admission for asthma (Table 3,Fig 1B).
Biomarkers of allergic, airway inflammation and bronchial hyperactivity. In the uni-variable analysis, lower FEF25-75% quartiles were significantly associated with log-transformed
eNO, IgE, PC20, blood and sputum eosinophils (S1 Table). After adjustment for demographics, these remained significant with the exception of blood eosinophilia. In the fully adjusted model, the 3rdFEF25-75% quartile was associated with IgE, eNO, PC20, and marginally with
sputum eosinophils. In the lowest quartile, only blood eosinophils and PC20 remained signifi-cant (Table 3andFig 1C), though a trend towards increasing IgE, eNO and sputum eosino-philia remained.
Sensitivity analysis on patients with discordant FEF25-75and FEV1/FVC. Compared to asthmatics with an FEF25-75>LLN and FEV1/FVC>LLN, those with a reduced FEF25-75
<LLN but FEV1/FVC>LLN, had significantly increased nocturnal symptoms and persistent
symptoms. They were also more likely to visit the emergency room, to have serum eosinophilia and bronchial hyperreactivity (S2 Table).
Discussion
In this cross sectional study of SARP participants, reduced FEF25-75% was associated with
increased frequency of respiratory symptoms, greater healthcare utilization and higher levels of biomarkers of distal airway inflammation. Although many of these associations were attenu-ated by adjusting for FEV1% and the FEV1/FVC ratio, having a reduced FEF25-75% was
inde-pendently related to more frequent nocturnal and persistent symptoms, ICU admission for asthma, higher eNO, greater bronchial hyperresponsiveness and higher sputum eosinophil per-centage. Further, among patients with an FEV1/FVC ratio above the lower limit of normal,
having an FEF25-75below the LLN was associated with increased symptom burden, healthcare
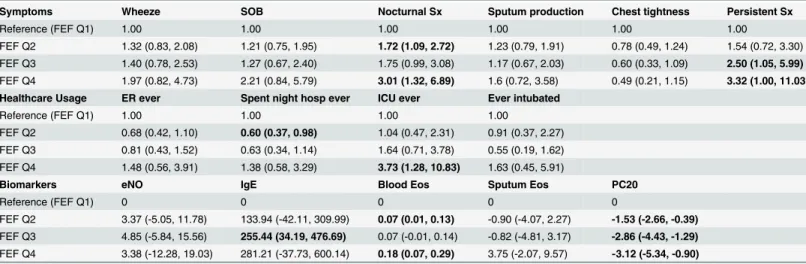
utilization, serum eosinophilia and bronchial hyperreactivity. Together, these results show for Table 3. Multivariable analysis of respiratory symptoms, healthcare utilization and biomarkers by FEF25-75% quartile distribution.
Symptoms Wheeze SOB Nocturnal Sx Sputum production Chest tightness Persistent Sx
Reference (FEF Q1) 1.00 1.00 1.00 1.00 1.00 1.00
FEF Q2 1.32 (0.83, 2.08) 1.21 (0.75, 1.95) 1.72 (1.09, 2.72) 1.23 (0.79, 1.91) 0.78 (0.49, 1.24) 1.54 (0.72, 3.30)
FEF Q3 1.40 (0.78, 2.53) 1.27 (0.67, 2.40) 1.75 (0.99, 3.08) 1.17 (0.67, 2.03) 0.60 (0.33, 1.09) 2.50 (1.05, 5.99)
FEF Q4 1.97 (0.82, 4.73) 2.21 (0.84, 5.79) 3.01 (1.32, 6.89) 1.6 (0.72, 3.58) 0.49 (0.21, 1.15) 3.32 (1.00, 11.03)
Healthcare Usage ER ever Spent night hosp ever ICU ever Ever intubated
Reference (FEF Q1) 1.00 1.00 1.00 1.00
FEF Q2 0.68 (0.42, 1.10) 0.60 (0.37, 0.98) 1.04 (0.47, 2.31) 0.91 (0.37, 2.27)
FEF Q3 0.81 (0.43, 1.52) 0.63 (0.34, 1.14) 1.64 (0.71, 3.78) 0.55 (0.19, 1.62)
FEF Q4 1.48 (0.56, 3.91) 1.38 (0.58, 3.29) 3.73 (1.28, 10.83) 1.63 (0.45, 5.91)
Biomarkers eNO IgE Blood Eos Sputum Eos PC20
Reference (FEF Q1) 0 0 0 0 0
FEF Q2 3.37 (-5.05, 11.78) 133.94 (-42.11, 309.99) 0.07 (0.01, 0.13) -0.90 (-4.07, 2.27) -1.53 (-2.66, -0.39)
FEF Q3 4.85 (-5.84, 15.56) 255.44 (34.19, 476.69) 0.07 (-0.01, 0.14) -0.82 (-4.81, 3.17) -2.86 (-4.43, -1.29)
FEF Q4 3.38 (-12.28, 19.03) 281.21 (-37.73, 600.14) 0.18 (0.07, 0.29) 3.75 (-2.07, 9.57) -3.12 (-5.34, -0.90)
Footnote: Multivariable logistic (odds ratio) and linear regression (beta coefficient) models were adjusted for age, sex, body mass index, duration of asthma, history of smoking, FEV1 and FEV1/FVC. Q: quartile, SOB: shortness of breath, Sx: symptoms, ER: emergency room, ICU: intensive care unit, eNO: exhaled nitric oxide, Eos: eosinophils, PC20: provocation challenge, FEF quartiles: Q1: 88 (74–146), Q2: 64 (56–74), Q3: 46 (37–55), Q4: 27 (9–37)
the first time in adults with asthma, that having a low FEF25-75% identifies a group of patients
with higher morbidity and elevated biomarkers of distal airway inflammation.
According to the European Respiratory Society (ERS) and the American Thoracic Society (ATS) task force for standardization of lung function testing, the FEF25-75is defined as the
mean forced expiratory flow between the 25% and 75% of the FVC [14,15], which some have interpreted as a quantitative measure of small airways (<2mm) obstruction [4]. Indeed, since
the 1970s FEF25-75% rates were proposed to be a marker of small airway obstruction and a
more sensitive way to detect early stages of obstructive airway disease. However, others have argued that FEF25-75% is highly variable and neither sufficiently sensitive nor specific to
diag-nose obstructive lung disease [16]. Moreover, FEF25-75% has not been shown to correlate with
other physiologic or histologic measures of distal lung inflammation [16]. Using computed tomography airway morphometric analysis, FEF25-75% has been shown to be moderately and
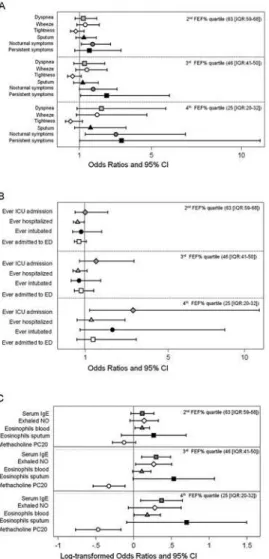
inversely correlated with the bronchial wall area (WA) and WA corrected for body surface Fig 1. Adjusted odds ratios and beta coefficients of respiratory symptom frequency (a), healthcare utilization (b), biomarkers and bronchial hyperresponsiveness (c).Footnote: Multivariable logistic and regression models adjusted for: for age, sex, body mass index, duration of asthma, history of smoking, FEV1 and FEV1/FVC. Error bars represent 95% confidence intervals.
area, though not exclusively in the small airways [17]. Although it is possible that FEF25-75%
predominantly reflects flows derived from more distal airways, there is insufficient data to sup-port the concept that variability in this measure is specific to small airway changes. Despite these limitations, FEF25-75% continues to be part of the standard spirometry report. More
importantly, there are no recommendations as to how reductions in this measure should be taken into consideration for asthma treatment or for risk stratification.
Unlike Quanjer et al[7] who have argued that FEF25-75% does not aid clinical decision
mak-ing, our results support a different conclusion. Although we also found the percentage of dis-cordant cases (low FEF25-75% with a normal FEV1/FVC) is relatively small, FEF was
independently associated with several clinical, inflammatory and healthcare outcomes. Further, the study by Quanjer et al was unable to examine these associations, as their study did not include any non-physiological clinical outcomes.
In children, a low FEF25-75% has been associated with greater odds for systemic steroids and
ED visits, despite having a normal FEV1[18]. Similarly, our study found that even when
con-trolling for FEV1and the FEV1/FVC ratio, asthmatics with lower FEF25-75% have greater odds
of having been admitted to the ICU and to have persistent respiratory symptoms. In addition, we have shown that lower FEF25-75% is independently associated with eNO. As shown by
Dweik et al[19], eNO is associated with increased asthma morbidity when levels are above 35 ppb. When taken into consideration with increased persistent and nocturnal symptoms, we speculate that FEF25-75% is indeed related to more distal airway inflammation either not fully
captured or not yet evident by FEV1; however, further work must be done to evaluate this
hypothesis. If proven in prospective investigation, the clinical implications would include both prognosis and identification of an at-risk asthma population for more intensive therapy.
There are significant limitations that need to be considered when evaluating the results from this study. First, given the cross-sectional nature of this study, no causal implications can be made between FEF25-75% and asthma severity. This question will need to be answered in the
ongoing longitudinal SARP 3 study. Also, reliance on questionnaire responses may contribute to recall bias, though this should be a non-differential bias with regards to the FEF25-75%
distri-butions. Additionally, our results may lack external validity, as the SARP study population is enriched with a higher proportion of participants with severe asthma and is not representative of the general adult asthma population. Though this limits the generalization of these findings, it should be noted that SARP still represents a broader spectrum of asthma than most studies, which may help with distinguishing effects.
Conclusions
Independent of FEV1and FEV1/FVC, FEF25-75% predicted identifies a population of adult
asthmatics with more severe symptoms, greater health care utilization and elevated biomarkers of distal airway inflammation. Further research is needed to determine if this information can be used clinically to guide treatment decisions or for prognostic evaluation; these questions are currently undergoing longitudinal analysis within SARP 3.
Supporting Information
S1 Table. Symptoms, Health Care Utilization and Biomarkers across FEF Quartiles unad-justed and adunad-justed for demographics.Footnote: Multivariable logistic (odds ratio) and linear regression (beta coefficient) models were adjusted for age, sex, body mass index, duration of asthma, history of smoking, FEV1 and FEV1/FVC. Bolded values represent p-values<0.05.
Multivariate analysis odds ratios and 95% confidence intervals.Linear regression beta
emergency room, ICU: intensive care unit, eNO: exhaled nitric oxide, Eos: eosinophils, WBCs: white blood cells, PC20: provocation challenge, FEF quartiles: Q1: 88 (74–146), Q2: 64 (56–74), Q3: 46 (37–55), Q4: 27 (9–37).
(DOC)
S2 Table. Sensitivity Analysis Comparing Decreased FEF25-75% with Normal FEV1/FVC against Normal Spirometry.Footnote: Reference: FEV1/FVC>LLN and FEF25-75>LLN.
Low/Normal: FEF25-75<LLN and FEV1/FVC>LLN. Bolded values are statistically significant
to p<0.05. Values shown represent multivariate analysis odds ratios () or linear regression beta
coefficients (). SOB: shortness of breath, Sx: symptoms, ratio: FEV
1/FVC, FEF: FEF25-75%,
BMI: body mass index, ER: emergency room, Hosp: hospital, eNO: exhaled nitric oxide, Eos: eosinophils, WBCs: white blood cells, PC20: methacholine provocation challenge.
(DOC)
S3 Table. Multivariable analysis of respiratory symptoms, healthcare utilization and bio-markers by FEF25-75% quartile distribution with FVC instead of FEV1.Footnote: Multivari-able logistic (odds ratio) and linear regression (beta coefficient) models were adjusted for age, sex, body mass index, duration of asthma, history of smoking, FVC and FEV1/FVC. Q: quar-tile, SOB: shortness of breath, Sx: symptoms, ER: emergency room, ICU: intensive care unit, eNO: exhaled nitric oxide, Eos: eosinophils, PC20: provocation challenge, FEF quartiles: Q1: 88 (74–146), Q2: 64 (56–74), Q3: 46 (37–55), Q4: 27 (9–37).
(DOC)
S4 Table. Demographic and lung function characteristics of non-obstructed patients with normal vs low FEF25-75.Footnote: Continuous variables are shown as median (Inter quartile range). Categorical variables shown as percentage of total. BMI: body mass index, FEV1: forced expiratory volume in one second, FVC: forced vital capacity, FEF25-75: forced expiratory flow between 25% and 75% of FVC. P-values shown calculated by chi-squared for categorical vari-ables and t-test for continuous varivari-ables.
(DOC)
Author Contributions
Conceived and designed the experiments: CMR FH SCE SEW. Performed the experiments: CMR FH. Analyzed the data: CMR FH. Wrote the paper: CMR FH SCE SEW. Contributed with participant recruitment: ERB WWB WJC MC AMF BG EI NNJ WCM SPP WGT KFC SCE SEW RS.
References
1. Program NAEaP (2007) Expert Panel Report 3. National Heart, Lung and Blood Institute Produced Publications: National Institute of Health.
2. Terra Filho M, Vargas FS, Cukier A, Fiss E, Romeiro Neto M, Croce J, et al. (1986) [Forced mid-expira-tory flow rate (FEF 25–75%): a critical analysis of its value in recognizing diseases of the small airways]. Allergol Immunopathol (Madr) 14: 199–203.
3. Perez T, Chanez P, Dusser D, Devillier P (2013) Small airway impairment in moderate to severe asth-matics without significant proximal airway obstruction. Respir Med 107: 1667–1674. doi:10.1016/j. rmed.2013.08.009PMID:24025779
4. McFadden ER Jr, Linden DA (1972) A reduction in maximum mid-expiratory flow rate. A spirographic manifestation of small airway disease. Am J Med 52: 725–737. PMID:5030170
6. Jones SE, Merkle SL, Fulton JE, Wheeler LS, Mannino DM (2006) Relationship between asthma, over-weight, and physical activity among U.S. high school students. J Community Health 31: 469–478. PMID:17186641
7. Quanjer PH, Weiner DJ, Pretto JJ, Brazzale DJ, Boros PW (2014) Measurement of FEF25-75% and FEF75% does not contribute to clinical decision making. Eur Respir J 43: 1051–1058. doi:10.1183/ 09031936.00128113PMID:24072211
8. Rao DR, Gaffin JM, Baxi SN, Sheehan WJ, Hoffman EB, Phipatanakul W (2012) The utility of forced expiratory flow between 25% and 75% of vital capacity in predicting childhood asthma morbidity and severity. J Asthma 49: 586–592. doi:10.3109/02770903.2012.690481PMID:22742446
9. Jarjour NN, Erzurum SC, Bleecker ER, Calhoun WJ, Castro M, Comhair SA, et al. (2012) Severe asthma: lessons learned from the National Heart, Lung, and Blood Institute Severe Asthma Research Program. Am J Respir Crit Care Med 185: 356–362. doi:10.1164/rccm.201107-1317PPPMID: 22095547
10. (1987) Standardization of spirometry—1987 update. Statement of the American Thoracic Society. Am Rev Respir Dis 136: 1285–1298. PMID:3674589
11. Hankinson JL, Odencrantz JR, Fedan KB (1999) Spirometric reference values from a sample of the general U.S. population. Am J Respir Crit Care Med 159: 179–187. PMID:9872837
12. American Thoracic S, European Respiratory S (2005) ATS/ERS recommendations for standardized procedures for the online and offline measurement of exhaled lower respiratory nitric oxide and nasal nitric oxide, 2005. Am J Respir Crit Care Med 171: 912–930. PMID:15817806
13. Sorkness RL, Bleecker ER, Busse WW, Calhoun WJ, Castro M, Chung KF, et al. (2008) Lung function in adults with stable but severe asthma: air trapping and incomplete reversal of obstruction with bronch-odilation. J Appl Physiol (1985) 104: 394–403. PMID:17991792
14. Hankinson JL, Gardner RM (1988) Standardization of spirometry. Am Rev Respir Dis 137: 493–495. 15. Gardner RM, Hankinson JL (1988) Standardization of spirometry—1987 ATS update (American
Tho-racic Society). J Occup Med 30: 272–273.
16. Sutherland ER, Martin RJ, Bowler RP, Zhang Y, Rex MD, Kraft M, et al. (2004) Physiologic correlates of distal lung inflammation in asthma. J Allergy Clin Immunol 113: 1046–1050. PMID:15208583 17. Niimi A, Matsumoto H, Amitani R, Nakano Y, Mishima M, Minakuchi M, et al. (2000) Airway wall
thick-ness in asthma assessed by computed tomography. Relation to clinical indices. Am J Respir Crit Care Med 162: 1518–1523. PMID:11029371
18. Rao DR, Gaffin JM, Baxi SN, Sheehan WJ, Hoffman EB, Phinpatanakul W, et al. (2012) The utility of forced expiratory flow between 25% and 75% of vital capacity in predicting childhood asthma morbidity and severity. J Asthma 49: 586–592. doi:10.3109/02770903.2012.690481PMID:22742446 19. Dweik RA, Sorkness RL, Wenzel S, Hammel J, Curran-Everett D, Comhair SA, et al. (2010) Use of