Phylogenies in Simulations Despite Selection of the
Correct Model
Patrick Ku¨ck*, Christoph Mayer, Johann-Wolfgang Wa¨gele, Bernhard Misof
Zoologisches Forschungsmuseum Alexander Koenig (ZFMK), Bonn, Germany
Abstract
The aim of our study was to test the robustness and efficiency of maximum likelihood with respect to different long branch effects on multiple-taxon trees. We simulated data of different alignment lengths under two different 11-taxon trees and a broad range of different branch length conditions. The data were analyzed with the true model parameters as well as with estimated and incorrect assumptions about among-site rate variation. If length differences between connected branches strongly increase, tree inference with the correct likelihood model assumptions can fail. We found that incorporating invariant sites together withCdistributed site rates in the tree reconstruction (C+I) increases the robustness of maximum likelihood in comparison with models using onlyC. The results show that for some topologies and branch lengths the reconstruction success of maximum likelihood under the correct model is still low for alignments with a length of 100,000 base positions. Altogether, the high confidence that is put in maximum likelihood trees is not always justified under certain tree shapes even if alignment lengths reach 100,000 base positions.
Citation:Ku¨ck P, Mayer C, Wa¨gele J-W, Misof B (2012) Long Branch Effects Distort Maximum Likelihood Phylogenies in Simulations Despite Selection of the Correct Model. PLoS ONE 7(5): e36593. doi:10.1371/journal.pone.0036593
Editor:John W. Stiller, East Carolina University, United States of America
ReceivedFebruary 22, 2012;AcceptedApril 10, 2012;PublishedMay 9, 2012
Copyright:ß2012 Ku¨ck et al. This is an open-access article distributed under the terms of the Creative Commons Attribution License, which permits unrestricted use, distribution, and reproduction in any medium, provided the original author and source are credited.
Funding:The work was supported by Deutsche Forschungsgemeinschaft (MI649/6-2 to BM and SPP 1174 (WA530/33) to WA). The funders had no role in study design, data collection and analysis, decision to publish, or preparation of the manuscript.
Competing Interests:The authors have declared that no competing interests exist. * E-mail: [email protected]
Introduction
Maximum likelihood (ML) tree inference has been shown to be statistically consistent for binary trees with finite branch lengths under correct model and model parameter assumptions as sequence length increases to infinity [1–5]. Thus, ML tree inference will converge on the true tree as more and more data are accumulated [5,6]. Additionally, ML is said to be robust against model violations [2,6–11] and thus, even oversimplified likelihood models are said to find the correct tree in most instances if branch lengths are well balanced [12].
The ML method is certainly more robust and more efficient than other methods [2,6–9,13–21]. This has led to a widespread application and acceptance of ML tree inference. Since its introduction into phylogenetics, the degree of ML robustness and efficiency has been assessed using 4-taxon tree simulations. Setups in which ML methods can potentially fail or become inefficient on trees with more than four taxa have not been intensively studied in e.g. Fukami & Tatento [22], Kuhner [23], Huelsenbeck [24], and Pol & Siddal [25]). Since phenomena like taxon-slippage in larger trees due to signal erosion (class II long branch effects sensu Wa¨gele & Mayer [26]) cannot be seen in four-taxon trees, we address the robustness and efficiency of ML methods to different long branch effects in an 11-taxon setup. We show that ML methods indeed reconstruct correct topologies in a wide parameter range, but we also discovered instances in which ML methods reconstruct the wrong tree for relatively long alignments even under correct model assumptions. These effects,
which have not been studied previously, are potentially common in empirical data.
It is well known that if among-site rate variation (ASRV) is ignored in tree reconstruction, the ML approach underestimates substitution rates, and these estimates become progressively worse with increasing evolutionary distances [27]. Ignoring ASRV makes ML tree inference susceptible to long branch attraction [4,6,7,11,13,15,16,19,28–30]. Therefore, ASRV is, apart from other important advances like the consideration of multiple substitutions or basing phylogenetic inference on a sound statistical footing, another powerful improvement brought to model-based ML reconstruction methods. Three possibilities to account for rate variation are the ‘‘invariant sites model (I)’’, the ‘‘C distributed rates model’’ (a shape parameter) and a combination of both models (C+I). The invariant sites parameter assumes an estimated fraction of sites to be invariable while remaining sites are assumed to evolve at an equal rate. Under theC-model, substitution rate heterogeneity among sites is modelled using a C distribution. A bell-shaped C distribution caused by an avalue greater than 1 implies a more or less constant substitution rate among sites whereas a reverse-J shapedCdistribution caused byavalues lower than 1 means a stronger rate variation [15]. The lower theavalue, the higher the rate heterogeneity among sites.
restricted C-model (e.g. [34–38]). One argument is that param-eters of the C- and invariant sites model cannot be optimized independently. This can lead to problems during model parameter optimization due to multiple optima in the likelihood function [39,40]. The shape parameter of the C distribution and the invariant sites estimation are indeed strongly correlated and subject to large sample variance [31,32,41]. The correlation makes it difficult to distinguish between truly invariable and slowly evolving sites, especially in the case of alignments with a small number of sequences. However, if many taxa are included (N.20), it is said that the mixed-distribution model can be reliably estimated [32,41]. Erroneous estimates of one parameter can be compensated by the other. Erroneous estimates of both together can fit the data such that the likelihood score changes only marginally [32]. The recent tendency in the literature to prefer the application of the ASRV C alone mirrors the uncertainty in the modelling of ASRV. We have addressed the important question whetherC+I models are superior over pureC models and whether the parameters could be estimated correctly for a taxon set of just 11 taxa. Furthermore, we investigated how deviations from the simulatedC parameter affects the reconstruc-tion success.
No model can be assumed to be entirely correct for real data [19]. Long branch artefacts (LBA) are therefore not only theoretical concepts, but also real phenomena [24,26,42]. The ‘‘classical long branch case’’ (Figure 1a) which is caused by the misleading effect of parallel substitutions on long branches [2] is well studied and affects mainly the maximum parsimony method. In a topology of more than four taxa, (i) the case when two internal long branches are separated by a short internal branch in a rooted tree with more than four taxa (Figure 1a), may lead to misplacement of the two terminal taxa adjacent to the short inner branch. We call this phenomenon the class I effect (following Wa¨gele & Mayer [26]). This effect is mainly produced by plesiomorphies. Note that these can only be identified in rooted tree topologies and that they are true homologies, in contrast to the chance similarities typical for the Felsenstein Zone. (ii) The case when a single long branch slips down the tree towards the outgroup or appears elsewhere, mainly due to signal erosion (Figure 1b), has been coined the class II effect. (iii) Finally, the case described in detail by Felsenstein [2], namely the attraction of long terminal branches due to the dominance of chance similarities over homologies, is named the class III effect. Note that it is relevant to find out if long terminal branches are also attracted due to class III effects when they are separated by more than one internal branch. This can only be tested in multiple taxon tree topologies (Figure 1c).
Results
Reconstruction Success of Topology A
Topology A (Figure 2a) was designed to test for class II (signal erosion) and class III effects (attraction due to chance similarities). If the true proportions of invariant sites (rinv~0:3) and ASRV (a~1
:0) are given or estimated for datasets of Topology A (Figure 2a) by using a mixed-distribution model of ASRV (JC+C+I) or if estimated by a C distribution model alone (JC+C), ML is able to infer predominantly correct trees under most of the internal branch lengths (BL1w0
:01) even if terminal branch lengths are extremely long (BL2ƒ1
:5) (Figure 3a and Figure S1). Class II effects, where one single long branch slips down the tree towards the outgroup or appears elsewhere, predominate only in the majority of simulations if short internal branch lengthsBL1are very low (BL1~0
:01). This implies weak
signal supporting internal nodes. Under these conditions class II effects are found even under moderate lengths of long terminal branches (BL2§0
:7) (Figure 3a and Figure 4a). Long branch attraction of both terminal branches (class III effects) were only rarely seen if terminal branches are distinctly long (BL2§1
:1) and alignment lengths short (2000 bp), but appear more often if JC is used for tree inference with a C distribution model alone (Figure 4a). As expected, ML performs worse if rate heterogeneity is not considered at all (Figure 3a and S1). In this case, especially long branch effects due to attraction of long terminal branches (class III) are present in the majority of simulations except when internal branch lengths get very large (BL1w0
:3, implying better support for inner nodes). The range in which class III effects predominate in tree reconstructions without consideration of rate heterogeneity decreases continuously with increased branch lengths of the short internal branchesBL1(Figure 3a and Figure S1).
BL1is very small (BL1~0
:01), ML correctly resolves nearly all trees under these conditions when sequence lengths are extended to 100,000 bp under equal ML parameter settings (Figure 5a). In general, the performance of ML inference in our simulations is mostly afflicted by large branch length differences, less so by wrong model assumptions.
Reconstruction Success of Topology B
Topology B was designed to test for class I effects (symplesio-morphy effect). The major difference to topology A is that the evolving sequence passes through two long branches, while in topology A the two long branches are parallel. Even if the correct proportion of invariant sites (rinv~0:3) and ASRV (a~1:0) are assumed, ML is not able to infer correct trees of topology B (Figure 2b) in the majority of simulations if the length of the short internal branch (BL1) is small (BL1~0
:01) and the lengths of the two long internal branches (BL2) are large (BL2§1
:3) (Figure 3b and Figure 4b). When the mixed-distribution model (JC+C+I) is used, class I effects (symplesiomorphy effects) start to predominate in the majority of tree reconstructions of topology B if the lengths of the long internal branches (BL2) is large (BL2~1
:1) except for the alignment length of 10,000 bp. IfBL2§1
:3, class I effects are also found for alignment lengths of 10,000 bp (Figure 3b and Figure 4b). The frequency of class I effects is even higher if data stets are analysed with JC and the C distribution model alone (Figure 3b and Figure 4b). If the short internal branch length (BL1) is small (BL1~0
:01), class I effects already predominate with JC+C in the majority of repeat steps if both long internal
branches (BL2) §0
:7. In contrast to JC+C+I, predomination of class I effects is additionally found if lengths of the short internal branch (BL1) are larger than 0.01 (Figure 3b and Figure S1). If ML is used without consideration of ASRV, tree reconstruction success for topology B is worse than described for topology A (Figure 3 and Figure S1). In contrast to topology A, the high frequency of wrong trees does not disappear in topology B under correct model assumptions when sequence alignment lengths rise to 100,000 bp (Figure 5b). This is in agreement with the fact that the symplesiomorphy 6effect is a systematic error, not only caused by random variations but inforced by shared homologies. It can be overcome with a better taxon sampling [26].
Maximum Likelihood Values
Likelihood values of single trees become higher if among-site rate variation is considered. All trees affected by long branch artifacts show likelihood scores that are nearly identical to those of correctly resolved topologies of corresponding sequence lengths and parameter assumptions. Likelihood values of all reconstructed trees corresponding to the results of Figure 3 are shown in Figure S2. It is important for work with empirical data that distinct differences in likelihood scores between wrong and correct topologies could not be observed in many cases even if the ML parameters used for inference were nearly identical to their true values.
Parameter Estimates ofC and I
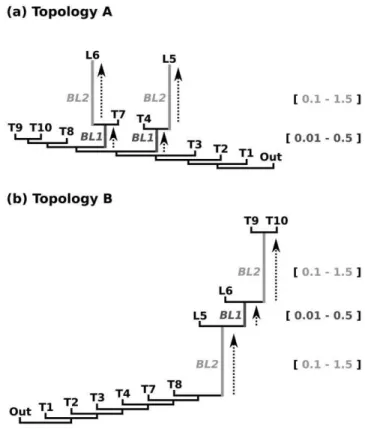
IfCwas estimated alone (JC+C),awas estimated on average to 0.4 under small branch length differences of BL1and BL2. If length differences betweenBL1andBL2got larger, the estimated Figure 2. Two sets of simulations. Given model topology for a)
Topology A: stepwise elongation of two terminal branches (BL2) under different ancestral branch lengths (BL1) and b) Topology B: stepwise
elongation of two internal branches (BL2) under different lengths of an intermediate branch (BL1). Topology A was used to identify class II and
III effects (following tree shape of Figure 1b and Figure 1c), Topology B was used to identify class I effects (following tree shape of Figure 1a). doi:10.1371/journal.pone.0036593.g002
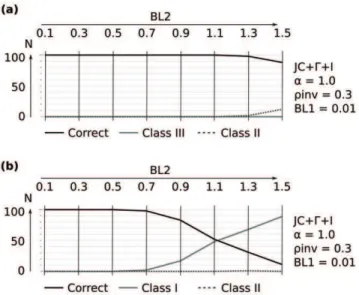
Figure 3. Selected results of ML reconstuctions fora~1:0under the mixed-distribution model (JC+C+I) and theC distributed model (Jukes-Cantor+C). Class III (‘‘Felsenstein effect’’), Class I (attraction due to symplesiomorphies), and Class II (random error probably due to signal erosion) inferred from 100 simulation repeats for each branch length combination and alignment length. Each individual plot corresponds to a fixed branch increase ofBL1~0:01(Figure 2) and
fixed reconstruction scheme with the models JC+C(a~0:1) or JC+C+I
(a~0:1;rinv~0:3). Branch length differences increase from left to right
by increasing branchBL2in discrete elongation steps (0.1–1.5). Four successive data points (belonging to one cell in the plot) correspond to four alignment lengths (2,000, 3,000, 4,000, 10,000 base pairs). Alignment corresponding branch lengths ofBL2 are shown above each subfigure. The y-axis depicts the reconstruction success of the 100 simulation repeats (N) for a) Topology A (Figure 2a) and b) Topology B (Figure 2b).
a value decreased continiously with increasing branch length differences untilawas estimated on average to 3.5 (Figure S3). If C+I were estimated together,awas estimated on average slightly higher as simulated for larger branch length differences (a~1:1). The proportion of invariant sites was on average consistently estimated to 0.3 independent of corresponding branch length conditions. The tree reconstruction success of both (estimated and correct values of JC+C+I) settings was found to be nearly identical (Figure S1). All parameter estimates are presented as Figure S3.
Discussion
For alignment lengths in the range of 2,000–10,000, the reconstruction success was investigated for i) correct as well as estimated model parameters (rinvanda) with a mixed-distribution
model (JC+C+I), ii) a C distribution model in which a was estimated alone (JC+C), and iii) without considering rate heterogeneity (JC).
As expected, our results show that incorporating rate hetero-geneity leads to an increased reconstruction success of ML (provided that the data includes rate heterogeneity). This has also been observed in previous studies, e.g. [9,12,24,32,33], and is not surprising.
The inclusion of a mixed-distribution model (JC+C+I) improves tree estimation over analyses using aC distribution model alone. Especially in case of topology B, JC+C+I recovered the correct topologies under a wider range of branch lengths as JC+C(Figure 3b and Figure 4b). This supports the results of Sullivan et al. [32] as well as Anderson & Swofford [9] who showed that ML recovers topologies best if a C+I model is used and contradicts the assumptions that exclusive application of the restrictedC-model is sufficient, e.g. [34–38]. Whether the higher tree reconstruction success of the mixed-distribution model associated with topology B will also be true with empirical data has to be tested in further studies. For a combination of very shortBL1and longBL2, ML performs poorly, even if a mixed-distribution model is used in the tree reconstruction (Figure 3 and Figure 4). The lower reconstruction success for the very short length ofBL1(BL1~0
:01) cannot be due to random choice of a most-likely topology when there is no phylogenetic signal (star topology). In such cases ML is expected to ‘‘choose’’ at random from the set of all plausible topologies [6,8]. This would be the expected behavior of ML when information of ancestral states is completely lacking. However, this is neither the case for topology A (Figure 4a) nor for topology B (Figure 4b). Despite large length differences between ancestral (BL1~0
:01) and terminal branches (BL2§1
:1) for Topology A, ML was still able to infer correct topologies more often than can be attributed to chance. Similarly, the incorrect trees that place taxon L5 and L6 in a sister group relationship due to the class I effect (Figure 1a) appear more often for Topology B than expected by chance. The explanation for this effect is the systematic bias.
Figure 4. Occurence of long branch artefacts (LBA).Ranges of branch length differences between BL1 and BL2 (see Figure 2) in which LBA dominated tree reconstruction with investigated model assumptions in the majority of repeat steps, summarized over all alignment lengths. Dominated ranges of long branch artefacts are shown by bar charts. Single bars correspond to fixed ranges of lengths forBL1andBL2in which lengths ofBL2increase from 0.1–1.5 within
each box (x-axis; lower scale). Length ofBL1increases with each box from 0.01–0.5 (x-axis; upper scale). a) Domination of class II and class III effects are found in topology A (Figure 2a). b) Domination of the class I effect is found in topology B (Figure 2b). Corresponding branch lengths ofBL2are also shown above each bar plot. Note, that ML delivered identic tree reconstruction success for estimated and correct model assumptions of JC+C+I.
doi:10.1371/journal.pone.0036593.g004
Figure 5. Reconstruction success of ML (100,000 base posi-tions).a) Topology A (Figure 2a) and b) Topology B (Figure 2b) under alignment lengths of 100,000 base positions if model assumptions are identical to the simulated parameters (a~1:0;rinv~0:3). Branch length
differences increase from left to right by increasingBL2in discrete steps (0.1–1.5) whileBL1is kept constant (0.01). The y-axis depicts the
ML is not able to recover the true tree for Topology B with large length differences between short (BL1) and long branches (BL2), even if the correct model is specified (Figure 5b). This class of topologies has not been investigated before and constitutes a new example for which ML efficiency is low even for long alignments (100,000 bp). With increased sequence length, the class I effect (symplesiomorphy effect) becomes even stronger beyond a certain point of branch length differences of short internal branches (BL1) and long internal branches (BL2) (Figure 4b). However, the proofs of ML consistency mean that there is always some k large enough that having k or more sites will allow the true tree to be inferred with high probability assuming correct model parameters. For the case of 4 taxa, the ‘‘inverse Felsenstein zone’’ is a well known example of reduced ML efficiency where alignment lengths of 100,000 bp are required for an 85% chance to recover the correct topology [6]. It can be expected that our topology and setup yields, what we call, an ‘‘inefficient valley of death’’, which is similar to the effect found for the ‘‘inverse Felsenstein zone’’ by Swofford et al. [6] where the performance of likelihood declines initially and then improves as sequence length increases. Figure 5b suggests that alignment lengths may need to be in the millions or even higher, meaning the LBA class I problem couldn’t be resolved yet, even in principle for many bacterial genomes. Since we can soon regularly expect data sets of the size of complete genomes, it would be interesting to investigate the extent of this valley, i.e. the necessary alignment length for which ML will reliably find the correct tree. For the topology A which can produce the Felsenstein effect (Figure 2a), ML recovers the true tree efficiently even with large branch length differences of short ancestral branches BL1 (BL1~0
:01) and long terminal branches BL2 (BL2§0
:7) if model assumptions are correct and alignment lengths long (Figure 5a). Our results for this topology are consistent with those found by Swofford et al. [6].
One possible explanation why Topology A and B yield different reconstruction efficiencies could be that the reconstruction of Topology B is in fact more difficult than the reconstruction of Topology A. Because both internal taxa L5 and L6 are separated by a short branch and separated from all other taxa by long branches they will share characters unique for their last common ancestor more often than expected by chance. This will likewise be true for other taxa connected via short branches. Therefore topology B is naturally much harder to reconstruct and given long branch length differences will yield a biased reconstruction error which we see in fact in our simulations.
It is also interesting to note that estimates ofaand the invariant sites proportion are very accurately estimated for theC+I models used in the reconstruction. This high accuracy is found for all branch lengths and topologies even in those cases for which the reconstruction success is low (Figure S3). This excludes model misspecification as the source of phylogenetic inaccuracy in analyses in which the tree was inferred using the same parameters as were used to generate the dataset. In those cases, (e.g. Figure 5b) ML consistency implies that the phylogenetic inaccuracy is caused by sampling error. Another possibility is that the heuristic ML searches got stuck in local optima, but this seems rather unlikely for just 11 taxa and JC+C+I. Sullivan et al. [32] argued that the number of taxa is important for the correct estimate of the shape parameter and the number of invariable sites, mainly due to stochastic errors in small samples. The observation that 11 taxa already allow us to find good estimates of the parameters in question could be explained by longer alignments in this study. Further, Sullivan et al. [43] demonstrated on 4-taxon trees that estimates of the C distribution can be strongly influenced by
topologies which involve long internal branches. This correlation was not found in our analyses.
As shown in our analyses, the appearance of long branch artefacts, especially of class I effects (symplesiomorphy effect), is not a particular problem of mixed-distribution models. If no invariant sites are estimated in the reconstruction, this model deficiency is partially compensated by a lower estimated value of theashape parameter (a~0:4{3:5), which results in an increased estimate of sites with low and very low substitution rates. Since this compensation is only partial and leads to an overestimation of substitution rates for a certain number of sites, the reconstruction success is lower compared with the application of aC+I model.
Our results show that the risk of obtaining a wrong topology using ML is dependent on the arrangement of the edges (corresponding to which LBA classes the tree is susceptible to). Although our results depend on simulated nucleotid data it can be expected that amino acid sequences are also prone to long branch effects if branch lengths combinations of BL1 and BL2 differ strongly from each other, even though the possibility of obtaining long branch effects increase with a decreasing alphabet of character states. It is also clear that good ‘‘support values’’ are no guarantee for the correctness of the tree topology. Also, we have to keep in mind that empirical data can evolve in a much more heterogeneous way than in our simulations. Although we show that ML is not immune to different long branch artefacts, we hope that our work will not be taken as evidence for the continued use of Maximum Parsimony for molecular data. Maximum Parsimony has been shown to be seriously affected by long branch attraction [2,6,8,15–17,19], therefore we consider Maximum Parsimony as entirely inappropriate for molecular data.
Materials and Methods
Simulations
We designed two sets of data simulations under different topologies (Figure 2) to detect effects related to long terminal branches (Topology A) and of long internal branches (Topology B). The first set used topology A, which was characterized by a stepwise elongation of two terminal non-neighboring branches (BL2). Internal branch lengths (BL1) were kept short, but also varied in length (Figure 2a). This setup can potentially produce cases of class II and class III. The second set used topology B, which was characterized by a stepwise elongation of two internal branches (BL2) for different lengths of an intermediate internal branch (BL1) (Figure 2b). This tree topology was used to produce mainly class I effects rather than class II effects. Trees consisted of 11 taxa in which lengths of all remaining branches (RB) are kept
constant (LRB~0:1). Branch lengths reflect the amount of
expected substitution rates per site for corresponding lineages. For each length ofBL1(0.01, 0.05, 0.1, 0.3, 0.5), we increased the length ofBL2from 0.1 to 1.5 in steps of 0.2. Thus, branch length ratiosBL2/BL1ranged from one-fifth to 150. All alignments were generated with INDELible v.1.01 [44] using the Jukes-Cantor model (JC) of sequence evolution and a mixed-distribution model of C+I for ASRV. All data were simulated with ASRV, shape parametera~1
(each base in the sequence has an equal probability of changing which results in equal frequency of the four bases), the reconstruction success of ML is directly linked to the simulated branch length conditions, sequence lengths, and the ASRV conditions used in each ML analysis.
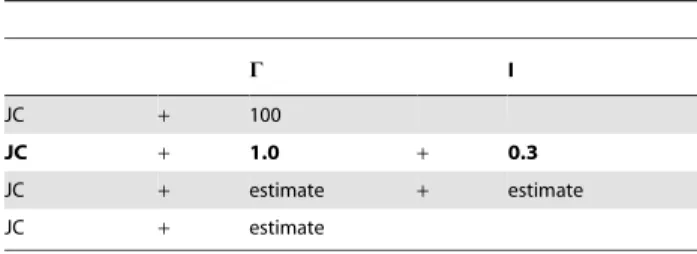
Maximum Likelihood Analyses
Trees were inferred with the Jukes-Cantor (JC) model under different parameter settings using PhyML-3.0-linux64 [45,46] (Table 1). We analyzed the data either (i) with a mixed-distribution model (JC+C+I) or (ii) with C distributed rates, but without estimating the fraction of invariant sites (JC+C). Using the mixed-distribution model (JC+C+I), theC shape parameter a and the fraction of invariant sites were either estimated or set equal to the simulated values (a~1:0andrinv~0:3). Using theC distribution model (JC+C), the shape parameter of theC distribution (a) was always estimated from the data. As approximation to non-ASRV (JC), a was set to 100 (a~100). For the alignment length of 100,000 bp, tree reconstruction was only performed under the correct model parameters (a~1:0 and rinv~0:3). With the discrete gamma model, the number of relative substitution rate categories was set to four (c = 4) and tree topologies and branch lengths were optimized (heuristic search). Maximum likelihood analyses were performed and evaluated with a Perl pipeline, and
ran for three months on a Linux Cluster with HP ProLiant DL380 G5 blades (Dual quad core Intel Xeon E5345, 2.33 GHz, 26
4 MB L2-cache, 1333 MHz Bus, 32 GB RAM).
Scoring
Wrong topologies were classified into LBA class I, II and III effects (Figure 2). Wrong topologies for which we found a paraphyletic grouping of the two terminal ‘‘non-long branches’’ in topology B were summarized as class I effects. Wrong topologies which showed an attraction of the two long terminal branches in topology A are sampled as class III effects. Wrong topologies for which only one long branch had been misplaced in Topology A and B (probably due to signal erosion) were collectively classified as class II effects. Topologies that did not fit any of these categories like incorrect placements of ‘‘background’’ taxa have not been found in our analyses.
Supporting Information
Figure S1 ML reconstruction success of simulated paramter and branch length settings.
(TIFF)
Figure S2 ML values of reconstructed topologies. (TIFF)
Figure S3 ML parameter estimates of reconstructed topologies. (TIFF)
Acknowledgments
We thank Olivier Gascuel, Karl Kjer, Birthe Thormann, and three anonymous reviewers for helpful comments and proofreading. We also thank Ste´phane Guindon for help with the PhyML software, and all members of the molecular and bioinformatic unit ZFMK (Bonn) for inspiring discussions.
Author Contributions
Conceived and designed the experiments: PK BM. Performed the experiments: PK. Analyzed the data: PK. Wrote the paper: PK BM JWW CM.
References
1. Felsenstein J (1973) Maximum likelihood and minimum-steps methods for estimating evolutionary trees from data on discrete characters. Syst Zool 22: 240–249.
2. Felsenstein J (1978) Cases in which parsimony or compatibility methods will be positively misleading. Syst Biol 27: 401–410.
3. Felsenstein J (1981) Evolutionary trees from DNA sequences: a maximum likelihood approach. J Mol Evol 17: 368–376.
4. Chang JT (1996) Full reconstruction of Markov models on evolutionary trees: identifiability and consistency. Math Biosci 137: 51–73.
5. Rogers JS (1997) On the consistency of maximum likelihood estimation of phylogenetic trees from nucleotide sequences. Syst Biol 46: 354–357. 6. Swofford DL, Waddell PJ, Huelsenbeck JP, Foster PG, Lewis PO, et al. (2001)
Bias in phylogenetic estimation and its relevance to the choice between parsimony and likelihood methods. Syst Biol 50: 525–539.
7. Gaut S, Lewis PO (1995) Success of maximum likelihood phylogeny inference in the four-taxon case. Mol Biol Evol 12: 152–162.
8. Bruno WJ, Halpern AL (1998) Topological bias and inconsistency in maximum likelihood using wrong models. Mol Biol Evol 16: 564–566.
9. Anderson FE, Swofford DL (2004) Should we be worried about long-branch attraction in real data sets? Investigations using metazoan 18S rDNA. Mol Phylogenet Evol 33: 440–451.
10. Kolaczkowski B, Thornton JW (2004) Performance of maximum parsimony and likelihood phylogenetics when evolution is heterogeneous. Nature 431: 980–984. 11. Kelchner SA, Thomas MA (2006) Model use in phylogenetics: nine key
questions. Trends Ecol Evol 22: 87–94.
12. Yang Z, Goldman N, Friday A (1994) Comparison of models for nucleotide substitution used in Maximum-Likelihood phylogenetic estimation. Mol Biol Evol 11: 316–324.
13. Huelsenbeck JP, Hillis DM (1993) Success of phylogenetic methods in the four-taxon case. Syst Zool 42: 247–264.
14. Yang Z (1993) Maximum likelihood estimation of phylogeny from DNA sequences when substitution rates differ over time. Mol Biol Evol 10: 1396–1401.
15. Yang Z, Goldman N, Friday AE (1995) Maximum likelihood trees from DNA sequences: a peculiar statistical estimation problem. Syst Biol 44: 384–399. 16. Sullivan J, Swofford DL (1997) Are guinea pigs rodents? The importance of
adequate models in molecular phylogenetics. J Mammal Evol 4: 77–86. 17. Yang Z (1997) How often do wrong models produce better phylogenies? Mol
Biol Evol 14: 105–108.
18. Siddal ME (1998) Success of parsimony in the four-taxon case: Long branch repulsion by likelihood in the Farris zone. Cladistics 14: 209–220.
19. Sullivan J, Swofford DL (2001) Should we use model-based methods for phylogenetic inference when we know that assumptions about among-site rate variation and nucleotide substitution pattern are violated? Syst Biol 50: 723–729. 20. Gaucher EA, Miyamoto MM (2005) A call for likelihood phylogenetics even when the process of sequence evolution is heterogeneous. Mol Phylogenet Evol 37: 928–931.
21. Fischer M, Steel M (2009) Sequence length bounds for resolving a deep phylogenetic divergence. J Theor Biol 256: 247–252.
22. Fukami-Kobayashi K, Tateno Y (1991) Robustness of maximum likelihood tree estimation against different patterns of base substitutions. J Mol Evol 32: 79–91. 23. Kuhner MK, Felsenstein J (1994) A simulation comparison of phylogeny algorithms under equal and unequal evolutionary rates. Mol Biol Evol 11: 459–468.
24. Huelsenbeck JP (1997) Is the Felsenstein zone a y trap? Syst Biol 46: 69–74.
Table 1.The used model parameter settings of ASRV for
maximum likelihood analyses.
C I
JC + 100
JC + 1.0 + 0.3
JC + estimate + estimate
JC + estimate
25. Pol D, Siddal ME (2001) Biases in maximum likelihood and parsimony: a simulation approach to a 10-taxon case. Cladistics 17: 266–281.
26. Wa¨gele JW, Mayer C (2007) Visualizing differences in phylogenetic information content of alignments and distinction of three classes of long-branch effects. BMC Evol Biol 7: 147.
27. Felsenstein J (1984) Distance methods for inferring phylogenies: a justification. Evolution 38: 16–24.
28. Huelsenbeck JP (1995) Performance of phylogenetic methods in simulation. Syst Biol 44: 17–48.
29. Lockhart PJ, Larkum AW, Steel MA, Waddell PJ, Penny D (1996) Evolution of chlorophyll and bacteriochlorophyll: The problem of invariant sites in sequence analysis. Proc Natl Acad Sci U S A 93: 1930–1934.
30. Yang Z (1996) Among-site rate variation and its impact on phylogenetic analyses. Tree 11: 367–372.
31. Gu X, Fu YX, Li WH (1995) Maximum likelihood estimation of the heterogeneity of substitution rate among nucleotide sites. Mol Biol Evol 12: 546–557.
32. Sullivan J, Swofford DL, Naylor GJP (1999) The effect of taxon sampling on estimating rate heterogeneity parameters of maximum-likelihood models. Mol Biol Evol 16: 1347–1356.
33. Phillipe H, Germot A (2000) Phylogeny of eukaryotes based on ribosomal RNA: Long-Branch Attraction and models of sequence evolution. Mol Biol Evol 17: 830–834.
34. Sanderson MJ, Wojciechowski MF, Hu JM, Sher-Khan T, Brady SG (2000) Error, bias, and longbranch attraction in data for two chloroplast photosystem genes in seed plants. Mol Biol Evol 17: 782–797.
35. Savard J, Tautz D, Richards S, Weinstock GM, Gibbs RA, et al. (2006) Phylogenomic analysis reveals bees and wasps (Hymenoptera) at the base of the radiation of Holometabolous insects. Genome Res 16: 1334–1338.
36. Murienne J, Edgecombe G, Giribet G (2010) Including secondary structure, fossils and molecular dating in the centipede tree of life. Mol Phylogenet Evol 57: 301–313.
37. Regier JC, Shultz JW, Zwick A, Hussey A, Ball B, et al. (2010) Arthropod relationships revealed by phylogenomic analysis of nuclear protein-coding sequences. Nature 319: 473–476.
38. Rota-Stabelli O, Campbell L, Brinkmann H, Edgecombe GD, Longhorn SJ, et al. (2010) A congruent solution to arthropod phylogeny: phylogenomics, microRNAs and morphology support monophyletic Mandibulata. Proc R Soc B 278: 298–306.
39. Mayrose I, Friedman N, Pupko T (2005) A gamma mixture model better accounts for among site heterogeneity. Bioinformatics 21: 151–158. 40. Ren F, Tanaka H, Yang Z (2005) An empirical examination of the utility of
codon-substitution models in phylogeny reconstruction. Syst Biol 54: 808–818. 41. Tourasse NJ, Gouy M (1997) Evolutionary distances between nucleotide sequences based on the distribution of substitution rates among sites as estimated by parsimony. Mol Biol Evol 14: 287–298.
42. Huelsenbeck JP, Crandall KA (1997) Phylogeny estimation and hypotheses testing using maximum likelihood. Annu Rev Ecol Syst 28: 43766.
43. Sullivan J, Holsinger KE, Simon C (1996) The effect of topology on estimates of among-site rate variation. J Mol Evol 42: 308–312.
44. Fletcher W, Yang Z (2009) INDELible: A exible simulator of biological sequence evolution. Mol Biol Evol 26: 1879–1888.
45. Guindon S, Gascuel O (2003) A simple, fast, and accurate algorithm to estimate large phylogenies by maximum likelihood. Syst Biol 52: 696–704.