Diversification of Ramphastinae (Aves, Ramphastidae) prior to the
Cretaceous/Tertiary boundary as shown by molecular clock of mtDNA
sequences
Laila Alves Nahum
1,2, Sérgio Luiz Pereira
1,3, Flora Maria de Campos Fernandes
1,4, Sergio Russo Matioli
1and Anita Wajntal
11
Departamento de Biologia, Instituto de Biociências, Universidade de São Paulo. São Paulo, SP, Brazil.
2Alellyx Applied Genomics, Campinas, SP, Brazil.
3
Centre for Biodiversity and Conservation Biology, Royal Ontario Museum, Toronto, Canada.
4
Laboratório de Biologia Molecular, Museu de Zoologia, Universidade de São Paulo, São Paulo, Brazil.
Abstract
Partial cytochromeb and 12S rDNA mitochondrial DNA sequences of eight representatives of the Ramphastidae family were analyzed. We applied the linearized tree method to identify sequences evolving at similar rates and estimated the divergence times among some of the taxa analyzed. After excludingRamphastos tucanus and Capito dayi from our data set, the remaining taxa presented a constant rate of DNA substitution, and branch lengths could be re-estimated with a clock constraint using the maximum likelihood method. Branch lengths were calibrated assuming that Galliformes and Piciformes split around 100 million years ago (mya). Our results indicate that Ramphastinae, and probably Capitoninae, diverged from other Piciformes in the Late Cretaceous (~82 mya), suggesting that Piciformes is another avian order that survived the mass extinction event occurred 65 mya at the Cretaceous/Tertiary (K/T) boundary. The divergence times estimated within the Ramphastinae genera cover the period from the Middle Eocene (around 47 mya) through the Late Miocene (9.5 mya). Our estimate of divergence time is coincidental with the split of the African and the South American continents and other intense geologic activities and modifications of the areas which correspond to the current Neotropics. These events might have influenced the diversification of Ramphastinae in South America.
Key words:divergence times, K/T, mass extinction, cytochromeb, 12S rDNA, paleogeography, phylogeny. Received: September 10, 2002; Accepted: August 4, 2003.
Introduction
The biodiversity of Neotropical regions ranks amongst the highest in the world. To better understand the mechanisms that generated such high levels of biodiversity, we should be able to identify when, where and how the sep-aration between taxa occurred.
Whenever a representative fossil record from various strata of different ages is available, it makes it possible to trace back the origin of modern taxa and obtain reliable es-timates of splitting events. However, fossil records are rather poor in the Neotropics as compared to those of other regions of the world. Although reliable dating of diversifi-cation events between taxa is available for plants through valuable information on pollen records and petrified wood,
and even for some marine and aquatic fauna (e.g.Petri and
Fulfaro, 1988), such information is very scarce for mam-mals and, except for some records on ancient birds, practi-cally nonexistent for modern genera of birds. However, a few extinct species of Neotropical birds belonging to mod-ern genera have been described for the Pleistocene (Alvarenga, 1993).
In the absence of fossil records, DNA sequencing and analysis is one of the available tools to estimate divergence times. This approach allows formulating hypotheses about the events related to taxa differentiation by comparing the estimated time elapsed since splitting of taxa with well-documented paleogeological and paleoclimatic events. For example, estimates for intergeneric diversifica-tion in the Neotropical avifauna are available for Psittacidae (Miyakiet al., 1998) and Cracidae (Pereiraet al., 2002) and might provide valuable clues regarding the origin of taxa diversification in the Neotropics.
www.sbg.org.br
Send correspondence to Anita Wajntal. Universidade de São Paulo, Instituto de Biociências, Departamento de Biologia, Rua do Matão 277, sala 215, 05508-900 São Paulo, SP, Brazil. E-mail: [email protected].
The family Ramphastidae occurs from Mexico through Argentina and comprises 55 species of Neotropical birds belonging to two subfamilies: Ramphastinae (toucans and aracaris, six genera) and Capitoninae (New World barbets, three genera) (Sibley, 1996). The interest in this group has been increasing exponentially, and several recent papers have reported on comparative studies on morphol-ogy, isozymes, hybridization and molecular sequences (e.g.
Höfling, 1998; Castro et al., 2002; Barker and Lanyon,
2000). Barker and Lanyon (2000) analyzed 888 cytochromebbase-pairs from at least two species of each
genus through a plethora of weighting schemes for maxi-mum parsimony (MP) and proposed a phylogenetic hy-pothesis involving all Ramphastidae genera. Their results indicated Capitoninae (New and Old World barbets) as well as New World barbets to be paraphyletic, as suggested before (Prum, 1988; Sibley and Ahlquist, 1990), besides a very robust topology among the toucans and aracaris (Ramphastinae). Among these, the clade leading to
Ramphastos was the first to split off, followed by Aulacorhynchus as a sister to ((Andigena, Selenidera),
(Baillonius, Pteroglossus)). Maximum likelihood (ML)
tests showed similar results, and most topological differ-ences observed among ML and some of the MP weighting schemes might be related to stochastic errors due to small sequence sampling. The authors observed evolutionary rate variation among taxa, but they made no attempt to estimate the divergence time for any of the studied taxa.
Therefore, in the present study, we applied the linearized tree method (Takezakiet al., 1995) to a data set
of partial mitochondrial cytochromeb(cytb) and the small
ribosomal subunit 12S rDNA sequences of all six valid
Ramphastinae genera and one Capitoninae genus. We iden-tified the taxa, which evolved at a rate that was significantly different from the others, and estimated the divergence times among those taxa, which evolved within the average rate. We also discuss a possible evolutionary scenario for their diversification, based on events of the history of Earth.
Material and Methods
DNA sequencing
Total DNA was extracted from blood samples from seven Ramphastinae and one Capitoninae representatives (Table 1) as described elsewhere (Brufordet al., 1992). The DNA samples were used in PCR amplifications done in a final volume of 10.0µL containing 20 ng of total DNA, polymerase buffer (Jeffreyset al., 1988), 1.0µM of each primer, and 2.5 units of Taq DNA polymerase (Perkin
Elmer). The primers employed to amplify and sequence a portion of the cytbgene were L14841 and H15149 (Kocher et al., 1989), H16065 (Kornegay et al., 1993), reverse L
(Chenget al., 1994), L-internal, H-internal 2 and H-internal
3 (Miyakiet al., 1998). The 12S rDNA L and 12S rDNA H
primers (Miyakiet al., 1998) were used to amplify a portion
of the 12S rDNA gene. Thirty DNA amplification cycles were carried out, consisting of denaturation for 1 min at 95 °C, annealing for 30 s at 50 °C, and extension for 40 s at 72 °C each, using a TC2400 thermocycler (PE Applied Biosystems). An initial denaturation step of 5 min at 95 °C preceded the amplifications. A final extension step of 5 min at 72 °C was utilized. PCR products were separated on a 1% agarose gel and recovered in a 15% PEG8000 solution pre-pared with TBE buffer (Zhen and Swank, 1993). These
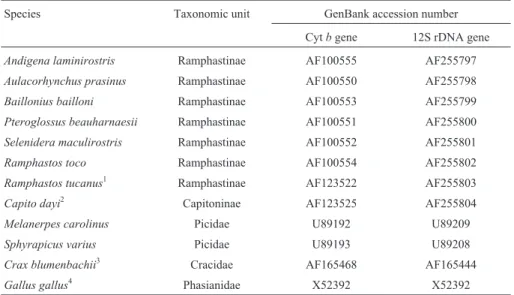
Table 1- Cytband 12S rDNA sequences of taxa analyzed in the present study.
Species Taxonomic unit GenBank accession number
Cytbgene 12S rDNA gene
Andigena laminirostris Ramphastinae AF100555 AF255797
Aulacorhynchus prasinus Ramphastinae AF100550 AF255798
Baillonius bailloni Ramphastinae AF100553 AF255799 Pteroglossus beauharnaesii Ramphastinae AF100551 AF255800
Selenidera maculirostris Ramphastinae AF100552 AF255801
Ramphastos toco Ramphastinae AF100554 AF255802
Ramphastos tucanus1 Ramphastinae AF123522 AF255803
Capito dayi2 Capitoninae AF123525 AF255804 Melanerpes carolinus Picidae U89192 U89209
Sphyrapicus varius Picidae U89193 U89208
Crax blumenbachii3 Cracidae AF165468 AF165444 Gallus gallus4 Phasianidae X52392 X52392
1: cytb(Lanyon & Hall, 1994) and 12S rDNA (present work). 2: cytb(Barker & Lanyon, 2000) and 12S rDNA (present work). 3: both cytband 12S rDNA (Pereiraet al., 2002).
samples were then used in DNA sequencing reactions. A single PCR product of the expected size for cytband 12S
rDNA genes was visualized on the agarose gel.
Sequencing reactions were prepared using either the Dye Terminator Cycle Sequencing kit (PE Applied Biosystems) or the Thermo Sequenase Dye Terminator Cy-cle Sequencing kit (Amersham Life Science), according to the manufacturer’s instructions. The samples were submit-ted to electrophoresis on an ABI PRISM 310 Genetic Ana-lyzer (PE Applied Biosystems). Chromatograms of both strands of each gene were compared and the ambiguities were visually corrected using the Sequence Navigator soft-ware (version 1.0.1, PE Applied Biosystems; Parker, 1997). The GenBank accession numbers of all sequences obtained are listed in Table 1. This table also shows the ac-cession numbers of Lanyon and Hall’s (1994)Ramphastos tucanussequence and Barker and Lanyon’s (2000)Capito dayisequence, which were included in our analyses.
The corresponding sequences from two other Piciformes (Melanerpes carolinusandSphyrapicus varius) (Espinosa de los Monteros, 2000) and two Galliformes rep-resentatives (Crax blumenbachii and Gallus gallus) (Pereiraet al., 2002; Desjardins and Morais, 1990) were in-cluded in the phylogenetic analysis, and their accession numbers are also shown in Table 1. The sequences were aligned in Clustal W (Thompsonet al., 1994) and visually checked for misaligned positions in MacClade (version 3.08, Maddison and Maddison, 1992).
Phylogenetic analysis
Cytband 12S rDNA sequences were tested for
multi-ple hits by plotting uncorrected distances against the num-ber of transition and transversion for all pairwise comparisons. These analyses were carried out using MEGA (version 2.1, Kumaret al., 2001). All three codon
positions of the cytbsequences were included in the data
set for the tree reconstruction. Sites containing missing in-formation in both sequence sets and the gaps found in 12S rDNA sequences were excluded. Both cytband 12S rDNA
sequences were concatenated in one final data set. Tree reconstruction was performed by means of the branch and bound algorithm under maximum parsimony (MP) and maximum likelihood (ML) criteria, using PAUP* (version 4.0b8, Swofford, 2002) and selecting Crax blumenbachiiandGallus gallusas outgroups. To identify
the best model of evolutionary changes for the ML analysis, the data set was subjected to the hierarchical likelihood ra-tio test (LRT, Huelsenbeck and Rannala, 1997), carried out using Modeltest (version 3.0, Posada and Crandall, 1998). In this case, it tested whether the addition of parameters (such as unequal base frequency, rates of transition be-tween purines and bebe-tween pyrimidines, rates of transversions, proportion of invariable sites, and rate varia-tion among sites) significantly improved the likelihood of the ML tree. Rate variation among sites was accounted for
by three different assumptions. First, it was assumed that a proportion of sites is invariable (I) and that the variable sites evolve at the same rate; second, that all sites evolve ac-cording to a discrete gamma distribution (G); and finally that, differently from the first assumption, the variable sites are allowed to evolve according to G. The parameters ob-tained by Modeltest were used as user-defined parameters in PAUP, to speed up likelihood computation.
Support for nodes in our reconstructions was obtained by jackknifing our data set in PAUP. Two sets of analysis were performed in this case, one assuming 30% and the other 50% deletion in each replicate, for 100 replicates. The purpose of the jackknife analysis was to measure the ro-bustness of the Ramphastid phylogeny with a more reduced data set.
To determine whether the taxa included in our analy-sis evolved at the same rate, we performed a LRT. In this case, we tested whether likelihood values for trees with and without the assumption of a clock-like mode of evolution (Felsenstein, 1981) are significantly different. Unfortu-nately, the LRT was significant, suggesting that at least one sequence had an evolutionary rate that was significantly different from the others.
There are options available to determine divergence time in the absence of a general molecular clock. Some methods allow rates to differ among lineages (Sanderson, 1997; Thorneet al., 1998) and others accept rate variation
at any point of the tree (Huelsenbecket al., 2000).
How-ever, these studies present limitations and should be further investigated (Yoder and Yang, 2000). Alternatively, find-ing out which taxa evolve at a lower or higher rate than the average would help selecting and excluding the atypically evolving taxa. The analysis could then be performed with only those taxa, which evolve at similar rates (Takezakiet al., 1995; Rambaut and Bromham, 1998). The linearized
tree method (Takezakiet al., 1995) consists of two different
tests (two-cluster and branch-length), which seem to yield similar results and have been widely applied, for instance, in estimates of divergence time for the origin of orders of birds and mammals (Hedgeset al., 1996), drosophilid
spe-cies (Russoet al., 1995; Takezakiet al., 1995) and
homi-noids (Takezaki et al., 1995). Both tests require an
outgroup in order to root the tree. The two-cluster test iden-tifies statistical differences between the average substitu-tion rates of two clusters joined by an interior node. This information allows eliminating those clusters that differ from the average root-to-tip distance. On the other hand, the branch-length test allows the identification of taxa evolving significantly faster or slower than the average. We decided to test for clock-like behavior through the branch-length tests implemented in the LinTree software (Takezakiet al., 1995). Here, we eliminated taxa evolving
were found among sequences (Takezakiet al., 1995), and
molecular clock assumption was possible.
After excluding taxa with significantly different rates, we re-estimated branch lengths through maximum likelihood, assuming rate constancy among taxa and using the evolutionary model that best fit the data. We assumed that Galliformes diverged from other neognaths in the Cre-taceous around 100 mya, as proposed by Paton et al.
(2002). Standard errors for time estimates were obtained by non-parametric bootstrapping of our original data set.
Results
Our final alignment comprised 1160 sites (846 sites for cytb, and 314 sites for 12S rDNA sequences). After the
exclusion of the sites containing missing information and gaps, a total of 1128 sites were used for the phylogenetic re-construction. No indels were present in the aligned cytb
se-quences, and the translated amino acid sequences were highly similar to other vertebrate cytbsequences available
in the GenBank. The 12S rDNA sequences were also very similar to those described for other Piciformes and other birds deposited in the GenBank. Third codon positions of the cyt b sequences were saturated by multiple hits, as
shown by comparisons between families, but not within families (data not shown). It has been shown that third codon positions can negatively affect parsimony analyses if saturated (Barker and Lanyon, 2000). However, these posi-tions do contain phylogenetic information (Björklund, 1999; Edwardset al., 1991; Hastad and Björklund, 1998;
Källersjöet al., 1999; Yoder and Yang, 2000) and were
therefore maintained in our analyses.
Base composition among variable sites of the com-bined cytband 12S rDNA sequences was homogeneous among the taxa analyzed, except for Capito dayi
(p = 0.001). The transition/transversion ratio estimated from the data set was equal to 2.21. Among the sites ana-lyzed, 658 were invariable and 107 were parsimony infor-mative. Mean uncorrected distances were 0.128 ± 0.031 substitutions per site among the Ramphastidae, 0.175 ± 0.016 substitutions per site among the Piciformes, and 0.186 ± 0.014 substitutions per site between Piciformes and Galliformes.
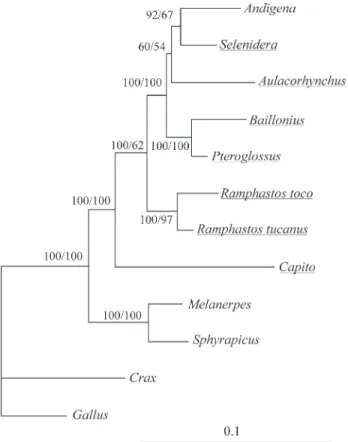
Tree topologies revealed by MP and ML analysis in the present work are presented in Figure 1 and are mostly congruent with those published by Barker and Lanyon (2000). The same tree topology was obtained when these genes were analyzed separately by either MP or ML.
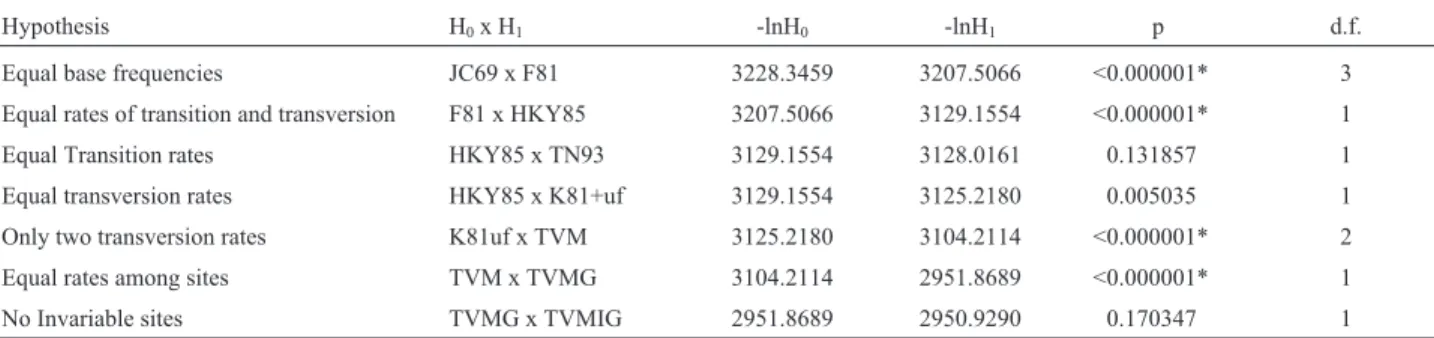
LRTs revealed that the model which best fit the pat-tern of nucleotide substitutions found for these sequences was the transversional model (TVM, assuming unequal base frequency, different transition and transversion rates; Posada and Crandall, 1998), accounting for rate heteroge-neity of substitutions among sites. Results are shown in Ta-ble 2.
We applied the LRT to test the molecular clock hy-pothesis and found that it did not support a clock-like be-havior of nucleotide substitutions of the analyzed sequences. This result prevented the estimation of the di-vergence times among the Ramphastidae (log-likelihood without clock = -2966.38, log-likelihood with clock = -2979.43;χ2= 26.10, d. f. = 10, p = 0.0036). Thus, to select only the constantly evolving sequences, so that the molecu-lar clock could be assumed, we performed the branch-length test. The results (Table 3) showed that R. tucanus and C. dayi have nucleotide substitution rates,
which are lower and higher, respectively, than those of the remaining taxa (atα= 0.05, Figure 1).
Finally, after excludingR. tucanusandC. dayifrom
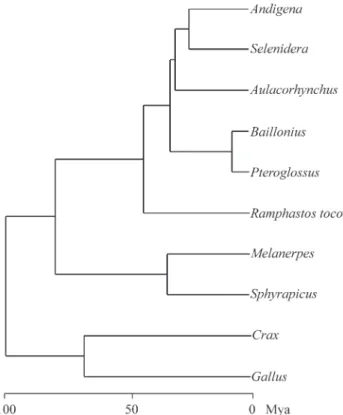
our data set, the remaining taxa presented similar rates of nucleotide substitutions, and thus branch lengths could be re-estimated with the clock constraint (Figure 2). Assuming that the Galliformes-Piciformes split occurred around 100 million years ago (mya, Patonet al., 2002), our estimates
indicate that toucans and aracaris have diverged from other Piciformes around 82 mya (Table 4). Also, it is possible to
estimate the generic diversification within the subfamily Ramphastinae occurred from the Middle Eocene (around 47 mya) to the Late Miocene (9.5 mya). The divergence time between Ramphastinae and Capitoninae (represented in this study byC. dayi) could not be estimated because the
sequences ofC. dayidid not evolve at the same rate as other
Ramphastids. It should, however, be prior to the separation between toucans and aracaris, as Capitoninae is a sister group to Ramphastinae (Figure 1).
Discussion
In our study, partial cytband 12S rDNA sequences of
eight Rhamphastidae representatives were aligned to correspondening sequences of two other Piciformes and two Galliformes. The evolutionary hypothesis provided in our study and that of Barker and Lanyon (2000) are very congruent showing the robustness of the classification at the generic level and therefore no further comments on the tree topologies will be made. However, we will focus on es-timates of divergence times for the genera within the subfamily Rhamphastinae.
Estimation of divergence times based on molecular data is a common practice in phylogenetic studies (e.g.
Arnaiz-Villena et al., 1999; García-Moreno and Silva,
1997; van Tuinenet al., 1998) and could offer insight into
temporal mode (e.g.rates of diversification) or historical
determinants of diversification, as geologically induced vicariance. Fossil data (e.g., Fleischer et al., 1998) and
biogeographic events (e.g., García-Moreno and Mindell,
2000) can be used as calibration points for estimating mo-lecular divergence times (Smith, 1998). However, for Ramphastidae, this information is very scarce (Feduccia, 1996; Sick, 1993). Three different approaches were avail-able for the estimation of divergence times in our study: 1) the molecular estimate for the separation of Galloanserae from Neoaves 100 mya (Patonet al., 2002); 2) a
mitochon-drial DNA evolutionary rate of 2.0% per mya (Shields and Wilson, 1987; Kornegay et al., 1993; Klicka and Zink,
1997; Fleischeret al., 1998); and 3) the 0.5% rate for the
transversions occurring at third codon positions per mya (Irwinet al., 1991).
We decided for the first option for the following rea-sons: (1) the molecular estimate is supported by a body of evidence as shown, for instance, by the fossil record (e.g.,
Stidham, 1998) and also by mitochondrial and nuclear DNA sequences (e.g., van Tuinen and Hedges, 2001, Table 2- Hierarchical Likelihood Ratio Tests (HLRTs) performed for seven hypotheses of DNA substitution for our combined cytband 12S rDNA sequences.
Hypothesis H0x H1 -lnH0 -lnH1 p d.f.
Equal base frequencies JC69 x F81 3228.3459 3207.5066 <0.000001* 3
Equal rates of transition and transversion F81 x HKY85 3207.5066 3129.1554 <0.000001* 1
Equal Transition rates HKY85 x TN93 3129.1554 3128.0161 0.131857 1
Equal transversion rates HKY85 x K81+uf 3129.1554 3125.2180 0.005035 1
Only two transversion rates K81uf x TVM 3125.2180 3104.2114 <0.000001* 2
Equal rates among sites TVM x TVMG 3104.2114 2951.8689 <0.000001* 1
No Invariable sites TVMG x TVMIG 2951.8689 2950.9290 0.170347 1
Rate matrix: [A-C] = 4.52; [A-G] = 9.83; [A-T] = 2.96; [C-G] = 0.87; [C-T] = 13.96; [G-T] = 1.0. Base frequencies for A, C, G and T, respectively, 0.2487, 0.2889, 0.1694, 0.2659. Gamma distribution shape parameter = 0.187. H0: null hypothesis; H1: alternative hypothesis; L0: likelihood under H0; L1: likelihood under H1; d.f.: degrees of freedom;Γ: gamma distribution. * - significant at 0.005.
Table 3 - Branch length test under Tamura-Nei model of DNA substitution, assuming sequences to present rate heterogeneity of substitutions among sites (α= 0.18).
First round δ s.e. Z CP (%)
Sphyrapicus varius 0.057420 0.051990 1.104433 73
Melanerpes carolinus 0.022052 0.053797 0.409915 31 Ramphastos toco 0.041827 0.039701 1.053554 71
Ramphastos tucanus 0.110583 0.033448 3.306176 100*
Capito dayi 0.231403 0.086751 2.667438 99*
Aulacorhynchus prasinus 0.021010 0.041465 0.506683 38
Selenidera maculirostris 0.004389 0.039799 0.110276 9
Andigena laminirostris 0.031055 0.037044 0.838321 59
Pteroglossus beauharnaesii 0.022736 0.033860 0.671458 50
Baillonius bailloni 0.051756 0.042508 1.217565 77
Second round δ s.e. Z CP(%)
Sphyrapicus varius 0.039310 0.050526 0.778013 56
Melanerpes carolinus 0.012249 0.052295 0.234230 18
Ramphastos toco 0.038504 0.043336 0.888497 62
Aulacorhynchus prasinus 0.037096 0.047058 0.788298 56 Selenidera maculirostris 0.007310 0.037159 0.196724 15
Andigena laminirostris 0.049645 0.038750 1.281157 80
Pteroglossus beauharnaesii 0.001073 0.039056 0.027479 2
Baillonius bailloni 0.069985 0.046223 1.514049 87
Gallus gallusandCrax blumenbachiiwere used as outgroup.δ- expectation of no difference between branch lengths. s.e. standard error. CP -confidence probability. * - significant at 5% level.
Haddrath and Baker, 2001, Patonet al., 2002); (2) some
groups seem to have evolved at rates other than the 2.0% sequence divergence per million years (Kessler and Avise, 1985); (3) using only transversions at the third codon posi-tions would exclude 12S rDNA sequences and reduce our data set to fewer base pairs, since not all third codon posi-tions of the cyt b sequences used here presented
transversions, thus increasing the stochastic error in our es-timates. Furthermore, the use of ancient calibration makes the estimation an interpolation rather than an extrapolation, which is inherently subject to greater errors.
The branch length tests indicated that the sequences ofR. tucanusandC. dayidid not evolve at the same rate as
the others. As pointed out by Barker and Lanyon (2000), there is non-stationarity in cytbthird positions ofCapito.
Incidentally, this base composition effect explains the ap-parent rate increase inCapitoreported here. By excluding R. tucanusandC. dayifrom our data set, we were unable to
reject a clock-like behavior for the remaining taxa. Divergence times, as estimated here, indicate that the subfamily Ramphastinae, and probably the Capitoninae, di-verged from other Piciformes in the Late Cretaceous, well before the Cretaceous/Tertiary (K/T) mass extinction events of 65 mya. Indeed, Cooper and Penny (1997) esti-mated, based on fossil calibrations, that at least 22 lineages of modern birds were diversified prior to the K/T boundary. In their study, the authors did not include any member of Piciformes. Therefore, an important result of our study is the rise of the number of extant orders, which survived the K/T mass extinction. Although suggesting a cause for the diversification of Ramphastidae is a difficult task, some events of Earth history may help fulfill the endeavor.
The separation of Ramphastidae from other Piciformes, as estimated here, also coincides with the sepa-ration of Africa from South America. These landmasses be-gan to fragment around 120-130 mya due to sea-floor spreading and, by 90 mya, they were completely separated (Salgado-Labouriau, 1994). Some evidence exists that the terrestrial vertebrates could probably move through these landmasses until 80-70 mya (Sibley and Ahlquist, 1990, and references therein). The range of divergence times within the subfamily Ramphastinae estimated here includes the period from the Middle Eocene to the Late Miocene. Those epochs are known to have had intense geologic ac-tivities that drastically changed the Earth climate and geog-raphy (Briggs, 1987; Salgado-Labouriau, 1994). One of the major changes includes the rising of the Andes (Potts and Behrensmeyer, 1992; Marshall and Sempere, 1993) that modified the climate and the river basins throughout the South American continent. A large sea transgression cover-ing extensive areas of central South America has also been reported for that time (Petri and Fulfaro, 1988). These events might have influenced dispersal and diversification of living organisms, by changing or generating new habi-tats and even new ecosystems. For instance, the divergence time estimated here between the mountain-toucans,
Andigena, and their lowland sister-taxon,Selenidera, was
around 27 mya. This time corresponds to a major period of Andean uplift (Potts and Behrensmeyer, 1992; Marshall and Sempere, 1993), and we could assume thatAndigena
became adapted to the greater altitudes provided by the newly formed Cordillera of the Andes.
Most members of the subfamily Ramphastinae live in forests, but severalPteroglossusspecies live in drier
envi-ronments (Haffer, 1974). These envienvi-ronments are currently represented by the cerrado (Brazilian savanna) and caatinga
Figure 2- Maximum likelihood clock tree under the transversional model with rate heterogeneity of DNA substitution among sites. Divergence times are indicated in a time scale below the phylogenetic hypothesis for those taxa evolving at a similar rate of DNA substitution.GallusandCrax
(Galliformes) were used as outgroup.MelanerpesandSphyrapicusare
members of Picidae, and the remaining taxa belong to Ramphastinae.
Table 4- Divergence time estimates (in million years) for the Neotropical Ramphastinae and other Old World Piciformes, based on the divergence of Galliformes and other neognaths having occurred 100 million years ago (Patonet al., 2002).
Taxon Divergence times
(±standard errors)
Geological time
BailloniusxPteroglossus 9.5 ± 1.5 Late Miocene
AndigenaxSelenidera 27.8 ± 3.9 Late Oligocene
Aulacorhynchus 34.4 ± 3.7 Early Oligocene
Ramphastos 46.8 ± 5.4 Middle Eocene Ramphastinaex other piciforms 82.6 ± 9.6 Late Cretaceous
(Brazilian semi-arid vegetation) biomes of Central and North-Eastern Brazil, respectively. We suggest that the drying out of central South America leading to the forma-tion of the Brazilian savanna and the isolaforma-tion of the Atlan-tic forest during the Miocene may have allowed the diversification ofPteroglossusfrom other toucans.
In conclusion, one of the significant results of our work was the inclusion of Ramphastidae among the lin-eages that survived the K/T extinction. Also, the uplift of the Andes during the Miocene and Eocene seems to have offered opportunities for the genera diversification of tou-cans, as well as of other Neotropical birds (Miyakiet al.,
1998; Pereiraet al., 2002) and of mammals (Cortés-Ortizet al., 2003). These opportunities are related to geographic
changes in South America, namely alterations in river bas-ins, forest distribution, and formation of altitude and sa-vanna-like habitats. A better understanding of how these processes influenced diversification within these groups should be provided by a more comprehensive study, in-creasing taxon sampling within Ramphastidae and other Neotropical groups (e.g.Cortés-Ortizet al., 2003).
Acknowledgments
We thank Fundação Parque Zoológico de São Paulo, Maria de Lourdes Cavalheiro (Universidade Federal do Paraná), Maria Luiza Videira Marceliano (Museu Paraense Emílio Goeldi), Miguel Trefaut Urbano Rodrigues (Uni-versidade de São Paulo), Parque Zoológico de Sorocaba, and Vitor Fasano and Carlos Keller (Criadouro Tropicus) who kindly provided tissue samples that are deposited at the Laboratório de Genética e Evolução Molecular de Aves do Depto de Biologia da Universidade de São Paulo, Brazil; Cristina Yumi Miyaki for invaluable suggestions and labo-ratory support; Mariana Cabral, Mari-Anne Van Sluys and Regina Yuri Hashimoto Miura for allowing the use of their automated DNA sequencer; Alexandre Magno Feitosa Sales, Elizabeth Höfling, Eugene Harris, Linda Amaral Zettler, Luís Fábio Silveira, Robert Blaquière, and two anonymous reviewers for helpful discussions and sugges-tions. Financial support was provided by CNPq (National Council for Scientific and Technological Development) and FAPESP (The State of São Paulo Research Founda-tion).
References
Alvarenga H (1993) Fossil Birds. In: Sick H (ed) Birds in Brazil. Princeton University Press, Princeton, pp 62-67.
Arnaiz-Villena A, Álvarez-Tejado M, Ruíz-del-Valle V, García-de-la-Torre C, Varela, P, Recio MJ, Ferre S and Marti-nez-Laso J (1999) Rapid radiation of canaries (genus
Serinus). Mol Biol Evol 16:2-11.
Barker FK and Lanyon SM (2000) The impact of parsimony weighting schemes on inferred relationships among toucans and Neotropical barbets (Aves: Piciformes). Mol Phylogenet Evol 15:215-234.
Björklund M (1999) Are third positions really that bad? A test us-ing vertebrate cytochromeb. Cladistics 15:191-197. Briggs J (1987) Biogeography and plate tectonics. Developments
in Paleontology and Stratigraphy, 10. Elsevier, Amsterdam, 204 pp.
Bruford MW, Hanotte O, Brookfield JFY and Burke T (1992) Sin-gle-locus and multilocus DNA fingerprinting. In: Hoezel AR (ed) Molecular Genetic Analysis of Populations - A practical approach. Oxford University Press, New York, pp 225-269.
Castro MS, Recco-Pimentel SM and Rocha GT (2002) Karyotypic characterization of Ramphastidae (Piciformes, Aves). Genet Mol Biol 25:147-150.
Cheng S, Fockler C, Barnes WM and Higuchi R (1994) Effective amplification of long targets from clones inserts and human genomic DNA. Proc Natl Acad Sci USA 91:5695-5699. Cooper A and Penny D (1997) Mass survival of birds across the
cretaceous tertiary boundary: molecular evidence. Science 275:1109-1113.
Cortés-Ortiz L, Bermingham E, Rico C, Rodríguez-Luna E, Sampaio I and Ruiz-García M (2003) Molecular systematics and biogeography of the Neotropical monkey genus,
Alouatta. Mol Phylogenet Evol 26:64-81.
Desjardins P and Morais R (1990) Sequence and gene organiza-tion of the chicken mitochondrial genome - a novel gene or-der in higher vertebrates. J Mol Biol 212:599-634. Edwards SV, Arctander P and Wilson AC (1991) Mitochondrial
resolution of a deep branch in the genealogical tree for perching birds. Proc R Soc Lond B Biol Sci 243:99-107. Espinosa de los Monteros A (2000) Higher-level phylogeny of
trogoniformes. Mol Phylogenet Evol 14:20-34.
Feduccia A (1996) The origin and evolution of birds. Yale Uni-versity Press. USA, 480 pp.
Felsenstein J (1981) Evolutionary trees from DNA sequences: a maximum likelihood approach. J Mol Evol 17:368-376. Fleischer RC, McIntosh CE and Tarr CL (1998) Evolution on a
volcanic conveyor belt: using phylogeographic reconstruc-tion and K-Ar-based ages of the Hawaiian islands to esti-mate molecular evolutionary rates. Mol Ecol 7:533-545. García-Moreno J and Mindell DP (2000) Rooting a phylogeny
with homologous genes on opposite sex chromosomes (gametologs): A case study using avian CHD. Mol Biol Evol 17:1826-1832.
García-Moreno J and Silva JMC (1997) An interplay between for-est and non-forfor-est South American avifaunas suggfor-ested by a phylogeny of Lepidocolaptes woodcreepers (Dendro-colaptinae). Stud Neotrop Environ 32:164-173.
Haddrath O and Baker AJ (2001) Complete mitochondrial DNA genome sequences of extinct birds: ratite phylogenetics and the vicariance biogeography hypothesis. Proc R Soc Lond B Biol Sci 268:939-945.
Haffer J (1974) Avian Speciation in Tropical South America: With a Systematic Survey of the Toucans (Rampastidae) & Jacamars (Galbulidae). Cambridge, Massachusetts, 390 pp. Hästad O and Björklund M (1998) Nucleotide substitution models
and estimation of phylogeny. Syst Zool 40:257-270. Hedges SB, Parker PH, Sibley CG and Kumar S (1996)
Continen-tal breakup and the ordinal diversification of birds and mam-mals. Nature 381:226-229.
Huelsenbeck JP and Rannala B (1997) Phylogenetic methods come of age: testing hypothesis in an evolutionary context. Science 276:227-232.
Huelsenbeck JP, Larget B and Swofford D (2000) A compound Poisson process for relaxing the molecular clock. Genetics 154:1879-1892.
Irwin DM, Kocher TD and Wilson AC (1991) Evolution of the cytochromebgene of mammals. J Mol Evol 32:128-144. Jeffreys AJ, Wilson V, Neumann RA and Keyne J (1988)
Ampli-fication of human minisatellites by the polymerase chain re-action: towards DNA fingerprinting of single cells. Nucleic Acids Res 16:10953-10971.
Källersjö M, Albert VA and Farris JS (1999) Homoplasy in-creases phylogenetic structure. Cladistics 15:91-93. Kessler LG and Avise JC (1985) A comparative description of
mi-tochondrial-DNA differentiation in selected avian and other vertebrate genera. Mol Biol Evol 2:109-125.
Klicka J and Zink RM (1997) The importance of recent ice ages in speciation: A failed paradigm. Science 277:1666-1669. Kocher TD, Thomas WK, Meyer A, Edwards SV, Pääbo S,
Villablanca FX and Wilson AC (1989) Dynamics of mito-chondrial DNA evolution in animals: amplification and se-quencing with conserved primers. Proc Natl Acad Sci USA 86:6196-6200.
Kornegay JR, Kocher TD, Williams LA and Wilson AC (1993) Pathways of lysozyme evolution inferred from the se-quences of cytochromebin birds.J Mol Evol 37:367-379. Kumar S, Tamura K, Jakobsen IB and Nei M (2001) MEGA2:
Molecular Evolutionary Genetics Analysis software, Bio-informatics 17:1244-1245.
Lanyon SM and Hall JG (1994) Reexamination of barbet monophyly using mitochondrial-DNA sequence data. Auk 111:389-397.
Maddison WP and Maddison DR (1992)MacClade. Version 3.08. Sinauer, Sunderland, MA.
Marshall LG and Sempere T (1993) Evolution of the neotropical Cenozoid land mammal fauna in its geochronologic, strati-graphic, and tectonic context. In: Goldblatt P (ed) Biological relationships between Africa and South America. Yale Uni-versity Press, New Haven, pp 329-392.
Miyaki CY, Matioli SR, Burke T and Wajntal A (1998) Parrot evolution and paleogeographical events: mitochondrial DNA evidence. Mol Biol Evol 15:544-551.
Parker SR (1997) Sequence Navigator. Multiple sequence align-ment software. Methods Mol Biol 70:145-154.
Paton T, Haddrath O and Baker AJ (2002) Complete mitochon-drial DNA genome sequences show that modern birds are not descended from transitional shorebirds. Proc R Soc Lond B Biol Sci 269:839-846.
Pereira SL, Baker AJ and Wajntal A (2002) Combining nuclear and mitochondrial DNA sequences resolve generic relation-ships within the Cracidae (Galliformes, Aves). Syst Biol 51:946-958.
Petri S and Fulfaro VJ (1988) Geologia do Brasil.Ed.
Univer-sidade de São Paulo, São Paulo, 631 pp.
Posada D and Crandall KA (1998) MODELTEST: testing the model of DNA substitution. Bioinformatics 14:817-818.
Potts R and Behrensmeyer AK (1992) Late Cenozoic terrestrial ecosystems. In: Bahrensmeyer AK, Damuth JD, DiMichele WA, Potts R, Sues HD and Wing SL (eds) Terrestrial eco-systems though time. University of Chicago Press, Chicago, pp 419-541.
Prum RO (1988) Phylogenetic interrelationships of the barbets (Aves: Capitonidae) and toucans (Aves: Ramphastidae) based on morphology with comparisons to DNA x DNA hy-bridization. Zool J Linn Soc 92:313-343.
Rambaut A and Bromham L (1998) Estimating divergence times from molecular sequences. Mol Biol Evol 15:442-448. Russo CAM, Takezaki N and Nei M (1995) Molecular phylogeny
and divergence times of Drosophilid species. Mol Biol Evol 12:391-404.
Salgado-Labouriau ML (1994) História ecológica da Terra. Edi-tora Edgard Blücher Ltda, São Paulo, 370 pp.
Sanderson MJ (1997) A nonparametric approach to estimating di-vergence times in the absence of rate constancy. Mol Biol Evol 14:1218-1231.
Shields GF and Wilson AC (1987) Calibration of mitochondrial DNA evolution in geese. J Mol Evol 24:212-217.
Sibley CG (1996) Birds of the world. Version 2.0, Thayer Birding Software.
Sibley CG and Ahlquist JE (1990) Phylogeny and classification of birds - a study in molecular evolution. Yale University
Press, New Haven, 976 pp.
Sick H (1993) Birds in Brazil: A Natural History. Princeton Uni-versity Press, Princeton, 932 pp.
Smith AB (1998) What does paleontology contribute to systemat-ics in a molecular world? Mol Phylogenet Evol 9:437-447. Stidham TA (1998) A lower jaw from a Cretaceous parrot. Nature
396:29-30.
Swofford DL (2002) PAUP*: Phylogenetic Analysis Using Parsi-mony (* and related methods). Version 4.0b8, Sinauer Asso-ciates, Massachusetts.
Takezaki N, Rzhetsky A and Nei M (1995) Phylogenetic test of the molecular clock and linearized trees. Mol Biol Evol 12:823-833.
Thompson JD, Higgins DG and Gibson TJ (1994) CLUSTALW: improving the sensitivity of progressive alignment through sequence weighting, position-specific gap penalties and weight matrix choice. Nucleic Acids Res 22:4673-4680. Thorne JL, Kishino H and Painter IS (1998) Estimating the rate of
evolution of the rate of molecular evolution. Mol Biol Evol 15:1647-1657.
van Tuinen M and Hedges SB (2001) Calibration of avian molec-ular clocks. Mol Biol Evol 18: 206-213
van Tuinen M, Sibley CG and Hedges SB (1998) Phylogeny and biogeography of ratite birds inferred from DNA sequences of the mitochondrial ribosomal genes. Mol Biol Evol 15:370-376.
Yoder AD and Yang Z (2000) Estimation of primate speciation dates using local molecular clocks. Mol Biol Evol 17:1081-1090.
Zhen L and Swank RT (1993) A simple and high yield method for recovering DNA from agarose gels. Biotechniques 14:894-896.