GENDER DISPARITIES REGARDING WAGE AS A MOTIVATIONAL
TOOL IN THE CURRENT ECONOMIC CONTEXT
DEMYEN SUZANA
TEACHING ASSISTANT,
UNIVERSITY “EFTIMIE MURGU” OF RESITA
PHD CANDIDATE, WEST UNIVERSITY OF TIMISOARA
e-mail:[email protected]
LALA POPA ION
PROFESSOR PHD, WEST UNIVERSITY OF TIMISOARA
e-mail:[email protected]
Abstract
The deepening process of globalization, negative trends regarding demographic evolution both nationally and internationally, also the emigration phenomenon and the long-term effects of the economic crisis, are the main challenges in terms of creating a general support and to encourage a fair and effective management of human resources, regardless of the industry they are developing their activity. Motivation consists in a series of problems that need to be solved in order to generate both individual and team performance, and wage is seen as one of the most important motivational tools. Though we have witnessed a less serious gap between wages according to the gender criterion, still there can be identified certain issues that need to be solved regardless the most recent trends in management.
Key words: wage, motivation, human resource management, gender, disparity
Clasificare JEL : E24, J16, J31, M54
1.
Introduction
According to specialists, "the global crisis has had significant negative repercussions for the labor market in many parts of the world, and the return proved unreliable."[6] The main effects were felt not only global, but can be analyzed from microeconomic perspective also, in order to identify key issues that make the connection between economic and management sides.
The challenges faced by business management generally, and especially by human resource management become even more pronounced as the sector most affected by the crisis management is the remuneration of staff. Whether we speak of Romania, whether we are referring to the EU level, we find that wages fluctuated during the period of time dominated by crisis and also months after the beginning of recovery. According to the Global Wage Report [6], 2009 represented the point where wages in Eastern Europe had the lowest levels. However, if we refer to a longer period of time, we can say that in Asia the trend has been one unexpected attending an average real wages doubled in the decade from 2001 to 2011.
Human resource management challenges become even more worthy of notice as the Maslow hierarchy of needs indicates that "in organizations, internal factors like (...) incentives or internal competition prevents employees to focus their efforts on learning, improvement and innovation." [3] Motivation to achieve a higher level of performance and achievement of higher values of key performance indicators is driven mainly by the rewards, resulting mostly in salaries and bonuses.
2. Economic crisis vs. the crisis of management
“The efficiency of human capital depends on the quality of the education received and the higher the investments in education, the higher the performance level of human capital” [4] Still, it isn’t enough just to attract the proper workforce. It also has to be preserved so that it could create a certain performance level. Wage levels in Romanian firms remain much lower than those recorded at European or world level. [11]
Therefore arises the question whether organizations in general, especially the Romanian ones can support and motivate human resources to such an extent that they remain loyal to the company, being concerned at the same time to stop or at least reduce the amount of growing labor immigrants.
substantial reward, while another group chooses to leave the organization that does not provides extra motivation, choosing to emigrate as a proper solution, with the hope to gain a higher salary outside the national boundaries [12].
The concept of wage generally identifies “gross remuneration, including regular bonuses received by employees in a specific period of time" (Global Wage Report Concerning the International Classification ILO resolution of Status in Employment (ISCE), Adopted by the 15th International Conference of Labor Statisticians,
Geneva, October 1993) [6]. “There are major differences in the rate of growth of real average wages in the
regions and countries they generally increasing faster in areas with strong economic growth" [6]. Partial wage increase in a certain region can be also influenced by general economic trends worldwide.
According to the World Report on wages, wage growth rate from one year to the next has varied from one continent to another in a major proportion. The world situation in the period of 2006-2011 is presented in the following chart:
Figure 1 - The annual average real wage growth between 2006 - 2011 Source: The Global Wage Report 2013 [6]
Variations in wage trends differ from country to another, as well as their levels. It is necessary however, to appreciate the labor productivity indicator, statistical data indicating the doubling of its value over developed economies [6]. In Romania, the average labor productivity has evolved according to the following schedule [8]:
202,62 221,9
252,24
0 50 100 150 200 250 300
2011 2012 2013
Figure 2 - Average labor productivity in Romania, expressed in lei / person
Source: The White Book of SME’s, 2013, National Council of Private Small and Medium Sized Enterprises [8]
the period under review to the total number of people employed. This conclusion is shared by most European countries [7], which also records higher values of national productivity. On the other hand, however, at the enterprise level, it is more difficult to measure, as labor productivity is translated by the ratio of results and number of employees [2]. We take into account, however, as one of the key indicators of the effectiveness of human resource management classics. The general conclusion deduced from the analysis of individual balance sheet statements of SMEs in particular, however, is that only some of them tend to correlate with overall macroeconomic growth range.
Experts observed at the same time some discrepancy between the growth rates of average wages, labor productivity respectively [8]. This can be partly explained by the fact that due to the economic crisis, some of the jobs in enterprises have decreased in number. Remaining employed persons had to take over the duties of employees redundant, hence a working time identical to that of prior periods should be performed multiple tasks [2]. We then discuss general productivity and daily productivity of labor, productivity per hour etc. In addition to issues related to the impact of the crisis on jobs, we can also mention a number of factors adjacent responsible at least in terms of partial productivity index fluctuations. Thus: both technological factors and financial issues, labor market characteristics, or globalization in general [6] make a contribution in managing the workforce of an organization.
Measuring the intensity of action of factors we identify the following influences [2]: 1. Influence of change in the average number of hours worked by an employee:
(1)
1.1. The Influence of change in the average working day
(2)
1.2. The Influence of change in the number of days worked on average per employee (3)
2. Influence of change in the hourly labor productivity
(4)
2.1. The influence of the change in the production
(5) (6) Where:
- hourly labor productivity recalculated based on the structure of production gs- specific weights
- hourly productivity on product
– products
2.2. Influence of hourly productivity change on products:
(7)
Determination of total offense:
(8) (9) (10)
Factors acting on productivity exercises following influences [2]:
- Average number of hours worked by an employee directly determines the change in the level of labor productivity in proportion to the level of the base period hourly labor productivity
- The variation of the average working day determines productivity change through the influence of average hours worked by an employee in direct proportion to the corresponding levels of the base period average number of days worked per employee and hourly labor productivity
- Average number of days worked per employee productivity affect change through the influence of the change in the average number of hours worked by an employee in direct proportion to the level of the base period hourly labor productivity and the duration of the current period average working day . - Changing hourly labor productivity directly affects labor productivity change in proportion to the
- Changes in production structure affects labor productivity change through the influence of hourly labor productivity change in the same direction and proportional to the current period , the average number of hours worked per employee .
- Changes in hourly productivity product generates productivity change through the influence of hourly labor productivity change in direct proportion to the current period , the average number of hours worked per employee .
The labor productivity is mainly influenced by: - Technological and technical level of the company - The organization of operating process
- The quality of the human factor.
The curve of human functioning (Currie) [1] illustrates the situation where an individual is forced to cope with extreme situations in the workplace that reach a high level of importance, urgency and calls for a major involvement and high workload. Currie addresses this problem in terms of pressure which creates a situation of this kind, being known that “human resources are a crucial element in any country’s economy” [5]:
Figure 3 - The human functionality curve Source – Donald Currie [1]
The explanation is that high levels of stress reduce work capacity and productivity default and failure to meet the requirements creates additional stress.
We discuss more extensively in recent years a National Strategy on equality between women and men, the main lines of debate are related to the labor market and education and equality decision. Since the employment rate of the population is lower for women, their salaries also continue to be at lower levels. [8]
According to Eurostat statistics [11], wage differences reach 12% of men and women and the latest trends in the labor market is largely relate to equalize the retirement age, which would draw on the one hand a larger effort by the women, to conduct a weaker longer paid on time.
Pillars that caused major changes in economic life from the perspective of the gender division was the first independent development of women and the feminist movement, but also the reorganization of an entire set of values promoted in society. Women were more motivated to engage in economic life and society structure adapted by adopting new attitudes, promoting and expanding the place and role of women both in the public and private sectors.
Beyond the positive economic consequences, however, results have reflected the socio-cultural environment in general and encouraging affecting demographic measures, laws, regulations or policies. The main challenges that the century especially, seemed to raise insurmountable barriers were solved step- by-step, technology, culture, information is now available to all women benefited from training programs and professional development as well as men.
Stress
The curve of desired performance
tiredness
exhaustion
Health degradation
Physical or menthal breakdown
L
ab
o
r
p
er
fo
rm
an
However, remuneration system requires some adjustments, because you cannot deny the existence of discrepancies in salaries granted, identifying even some rewarding salary inequality on similar tasks performed by persons of the opposite gender. The motivation of women for more active involvement in the life of an enterprise becomes more difficult to meet, how discrimination has not yet been fully eliminated. [7]
3. Overview of wage evolution at national level - the gender criterion
According to statistics provided by specialist publications (Romanian Statistical Yearbook, White Book on SMEs), the situation on number of employees in small and medium enterprises Romanian is the following:
Table 1 - Distribution of the number of employees by size class of SMEs
Employees cathegory
2009 2010 2011
Number of
employees
% Number of
employees
% Number of
employees %
1-9 879.083 34,2 843.482 33,98 826.628 33,04 10-49 841.869 32,8 829.556 33,42 869.689 34,77 50-249 842.986 33 809.468 32,60 805.245 32,19 Total 2.563.933 100 2.482.506 100 2.501.562 100
Source: The White Book of SMEs [8]
We discover therefore a tendency to reduce the number of employees, be it micro or small we refer to, or even the medium ones. Data for the period of 2009-2011 gives us important information, namely the downward trend in the number of employees, the only exception that can be identified being in the case of small enterprises, between the years 2010-2011.
On the other hand, the analysis of average wage levels on fields of activity indicates the situation on remuneration levels, overall and by gender:
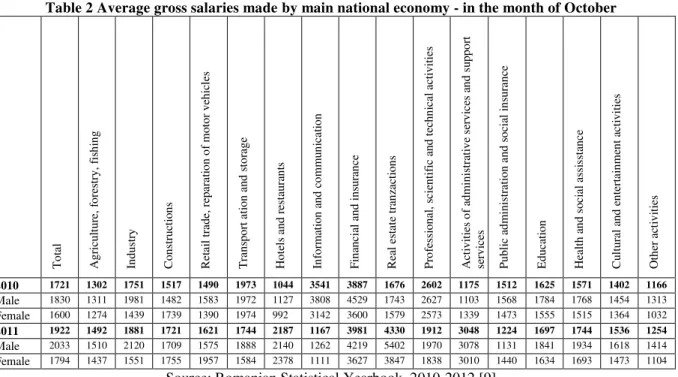
Table 2 Average gross salaries made by main national economy - in the month of October
To ta l A g ri cu lt u re , fo re st ry , fi sh in g In d u st ry C o n st ru ct io n s R et ai l tr ad e, r ep ar at io n o f mo to r v eh ic le s Tr an sp o rt a ti o n a n d s to ra g e H o te ls an d r est au ra n ts In fo rma ti o n a n d c o mm u n ic at io n F in an ci al a n d i n su ra n ce R ea l est at e tr an za ct io n s P ro fe ssi o n al , sc ie n ti fi c an d t ec h n ic al a ct iv it ie s A ct iv it ie s o f ad m in ist ra ti v e ser v ic es an d su p p o rt serv ic es P u b li c ad m in ist ra ti o n a n d s o ci al i n su ra n ce Ed u ca ti o n H ea lt h a n d so ci al a ssi sst an ce C u lt u ra l an d e n te rt ai n me n t ac ti v it ie s O th er a ct iv it ie s
2010 1721 1302 1751 1517 1490 1973 1044 3541 3887 1676 2602 1175 1512 1625 1571 1402 1166 Male 1830 1311 1981 1482 1583 1972 1127 3808 4529 1743 2627 1103 1568 1784 1768 1454 1313
Female 1600 1274 1439 1739 1390 1974 992 3142 3600 1579 2573 1339 1473 1555 1515 1364 1032
2011 1922 1492 1881 1721 1621 1744 2187 1167 3981 4330 1912 3048 1224 1697 1744 1536 1254 Male 2033 1510 2120 1709 1575 1888 2140 1262 4219 5402 1970 3078 1131 1841 1934 1618 1414
Female 1794 1437 1551 1755 1957 1584 2378 1111 3627 3847 1838 3010 1440 1634 1693 1473 1104
Source: Romanian Statistical Yearbook, 2010-2012 [9]
We note that the “total” column above analysis indicates a higher salary level in 2011 over the previous
year. Even though that both male and female, the values recorded are higher gender disparities persist, with women being paid at a lower level than men.
transportation field, where males relating to salary decreases from 1972 lei in 2010 - 1888 lei in 2011, when women first beneficiary of an average salary of 1974 lei, are favored by a major reduction, reaching in 2011 levels of 1584 lei.
Information and communications resorted to massive wage cuts, amounting to an average of 1167 lei from an initial amount of 3541, the structure of inequality are maintained on the basis of gender, but the principle is not promoted in the public administration system, where contrary to the general trend, although we are witnessing a general salary reduction from 1512 lei in 1224, this applies to a lesser extent female employees, maintaining wage levels in this case close to the previous year.
The lowest wage levels in 2010 were those in the financial and insurance field, information and communication, also professional, scientific, where levels are double compared to the rest of specialized areas. Hotels and restaurants were located but the last position on remuneration.
2011 brought twists but in most cases, the first position being held by real estate transactions.
If in 2010, in 90 % of cases there is an enhanced wage inequality to the detriment of women, the year 2011 manages to reduce this percentage, passing women leaders in the following areas: construction, hotels and restaurants, wholesale trade, public administration.
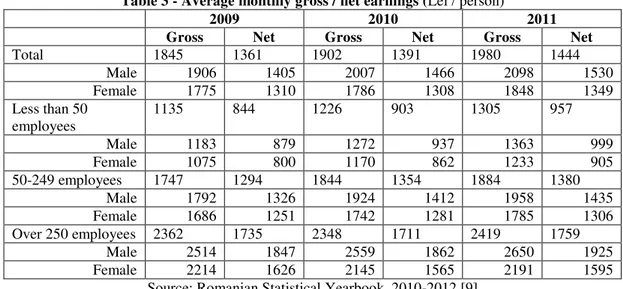
An analysis by size of the company earnings indicates the following conclusions: - The period under review (2009-2011) is characterized by an increase in annual salary ;
- There are notable differences between the salaries of male, female, respectively, these differences are maintained over the entire period;
- Small enterprises, micro offers the lowest wage levels, the highest being found in the case of organizations with over 250 employees;
- Regardless of the category of enterprise are paid female employees at a lower level employees of the opposite gender.
Table 3 - Average monthly gross / net earnings (Lei / person)
2009 2010 2011
Gross Net Gross Net Gross Net
Total 1845 1361 1902 1391 1980 1444 Male 1906 1405 2007 1466 2098 1530 Female 1775 1310 1786 1308 1848 1349 Less than 50
employees
1135 844 1226 903 1305 957
Male 1183 879 1272 937 1363 999 Female 1075 800 1170 862 1233 905 50-249 employees 1747 1294 1844 1354 1884 1380
Male 1792 1326 1924 1412 1958 1435 Female 1686 1251 1742 1281 1785 1306 Over 250 employees 2362 1735 2348 1711 2419 1759
Male 2514 1847 2559 1862 2650 1925 Female 2214 1626 2145 1565 2191 1595
Source: Romanian Statistical Yearbook, 2010-2012 [9]
0 500 1000 1500 2000 2500 2005
2007 2009 2011
2005 2006 2007 2008 2009 2010 2011
Female net wage 689 803 981 1264 1310 1308 1349
Female gross wage 891 1062 1312 1700 1775 1786 1848
Male n et wage 796 922 1095 1348 1405 1466 1530
Male gross wage 1037 1222 1468 1814 1906 2007 2098
Figure 4 - Average monthly gross / net earnings Source: Romanian Statistical Yearbook, 2010-2012 [9]
4. Conclusions
The problem that we wish to bring to attention, however, is that the discrepancies in the gender wage levels are still notable. Today's society has generally managed to eliminate major differences between men and women. Over a fight for centuries ended not without results, gender equality today no longer just a utopian ideal. Beyond this, however, the impact recognition beyond the consequences both positive and negative partially beyond balancing the work done, the social dimension is still marked by a difference in the reward system. This is partly due to the fact that in some areas predominate male employees, while other jobs where women are more numerous, also show a lower level of pay. It is however, important to attentively reduce the gaps and rise the
motivation, as long as the workforce and in generally the human capital, represents “an important factor of economic and social growth and development” [5].
5. References
[1] Currie Donald, Introducere în managementul resurselor umane/Introduction in human resource management, Codecs Publishing House, Bucharest 2009
[2] Lala Popa Ioan, Miculeac Melania, Analiză economico-financiară: elemente teoretice şi studii de caz, ediţie revizuită şi adăugită/ Economical and financial analysis: theoretical elements and case studies, revised edition, Mirton Publishing, Timisoara 2012
[3] Maslow Abraham, Motivatie si afaceri / Motivation and business, Trei Publishing, Bucharest, 2013
[4] Tănase Diana, Role of human capital formation in economic development, Annals of the „Constantin
Brancusi” University of Targu Jiu, Economic Series, Issue 6/2013
[5] Tănase Diana, FranţFlorin, Manciu Venera, Tănase Adrian, Analysis of labour market in Romania and the European Union, „The Annals of the University of Oradea, Economic Sciences” - Tom XXII, 2013, http://anale.steconomiceuoradea.ro/volume/2013/1st-issue-july-2013.pdf
[6] Global Wage Report 2012/2013 Wages and equitable growth, International Labour Organization, Geneva, 2013
[7] European Salary Survey 2013 – European employer pays for the crisis, Delloite, 2013
[8] Carta alba a IMM-urilor/The White Book of SME’S, National Council of Private Small and Medium Sized Enterprises, 2013
[9] National Statistical Romanian Yearbook, The National Commission for Statistics www.insse.ro [10] ***www.oecd.org
[11]*** www.ec.europa.eu/eurostat [12] ***www.revistadestatistica.ro
![Figure 1 - The annual average real wage growth between 2006 - 2011 Source: The Global Wage Report 2013 [6]](https://thumb-eu.123doks.com/thumbv2/123dok_br/18341822.352074/2.892.140.798.302.678/figure-annual-average-growth-source-global-wage-report.webp)
![Figure 3 - The human functionality curve Source – Donald Currie [1]](https://thumb-eu.123doks.com/thumbv2/123dok_br/18341822.352074/4.892.186.755.354.695/figure-human-functionality-curve-source-donald-currie.webp)
![Figure 4 - Average monthly gross / net earnings Source: Romanian Statistical Yearbook, 2010-2012 [9]](https://thumb-eu.123doks.com/thumbv2/123dok_br/18341822.352074/7.892.187.741.84.402/figure-average-monthly-earnings-source-romanian-statistical-yearbook.webp)
