Development Today
Documentation of an International Conference
organized by the Friedrich Naumann Foundation
held in Lisbon, Portugal,
First edition 1988
Copyright by Friedrich Naumann Foundation, Lisbon. Printed in Portugal
All rights reserved - including reprintings of excerpts, photomechanical reproduction, and translation.
The consequences of economic change in the developing countries Prof. Marcos Cintra Cavalcanti de Albuquerque
Director, School of Business Administration, Fundação Getúlio Vargas, São Paulo
To talk about developing countries in today's world implies making generalisations which cannot always be justified. If, in the last cen-tury, or even in the middle of the last cencen-tury, it was relatively easy to classify nations in terms of their respective leveis of economic de-velopment, such practice is made much more difficult nowadays by virtue of the enormous variations to be noted in those cri teria which are usually accepted as indicators of economic progress.
In 1985 the two most heavily populated nations of the world, China and India, had an annual per capita income of US$ 290: in Ethio-pia, this income was no more than US$ llO. In an intermediate posi-tion were to be found countries such as Peru (US$ 1285), Columbia (US$ 1320) and Syria (US$ 1560). After these countries, with a slightly higher levei of income, carne Brazil (US$ 1640), Malaysia (US$ 1288), Portugal (US$ 1970), Venezuela (US$ 3080) and Greece (US$ 3550). Finally, at the top of the pyramid were to be found Is-rael (US$ 4990), Hong Kong (US$ 6230) and Singapore (US$ 7420), with the high income petroleum exporting countries being excluded from this list.
The great disparity in terms of these countries · per capita income, which reaches a ratio as high as 70 to 1 (Singapore and Ethiopia), is even more notable than the r a tio between the G D P of middle income developing countries (approximately US$ 1300) and the average GDP of the free market industrialised economies - US$ l1,810. Even if we take into account the particular case of the USA, where per capita income in 1985 amounted to US$ 16,690, the ration of this latter country's income is not even as high as 13 to 1.
than 30%, whereas the percentage share of the poorest 20% is no more than 7% of that income, in those countries for which statistics are available. In fact, the income of the richest 20% of the popula-tion is frequently 6 or 7 times greater than that of the poorest
20'7o; in Brazil and the Ivory Coast, this indicator of inequality rea-ches such extremes whereby the ratio is dose to 30 to 1 (33:1 and 25:1, respectively). By way of comparison, and according to the fi-gures provided by the W orld Bank, the highest such ratio noted in the free market industrialized economies was one of 8.7% in Austra-lia and New Zealand. In the USA, this ratio was 7.5%; in Sweden, it was 5.6%; and in Japan and Holland 4.3%.
These discrepancies in incomes, further exacerbated by the inequa-lities evident in their distribution, equally give rise to enormous va-riations in social indicators. At the lowest level of developing coun-tries, average life expectancy is approximately 50 years of age (Bhutan 44 years, Ethiopia 45, Pakistan and Bangladesh 51), whe-reas, at the uppermost levei, average life expectancy in severa! countries is more than 70 years of age, a figure which is very dose to the averàge of the free market inudstrialized economies (76 years), as is shown by the following statistics: Brazil 65 years, Me-xico 67, Argentina 70, Uruguay 72 and Portugal 74.
In the poorest countries, the number of students enrolled in secon-dary education amounts to an average of 32% of the appropriate age group (Ethiopia 12%, Burma 24%, India 34% and Zaire 57%; in the middle income developing countries, this figure reaches an ave-rage of 56% (Brazil 35%, Portugal 47%, Mexico 55% and Greece 82%). For the free market industrialised economies, the figure is 90%. Per capita energy consumption, measured in kilograms of coal per year, is 692 kg in Equador and 3,029 kg in Venezuela. Only 50% of people living in Mexico have running water in their homes, whe-reas in U ruguay the corresponding figure is 81 %.
had a per capita income that was higher than those
?f
J ap~n and a number of European countries, and African countnes wh1ch have never managed to overcome the most abject poverty? In the first decades of this century, Argentina had a per capita income that was equivalent to that of France. Today this income is lower than those of Spain and Greece and equivalent to that of Korea.In 1960, per capita income in Uruguay and Venezuela was higher than in Italy, Spain and Japan; in Argentina, it was three times higher than in Korea, and in Chile it was very elo se to that of Spain and higher than in Portugal and Greece. However, by 1985, the highest per capita incomes in Latiu America were no greater than US$ 2,800, whereas per capita income in Korea had risen to US$ 2,648, in Japan to US$ 7,130, in Italy to US$ 4,808, in Spain to US$ 4,336, in Singapore to US$ 5,000 and in Formosa to US$ 3,160.
At the same time serious discontinuities have been noted in the eco-nomic evolution of developing countries. The evident tendency to-wards economic stagnation in several countries, as is the case for example in certain African nations, in Asia and in Latiu America, contrasts very sharply with the meteoric explosion in terms of eco-nomic growth noted in J apan and other Asian countries such as Singapore, Korea, Taiwan and Hong Kong. In the middle of these two extremes, one finds the cases of the Latiu American economies, which showed signs of a certain dynamism until the end of the 1960s, but then, with the possible and still rather uncertain excep-tion of Brazil, have spent the last twenty years confronted with an economic stagnation that threatens to become chronic and conse-quently more and more difficult to overcome.
In the face of such diversities, how should one begin to point out the necessary path to economic development?
What is expeected from the developed countries
bil-lion. Playing, as they do, such an important role in the generation of goods and services worldwide, the economic policies adopted by the industrialized countries have now become an essential factor in de-termining the evolution and progress of the poor countries. In its most direct form, the inter-relation between development and underdevelopment occurs by means of two major channels- inter-national trade and externai savings. In as much as the evolution of these two elements depends on the evolution of the economic growth of rich countries, the economic development of poor coun-tries is also inextricably bound up with the performance of the ma-jor economies of Europe, Japan and the USA. Consequently, the continued economic growth of the high income industrialized econo-mies is a necessary condition for any effort being made towards an intensification of economic growth in the developing countries.
Between 1965 and 1973, the average annual growth rate of the free market industrialized countries was 4. 7% per year; between 1973 and 1980 this rate fell to 2.8%. In 1984, there was a growth rate of 4.6%, but immediately afterwards it returned once more to the ge-neral pattern of the last fifteen years, being 2.8% in 1985 and 2.5% in 1986. During this same period, the average annual growth rate of Third World countries fell from 6.5% between 1965 and 1973 to 5.4% between 1973 and 1980. In keeping with the pattern noted in the richer economies, average growth in 1984 reached a levei of 5.1%, thereafter falling in 1985 and 1986 to 4.8% and 4.2':1a respectively.
There is therefore a powerful correlation to be noted between the two trends in growth rates, which is clear evidence of the existing connections between the rich and the poor countries of the world.
The first link between the two is that of international trade. Appro-ximately two thirds of exports from developing countries go to the industrialized economies, whereas roughly 70% of the exports from rich countries are distributed amongst these countries themselves. The assymetry of this situation is glaringly obvious. The develo-ping countries depend essentially on imports from the industriali-zed countries, whereas only 25% of the latter's exports are destined for the former. (See Table 1).
trade which first started after the Second W orld W ar. Internatio-nal
a~eements
on tariff reductions did not spread to agricultura! produce and industrial goods exported by developing countries to the same extent as they did to exports from industrialized coun-tries. And the world recession of 1974-1975 led to a new wave of protectionism in the industrialized countries, which thus implied the use of new instruments such as price controls, quality controls, «voluntary» limitations and other types of restrictions.The important thing that should be stressed, however, is that this neo-protectionist movement most seriously affected the developing countries, and Latin America in particular. In 1984, almost 21% of the industrialized countries' imports from Third W orld countries were subject to non-tariff restrictions, as opposed to 11.3% of the products of the rich countries.
If the economic growth of the poor countries is to be sustained, there are some basic requirements that need to be met:
a) an average growth rate of at least 3'1o per year in the industriali-zed economies;
b) a greater opening up of the markets of the industrialized coun-tries to goods from the developing councoun-tries, principally though a reduction in protectionism, whether veiled or explicit;
c) a greater stability in the exchange rates of the currencies of the developed countries.
It is generally agreed that, if these objectives - important not only for the stability of the developed countries, but also for stimulating the economic growth of the poor countries- are to be reached, the USA needs to establish a fresh equilibrium between its fiscal and monetary policies, by reducing the level of its internai demand and consequently its budget and trade deficits. At the same time, it is the task of the more dynamic countries, such as Germany and Ja-pan, to expand their economies in such a way as to help maintain the objective of a minimum average growth rate of 3% per year for the rich nations as a whole.
the stock market to become transformed into a worldwide depres-sion. The speedy reaction of the North American government in ra-pidly expanding the liquidity of its economy - and thus avoiding repeating the rnistakes made in 1929, when there was a movement in the opposite direction which served only to deepen the recession - may help to avoid an even greater slump in the world economy. At the same time, however, this policy option will probably bring about a run on the dollar, with all the disadvantages that this en-tails.
TABLE 1:
ORIGIN AND DESTINATION OF EXPORTED GOODS (as percentage of total at origin)
Free Market High Income
Destination Industrialized Petroleum· Developing
Others
Economies exporting Countries Countries
Origin 1965 1985 1965 1985 1965 1985 1965 1985
Low income 52 4 41 4
Lower middle income 74 71 1 2 20 25 5 2
Higher middle income 64 62 (.) 2 26 30 10 6
High-Income
Petroleum-exporting countries 70 59 3 1 27 40 (.) (.)
Developing countries 67 63 1 2 25 30 8 7
Exporters of manufactured
goods 52 53 1 3 28 35 19 9
Countries heavily in debt 74 71 (.) 1 21 22 5 6
Free market industrialized
economies 70 71 1 3 27 24 2 2
Argentina Brazil Mexi co Venezuela Guatemala Nigeria Zair e In dia Korea Philippines Algeria Yugoslavia
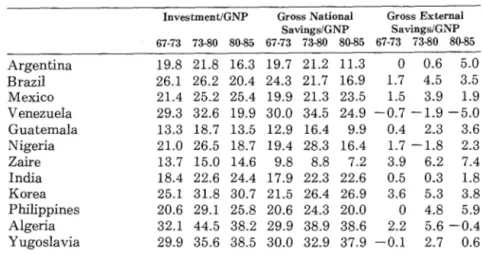
TABLE 2: SAVINGS AND INVESTMENT (o/o of GNP) - 1965/1985
Investment/GNP Gross National Gross Externai
Savings/GNP Savings/GNP
67-73 73-80 80-85 67-73 73-80 80-85 67-73 73-80 80-85
19.8 2L8 16.3 19.7 2L2 1L3
o
0.6 5.0 26.1 26.2 20A 24.3 2L7 16.9 L7 4.5 3.5 2L4 25.2 25A 19.9 2L3 23.5 L5 3.9 L9 29.3 32.6 19.9 30.0 34.5 24.9 -0.7 -L9 -5.0 13.3 18.7 13.5 12.9 16.4 9.9 0.4 2.3 3.6 2LO 26.5 18.7 19A 28.3 16.4 L7 -L8 2.3 13.7 15.0 14.6 9.8 8.8 7.2 3.9 6.2 7A 18A 22.6 24A 17.9 22.3 22.6 0.5 0.3 L8 25.1 3L8 30.7 2L5 26.4 26.9 3.6 5.3 3.8 20.6 29.1 25.8 20.6 24.3 20.0o
4.8 5.9 32.1 44.5 38.2 29.9 38.9 38.6 2.2 5.6 -OA 29.9 35.6 38.5 30.0 32.9 37.9 -0.1 2.7 0.6Source: W orld Bank
Differences in the patterns of growth
There is, however, one historical fact relating to international trade which immediately calls our attention: the contrast between those developing countries whose activity is geared towards foreign mar-kets- the exporters of manufactured goods- and that group of countries which are heavily in debt. The former countries have more diversification in their exports, with only half of them directed at the developed countries. Those countries which are in serious debt, however, have more than 70% of their exports concentrated in tho-se same markets. On account of the interest repayments that they are forced to make, this group of countries is obliged to generate large trade surpluses in strong currencies and consequently finds it-self much more dependent on the markets of the developed coun-tries.
Those developing countries which are exporters of manufactured goods maintained an average growth rate of 7.4% between 1965 and 1973 and one of 6% between 1973 and 1980 (in contrast to the average growth rates for the developing countries as a whole of 6.5% and 5.4% respectively). Those countries which are in serious debt managed to achieve growth rates of 6.9% and 5.4(/"o respecti-vely, in other words ones which were very dose to the overall avera-ge for the poor countries. As from 1982, however, with the crisis in internationalliquidity, the major exporting countries sustained an average growth rate of 6.3% until 1986, as against 0.75% for the countries with serious foreign debts.
There is no doubt that the externai adjustments that were imposed on the countries in serious debt were brutal. The 1980s have already been called the «lost decade» in terms of economic growth, and, for those countries and their populations which are beset by poverty (in some cases by misery and starvation), the loss of an entire decade may welllead to frustration and revolt, with unforeseeable social and political consequences.
It is totally unnecessary to go into great detail about the foreign debt crisis. It will be enough to say that, between 1970 and 1985, the percentage of the Gross National Product of developing coun-tries spent on servicing the State's foreign debt increased from 1.5% to 4.3%. In the specific case of those countries most heavily in debt, the figures are 1.6% and 5.1% respectively; whereas, in those countries which are exporters of manufactured goods, the respecti-ve amount increa$ed from 1.2% to only 2.7%. Certainly the situa-tion is even more distressing if one also includes private debts.
The impact of the foreign debt crisis has forced those countries in debt to make a sharp cutback in their investment programmes. Without the possibility of fresh inputs o f foreign resources e ver since the beginning of the decade, these countries have been suddenly transformed into net exporters of capital, with its obviously harm-ful repercussions on the supply of savings and thus on the rates of capital formation and economic growth.
sa-vings (see Table 2). This trend is certainly getting worse. It is there-fore of the utmost necessity that the rich countries make a genuine effort to prevent real foreign interest rates from reaching levels hig-her than the historie ceiling of 3%. Furthig-hermore, if the alarming stranglehold that foreign countries have over most developing eco-nomies is to be overcome, then it is urgent that the flows o f loan and risk capital, which underwent a sudden paralysis during the 80s, should be given fresh impetus.
Without the commitment of the industrialized economies to main-. taining an adequa te growth rate, a firm policy of opposition to the
spread of protectionism, and, more than anything else, coordinated fiscal and monetary measures capable of reducing interest rates and stabilising exchange rates, it will be extremely dificult for the developing countries to reach even the minimum conditions neces-sary for embarking on a new process of growth. In its turn, the fo-reign debt crisis will continue to haunt the international financia! community, rendering unviable those mechanisms used for the fi-nancing of the economic growth of the developing countries.
Growth options
One of the important things to be discovered is whether all the evils and contraditions which beset the underdeveloped countries are in fact originated by the behaviour of the industrialized nations. Is un-derdevelopment the necessary counterpart of the development of the industrialized countries? It is true that the developing econo-mies are victims of an economic system which is by its verynature perverse?
The model for development adopted by those countries in the Paci-fic area which are exporters of manufactured goods has become a new paradigm for growth; it is like a new orthodoxy which has ari-sen in answer to the old recipes of CEPAU which had such an in-fluence on economic planners in the first post-war decades.
The old orthodoxy proclaimed the need for import substitution at all costs, and industrialization was taken as being a renewed hope for prosperity. For these goals to be obtained, it was justifiable for the economies to be geared towards their own markets and for the new productive sectors to benefit from trade barriers which could protect them against foreign competition. At the same time, given the limited financiai and management resources of a bourgeoisie that was only just beginning to emerge, ideal conditions were crea-ted for the emergence of a strong State capable of introducing into these economies manufacturing activities which were considered to be modern, while furthermore carrying out the heavy investments in infrastructures needed to support the new process of industriali-zation. In this inward-looking model, the State was to play the role of the major economic agent, by simultane,ously performing the functions of producer, supplier and regulator of the economy.
1 CEPAL = Comisión Económica para América Latina, This is also referred to in
English as ECLAC = Economic Commission for Latin America and the Caribbean.
It should be pointed out that, by the middle of this century, econo-mists had already begun to understand that the evolution of mo-dem capitalism would be different from that suggested by the clas-sical concepts. The structure and relationships of power and depen-dence between the rich countries on the one hand and the underde-veloped countries on the other called for -government action to try and preventa disequilibrium of forces that threatened to perpetua-te a disadvantageous inperpetua-ternational division of labour. The produc-tion and distribuproduc-tion of goods took place within the framework of a market structure characterised by evidence of a certain concentra-tion, thus making government participation an essential factor in the defence of national interests.
pro-cess of economic growth. As we have seen, this movement showed signs of being capable of bringing the values of the per capita inco-me of certain Latiu Ainco-merican countries closer to those exhibited by the developed economies of Europe. It seemed as though the formu-la for worldwide economic progress had finally been found.
Initially, it was seen as the job of the State to generate the appro-priate means for the financing of this effort towards industrializa-tion, either by means of internai savings or through the manage-ment of income transfers from those sectors which had available sa-vings to those which were badly lacking in resources. In its second phase, the process was continued on the basis of loans granted by the commercial banks, which were eager to recycle their petrodol-lars.
This model of development enabled the most important Latiu Ame-rican countries to attain a reasonable levei of industrialization du-ring the 1950s. After the substitution of imported consumer goods, a more arduous process of industrialization was started in the areas of intermediate goods and consumer durables, and more recently in the fields of capital goods and basic consumer goods.
The increasing and quite natural difficulties required these coun-tries to adopt an increasingly more closed and concentrated model, if they were to obtain economies of scale, and an increasingly more State-run economy. As a result, these economies have emerged in the 1980s showing signs of great fragility in regard to their possibi-lities of international competition. The heavy protection that they have been given has given rise to inefficient industrial sectors which are heavily subsidised and very poor in terms of technology. In essence, they lack the necessary confrontation with the market.
In sharp contrast to this growth model, a new orthodoxy appeared at the beginning of the 1970s, based on the experience of the «Asian tigers>>.
The opening up of the economy to foreign markets, respect for the rules of the free market, and the fundamental emphasis on private enterprise, are the mainstays of this new model of development, whose success has been proved by the economies of countries such as Japan, Singapore, Hong Kong, Taiwan and Korea. As we have already seen, these countries have, in the last few decades, shown substantially higher growth rates than those of the Latin American economies, and they have managed quite rapidly to outmatch the per capita GDPs of those countries which chose to follow the altena-tive path of giving preference to the domestic market.
The Asian countries succeeded in obtaining international finance, but the recent liquidity crisis has not affected them anywhere near as much as it has the other regions of the world. Even during pe-riods of crisis, these countries have continued to invest in export-oriented sectors. They have thus managed to generate sufficient earnings in foreign currency to be able to meet their foreign com-mitments without needing to make any greater internai adjust-ments.
Is should be remembered that certain countries, notably Brazil, adopted strategies that were a mixture of the import substitution model and the export-oriented one. However, attempts to liberalize the economy did not have the same continuity or consistency as did the Asian economies.
trade and the exchange rate dating back to 1949 gave the govern-ment a monopoly of the purchase of foreign currency and made it the only lawful source of such currency. Unwritten laws governed its distribution. Bureaucrats allocated this money to the more fa-voured sectors, giving most attention to priva te companies, in who-se growth they had a special interest. The internai capital market was highly controlled and completely isolated from the internatio-nal markets. Direct foreign investment was severely limited and majority shareholdings by foreign companies were banned both le-gally and administratively. From the beginning to the middle of the 1960s, approximately one third of externai funds for industrial in-vestment originated from loans from government financiai tions, at subsidised rates of interest. These government institu-tions continued to be an important source of cheap finance until the end of the 1960s. Would anyone care to hazard a guess as to the na-me of this country? It is in fact Japan.
Consider further the high levei of Japanese state intervention in the question of the organization of foreign trade and of the support gi-ven to export-oriented sectors; consider also the efforts ma de by the Koreans in creating their enormous trading companies; consider the importance of the state sector in Taiwan and Korea, which is equivalent to 35% and 25% respectively of those countries' gross capital formation; consider the role played by the Korean govern-ment in setting up that country's iron, steel, chemical and other in-dustries; consider the transfers of US dollars which financed a large part of Taiwan's and Korea's imports between 1955 and 1959.
In fact, if we consider all these factors, it will be noticed that the li-beralizing I export-oriented model followed by the Asian countries is very similar to the import substitution model adopted by the La-tin American countries, with a major role being played by an inter-ventionist State. This model has nothing to do with the one of free competition and economic liberalism that people are trying to asso-ciate nowadays to the growth model of the Asian exporters.
intervention was certainly not one of the most noticeable differen-ces between the two growth models analysed here. It should further be recognised that the nature of this State intervention was diffe-rent, since in the Far Eastern countries all economic policy measu-res always ended up being subjected to the test of the foreign mar-ket.
What lessons are to be drawn from this brief analysis of these two aptterns of development?
It can be seen that the phase of import substitution, with greater emphasis being given to the domestic market and characterised by the indispensable intervention of the government, is a stage through which all the higher income developing countries passed, to a greater or lesser extent. In this way, one cannot deny the im-portance of both state intevention and the promotion of import substitution in those low income countries which still need to begin the process of structural transformation.
On the other hand, it must be admitted that, once this first stage had been completed, the Latin American countries then pursued a growth policy which soon found itself, and still finds itself, coming to an abrupt halt, while the economies of those Asian countries which are exporters of manufactured goods have shown the neces-sary flexibility and capacity for change, which have helped them to achieve remarkable rates of economic growth.