Cancer Susceptibility: A Meta-Analysis Involving 43,626
Subjects
Weifeng Tang
1☯, Hao Qiu
2☯, Hao Ding
3☯, Bin Sun
1, Lixin Wang
2, Jun Yin
1*, Haiyong Gu
1*1 Department of Cardiothoracic Surgery, Affiliated People’s Hospital of Jiangsu University, Zhenjiang, China, 2 Department of Microbiology and Immunology, Medical School of Southeast University, Nanjing, China, 3 Department of Respiratory Disease, Affiliated People’s Hospital of Jiangsu University, Zhenjiang, China
Abstract
The association between the Serine/threonine kinase 15 (STK15) F31I polymorphism (rs2273535) and cancer susceptibility remains controversial. To further investigate this potential relationship, we conducted a comprehensive meta-analysis of 27 published studies involving a total of 19,267 multiple cancer cases and 24,359 controls. Our results indicate statistical evidence of an association between the STK15 F31I polymorphism and the increased risk of overall cancer in four genetic models: AA vs. TA+TT, AA vs. TT, AA vs. TA, and A vs. T. In a stratified analysis by cancer type, there was an increased risk of breast cancer in four genetic models: AA vs. TA+TT, AA vs. TT, AA vs. TA, and A vs. T, as well as esophageal cancer in two genetic models: AA vs. TA+TT and AA vs. TA. In a stratified analysis by ethnicity, there was a significant increase in cancer risk among Asians, but not Caucasians, in four genetic models: AA vs. TA+TT, AA vs. TT, AA vs. TA and A vs. T. In addition, a stratified analysis by ethnicity in the breast cancer subgroup revealed a significant increase in cancer risk among Asians in two genetic models: AA vs. TA+TT and AA vs. TT, as well as among Caucasians in one genetic model: AA vs. TA. In summary, this meta-analysis demonstrates that the STK15 F31I polymorphism may be a risk factor for cancer.
Citation: Tang W, Qiu H, Ding H, Sun B, Wang L, et al. (2013) Association between the STK15 F31I Polymorphism and Cancer Susceptibility: A Meta-Analysis Involving 43,626 Subjects. PLoS ONE 8(12): e82790. doi:10.1371/journal.pone.0082790
Editor: Hiromu Suzuki, Sapporo Medical University, Japan
Received July 31, 2013; Accepted October 28, 2013; Published December 13, 2013
Copyright: © 2013 Tang et al. This is an open-access article distributed under the terms of the Creative Commons Attribution License, which permits unrestricted use, distribution, and reproduction in any medium, provided the original author and source are credited.
Funding: This study was supported by Jiangsu University Clinical medicine science and technology development fund (JLY20120004). The funders had no role in study design, data collection and analysis, decision to publish, or preparation of the manuscript.
Competing interests: The authors have declared that no competing interests exist. * E-mail: yin912@126.com (JY); haiyong_gu@hotmail.com (HG)
☯ These authors contributed equally to this work.
Introduction
Cancer is a complex disease that results from interactions between multiple genetic and environmental factors [1-3]. A characteristic of cancer is genetic instability, which can be caused by transgenation and acquired aneuploidy [4]. Genetic instability mostly occurs at the chromosomal level, including losses and gains of whole or large portions of chromosomes [5]. Chromosomal segregation is accomplished by the mitotic spindle, which links whole chromosomes to opposite poles of the cell, and segregates the duplicated DNA equally into two daughter cells [6]. In mammalian cells, centrosomes are the major microtubule organizing centers (MTOC) and play a vital role in symmetrical mitotic spindle formation and mitosis. Serine/threonine kinase 15 (STK15), a centrosome-localized serine/threonine kinase, acts as a critical regulator of mitotic centrosome maturation and spindle assembly. It has a particular role in G2 to M phase, primarily through its
phosphorylation functions, and plays an important role in the development and progression of cancer malignancy [7].
A non-synonymous single nucleotide polymorphism (SNP) of
published to date. To the best of our knowledge, this is the most comprehensive meta-analysis regarding the STK15 F31I polymorphism and its association with cancer risk.
Materials and Methods
This meta-analysis is reported according to the Preferred Reporting Items for Systematic Reviews and Meta-analyses (PRISMA) guideline (Table S1. PRISMA checklist) [12].
Search Strategy
Genetic association articles published on cancer and the
STK15 F31I polymorphism, up to May 29, 2013, were investigated by searching PubMed, EMBASE, CBM (Chinese BioMedical Disc) and CNKI (Chinese National Knowledge Infrastructure) with combinations of the following terms: "stk15", "Aurora-A", "BTAK", "AIKI", "polymorphism", "SNP", "mutation", "carcinoma", "cancer", "neoplasm", and "malignance". In addition, the publication language was restricted to English and Chinese. All bibliographies listed in these studies and published reviews were checked for original and relevant studies.
Inclusion and Exclusion Criteria
Eligible studies had to meet the following criteria: 1) evaluated the STK15 F31I polymorphism and cancer risk, 2) designed as a case-control study, 3) provided data on genotype or allele frequency in case groups and control groups, 4) provided the genotyping method and ethnicity, and 5) control genotype distributions consistent with Hardy-Weinberg equilibrium (HWE). Exclusion criteria included the following: 1) overlapping data, 2) not case-control studies, and 3) review publication.
Data Extraction
Information from all eligible publications was carefully and independently extracted through three reviewers (W. Tang, H. Qiu, and H. Ding). In case of conflicting evaluations, differences were resolved by further discussion among all reviewers. For each included study the following data was extracted: first author, cancer type, year of publication, country, ethnicity of study subjects, number of cases and controls, genotype method, allele and genotype frequency, and HWE in controls.
Statistical Analysis
Deviation from the HWE among the controls was evaluated for each single study using an internet-based HWE calculator (http://ihg.gsf.de/cgi-bin/hw/hwa1.pl). The crude odds ratio (OR) with the corresponding 95% confidence intervals (95% CI) was used to measure the strength of the association between the STK15 F31I polymorphism and cancer risk. The significance of the pooled OR was assessed using the Z-test and P-value (two-tailed), and P<0.05 was considered statistically significant. In our study, a Chi-square-based I2 test
was used to check potential heterogeneity among studies; I2<25% indicated low heterogeneity, 25%≤I2≤50% indicated
moderate heterogeneity, and I2>50% indicated large
heterogeneity [13]. The heterogeneity was considered statistically significant at I2>50% or P<0.10. If heterogeneity
existed, the pooled ORs were calculated according to the random-effects model (the DerSimonian–Laird method) or the fixed-effects model was used (the Mantel–Haenszel method). Subgroup analyses were conducted according to ethnicity and cancer type to measure ethnicity-specific and cancer type-specific effects (any cancer type evaluated by less than three individual case-control studies was combined into "other cancers"). Sensitivity analysis was also carried out to determine whether any excluded studies affected the stability of our results. Galbraith radial plot and further stratified analyses were used to analyze the source the heterogeneity. In our studies, the funnel plot and Egger’s test were used to assess potential publication bias, which was measured by visual inspection of an asymmetric plot. In addition, for the interpretation of Egger’s test, statistical significance was defined as P<0.05. Statistical analyses were performed using STATA (v12.0) statistical software.
Results
Characteristics
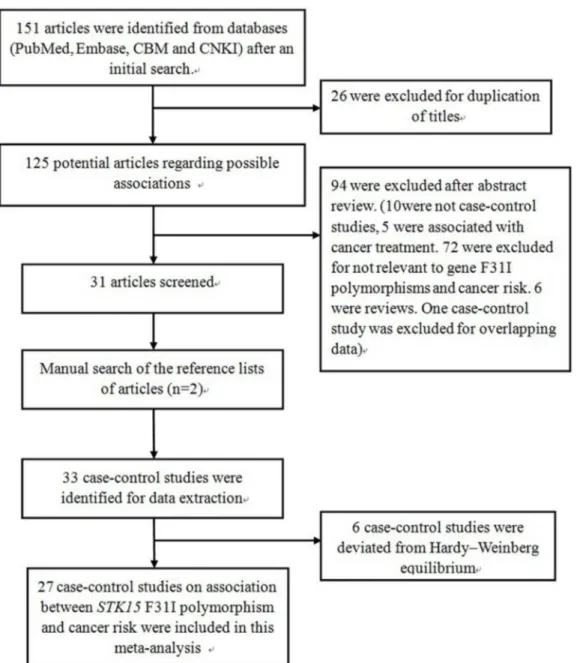
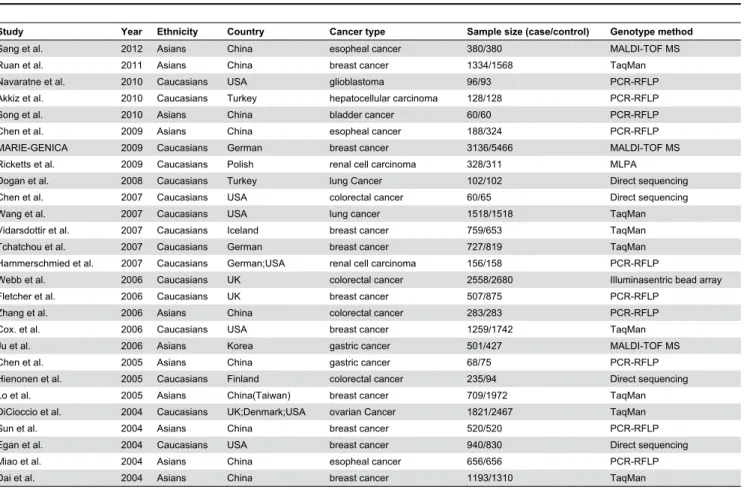
After an initial search, a total of 151 published articles relevant to the topic were identified from databases (PubMed, Embase, CBM and CNKI). With additional filters, 120 of these articles were excluded (26 for duplication of titles, 10 for not being case-control studies, five for an association with cancer treatment, 72 for irrelevance to gene polymorphisms and cancer, six reviews and one case-control study for overlapping data). After this step, 31 qualified and original papers fit the inclusion criteria. After a manual search of the bibliography lists from retrieved articles, another two articles were included (Figure 1). Afterwards, six case-control studies were excluded because the number of genotypes in the control group statistically deviated from HWE. Overall, 27 total case-control studies on the association between the STK15 F31I polymorphism and cancer risk were recruited in this meta-analysis. Among the 27 case-control studies, ten investigated breast cancer [8,9,14-21], four investigated colorectal cancer [10,22-24], and three investigated esophageal cancer [11,25,26]. The other studies investigated gastric cancer, lung cancer, renal cell carcinoma, bladder cancer, glioblastoma, hepatocellular carcinoma, and ovarian cancer [27-36]. As for subjects in these studies, 11 were Asian [9,11,19-21,23,25-29] and 16 were Caucasian [8,10,14-18,22,24,30-36]. Characteristics of populations and cancer types in each individual study recruited in the meta-analysis are listed in Table 1. The distribution of the STK15 F31I polymorphism and allele among patients and controls is listed in Table 2. Results of the meta-analysis from different comparative genetic models are summarized in Table 3, Table 4, and Table 5.
Quantitative Synthesis
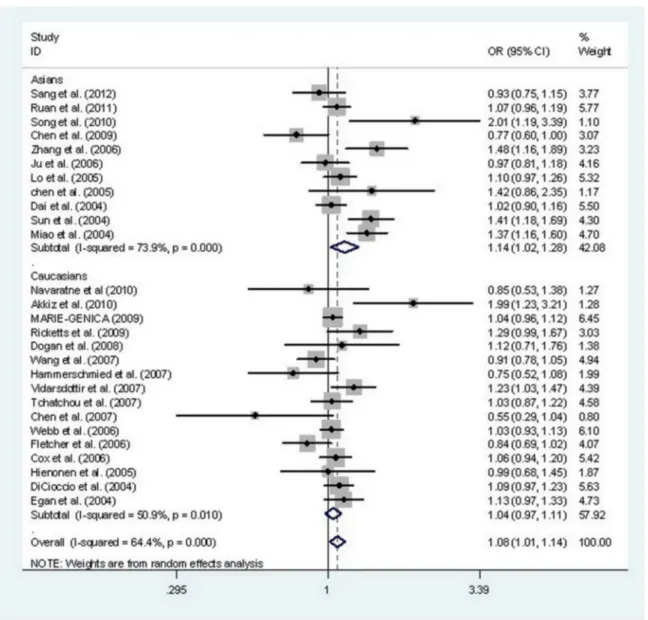
STK15 F31I polymorphism and cancer risk. Divided by ethnicity, 11 case-control studies were focused on Asian subjects and 16 case-control studies focused on Caucasian subjects. After combining all qualified studies, there was statistical evidence of an association between the STK15 F31I polymorphism and increased overall cancer risk in four genetic models: AA vs. TA+TT (OR, 1.18; 95% CI, 1.06–1.31;
P=0.002), AA vs. TT (OR, 1.16; 95% CI, 1.01–1.32; P=0.035), AA vs. TA (OR, 1.18; 95% CI, 1.06–1.30; P=0.001), and A vs. T (OR, 1.08; 95% CI, 1.01–1.14; P=0.015) (Table 3, Figure 2). In a stratified analysis by cancer type, there was an increased risk of breast cancer in four genetic models: AA vs. TA+TT (OR, 1.20; 95% CI, 1.05–1.37; P=0.007), AA vs. TT (OR, 1.22; 95% CI, 1.10–1.35; P=0.000), AA vs. TA (OR, 1.19; 95% CI,
1.04–1.36; P=0.011), and A vs. T (OR, 1.08; 95% CI, 1.01– 1.15; P=0.017) and of esophageal cancer in two genetic model: AA vs. TA+TT (OR, 1.28; 95% CI, 1.08–1.53; P=0.005) and AA vs. TA (OR, 1.32; 95% CI, 1.10–1.58; P=0.003) (Table 4). In a stratified analysis by ethnicity, significant increases in cancer risk were observed for Asians, but not Caucasians, for four genetic models: AA vs. TA+TT (OR, 1.27; 95% CI, 1.10–1.47;
P=0.001), AA vs. TT (OR, 1.26; 95% CI, 1.01–1.56; P=0.039), AA vs. TA (OR, 1.28; 95% CI, 1.12–1.47; P=0.000) and A vs. T (OR, 1.14; 95% CI, 1.02–1.28; P=0.023) (Table 3). In addition, in a stratified analysis by ethnicity in the breast cancer subgroup, significant increases in cancer risk were observed among Asians for two genetic models: AA vs. TA+TT (OR, 1.23; 95% CI, 1.00–1.50; P=0.049) and AA vs. TT (OR, 1.21;
Figure 1. Flow diagram of articles selection process for STK15 F31I polymorphism and cancer risk meta-analysis.
95% CI, 1.01–1.45; P=0.037), as well as among Caucasians in one genetic model: AA vs. TA (OR, 1.14; 95% CI, 1.00–1.29;
P=0.042) (Table 5).
Tests for Publication Bias, Sensitivity Analyses, and Heterogeneity
In this meta-analysis, Begg’s Funnel plot and Egger’s test were both conducted to assess publication bias (Figure 3). The shape of funnel plot showed the evidence of funnel plot symmetry in all the genetic model. The results indicated that there were no publication bias for overall cancer in current meta-analysis (A vs. T: Begg’s test P=0.802, Egger’s test
P=0.553; AA vs. TT: Begg’s test P=1.000, Egger’s test
P=0.938; TA vs. TT: Begg’s test P=0.532, Egger’s test
P=0.509; AA+TA vs. TT: Begg’s test P=0.900, Egger’s test
P=0.856; AA vs. TT+TA: Begg’s test P=0.739, Egger’s test
P=0.784; AA vs. TA: Begg’s test P=0.802, Egger’s test
P=0.585).
Sensitivity analyses were conducted to evaluate the influence of each individual dataset on the pooled OR by deleting each particular dataset dropped at a time. The
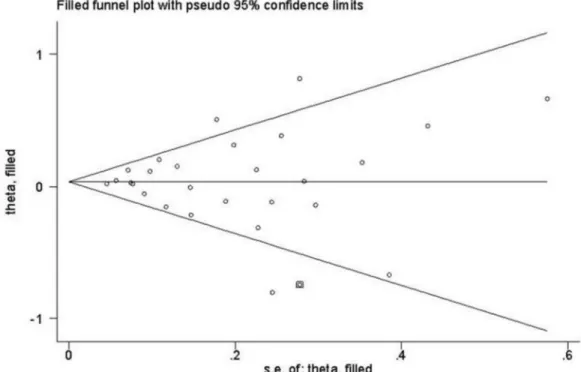
statistical significances of the overall results did not alter when any individual study was omitted, confirming the stability of the results (Figure 4). Trim and fill method was also used to perform sensitivity analyses. The findings showed the results of this meta-analysis were reliable (Figure 5).
The results showed there were large heterogeneities among the studies enrolled. Because tumor origin and ethnicity can influence the results from meta-analyses, we performed subgroup analyses by cancer type and ethnicity (Table 3 and Table 4).The results indicated that esophageal cancer, colorectal cancer, Asian population subgroup may contribute to the heterogeneity. As shown in Table 3, heterogeneity was significant in allele comparison. Galbraith radial plot also was used to analyze the heterogeneity in allele comparison (Figure
6). The results identified eight outliers which might contribute to the major sources of heterogeneity. Further stratified meta-analysis suggested an association of studies published after 2006, conducted in Chinese population and small sample size design (≤1000 subjects) with more prominent heterogeneity (data not shown).
Table 1. Characteristics of populations and cancer types of the individual studies included in the meta-analysis.
Study Year Ethnicity Country Cancer type Sample size (case/control) Genotype method
Sang et al. 2012 Asians China esopheal cancer 380/380 MALDI-TOF MS
Ruan et al. 2011 Asians China breast cancer 1334/1568 TaqMan
Navaratne et al. 2010 Caucasians USA glioblastoma 96/93 PCR-RFLP
Akkiz et al. 2010 Caucasians Turkey hepatocellular carcinoma 128/128 PCR-RFLP
Song et al. 2010 Asians China bladder cancer 60/60 PCR-RFLP
Chen et al. 2009 Asians China esopheal cancer 188/324 PCR-RFLP
MARIE-GENICA 2009 Caucasians German breast cancer 3136/5466 MALDI-TOF MS Ricketts et al. 2009 Caucasians Polish renal cell carcinoma 328/311 MLPA
Dogan et al. 2008 Caucasians Turkey lung Cancer 102/102 Direct sequencing Chen et al. 2007 Caucasians USA colorectal cancer 60/65 Direct sequencing
Wang et al. 2007 Caucasians USA lung cancer 1518/1518 TaqMan
Vidarsdottir et al. 2007 Caucasians Iceland breast cancer 759/653 TaqMan Tchatchou et al. 2007 Caucasians German breast cancer 727/819 TaqMan Hammerschmied et al. 2007 Caucasians German;USA renal cell carcinoma 156/158 PCR-RFLP
Webb et al. 2006 Caucasians UK colorectal cancer 2558/2680 Illuminasentric bead array
Fletcher et al. 2006 Caucasians UK breast cancer 507/875 PCR-RFLP
Zhang et al. 2006 Asians China colorectal cancer 283/283 PCR-RFLP
Cox. et al. 2006 Caucasians USA breast cancer 1259/1742 TaqMan
Ju et al. 2006 Asians Korea gastric cancer 501/427 MALDI-TOF MS
Chen et al. 2005 Asians China gastric cancer 68/75 PCR-RFLP
Hienonen et al. 2005 Caucasians Finland colorectal cancer 235/94 Direct sequencing
Lo et al. 2005 Asians China(Taiwan) breast cancer 709/1972 TaqMan
DiCioccio et al. 2004 Caucasians UK;Denmark;USA ovarian Cancer 1821/2467 TaqMan
Sun et al. 2004 Asians China breast cancer 520/520 PCR-RFLP
Egan et al. 2004 Caucasians USA breast cancer 940/830 Direct sequencing
Miao et al. 2004 Asians China esopheal cancer 656/656 PCR-RFLP
Dai et al. 2004 Asians China breast cancer 1193/1310 TaqMan
MALDI–TOF MS: Matrix-Assisted Laser Desorption/Ionization Time of Flight Mass Spectrometry PCR-RFLP: polymerase chain reaction-restriction fragment length polymorphism
Discussion
Accumulating evidence suggests environmental factors, genetic components, and gene–environment interactions play important roles in cancer development and progression [37-42]. Recently, a growing interest in the associations between genetic polymorphisms and cancer risk has led to increasing studies on tumor etiology. Many studies have linked tumor development and progression to the amplification and overexpression of STK15 in multiple human cancers (such as breast cancer, colorectal cancer, esophageal cancer, as well as other types of cancer) [43-46]. The STK15 F31I polymorphism has been extensively investigated, and many studies have examined the hypothesis that this polymorphism is relevant to the risk of a variety of cancers; however, the results remain inconclusive and ambiguous. Therefore, we conducted a comprehensive meta-analysis to assess the strength of the association between the STK15 F31I polymorphism and overall cancer risk, and further performed a stratified analysis by ethnicity and cancer type. This meta-analysis, including 27 case-control studies, identified associations between STK15 F31I polymorphism and cancer risk. STK15 F31I polymorphisms (AA vs. TA+TT, AA vs. TT,
AA vs. TA, and A vs. T) significantly increased overall cancer risk. In a stratified analysis by cancer type, STK15 F31I polymorphisms (AA vs. TA+TT, AA vs. TT, AA vs. TA, and A vs. T) were also associated with a significant increase in breast cancer risk and esophageal cancer (AA vs. TA+TT and AA vs. TA). In a stratified analysis by ethnicity, the association of
STK15 F31I polymorphisms was significant in Asians but not Caucasians.
STK15, also named Aurora A, BTAK, and AIKI, encodes a serine/threonine kinase that acts as a crucial component in spindle formation, the centrosome maturation process, and proper cytokinesis during mitosis. It is located on chromosome 20q13, a region associated with a number of human cancers [47]. These threonine kinases belong to a family of mitotic kinases that maintain chromosomal stability through phosphorylation. Thus, any severe defects in STK15, such as mutations, would lead to drastic genomic instability and trigger apoptosis through cell cycle checkpoint surveillance [19,48]. Consequently, a cell harboring a defective STK15 may lead to cancer [19]. Our results demonstrate a significant statistical impact of STK15 F31I polymorphism on cancer risk. The
STK15 F31I polymorphism (T→A), which leads to an amino acid residue substitution at codon 31 phenylalanine (Phe) to Table 2. Distribution of stk15F31I polymorphisms genotype and allele among multiple cancer patients and controls.
Case Control Case Control HWE
AA TA TT AA TA TT A T A T
Sang et al. 46 161 173 39 188 153 253 507 266 494 Yes
Ruan et al. 167 568 599 161 691 716 902 1766 1013 2123 Yes
Navaratne et al. 4 33 59 6 33 54 41 151 45 141 Yes
Akkiz et al. 4 47 77 2 27 99 55 201 31 225 Yes
Song et al. 33 15 12 18 25 17 81 39 61 59 Yes
Chen et al. 66 79 43 118 168 38 211 165 404 244 Yes
MARIE-GENICA 167 1096 1873 249 1927 3290 1430 4842 2425 8507 Yes
Ricketts et al. 207 105 16 171 122 18 519 137 464 158 Yes
Dogan et al. 6 38 58 3 40 59 50 154 46 158 Yes
Chen et al. 3 13 44 6 21 38 19 101 33 97 Yes
Wang et al. 36 373 692 51 320 594 445 1757 422 1508 Yes
Vidarsdottir et al. 42 288 429 21 231 401 372 1146 273 1033 Yes
Tchatchou et al. 433 257 37 485 287 47 1123 331 1257 381 Yes
Hammerschmied et al. 7 57 92 12 65 81 71 241 89 227 Yes
Webb et al. 114 880 1564 125 888 1667 1108 4008 1138 4222 Yes
Fletcher et al. 18 154 335 48 280 547 190 824 376 1374 Yes
Zhang et al. 142 111 30 104 137 42 395 171 345 221 Yes
Cox. et al. 66 401 774 65 571 1075 533 1949 701 2721 Yes
Ju et al. 211 215 75 179 190 58 637 365 548 306 Yes
Chen et al. 36 27 5 33 32 10 99 37 98 52 Yes
Hienonen et al. 19 94 122 5 43 46 132 338 53 135 Yes
Lo et al. 348 288 71 886 887 196 984 430 2659 1279 Yes
DiCioccio et al. 71 502 821 99 649 1213 644 2144 847 3075 Yes
Sun et al. 256 214 50 192 262 66 726 314 646 394 Yes
Egan et al. 50 331 559 31 283 516 431 1449 345 1315 Yes
Miao et al. 308 290 58 249 316 91 906 406 814 498 Yes
Dai et al. 490 491 121 534 503 149 1471 733 1571 801 Yes
isoleucine (Ile), is associated with cellular transformation and dramatically increases chromosomal instability [49]. The
STK15 F31I polymorphism (T→A) variant changes the activity of the STK15 box 1, leading to an obstruction in p53 binding and the decreased degradation of STK15 [7]. The stabilized overexpression of STK15 results in centrosome amplification, improper cytokinesis, chromosomal instability, and the promotion of tumorigenesis [7]. In this meta-analysis, our results demonstrate that the T→A change in STK15 may lead to STK15-triggered elevation of cell centrosome proliferation, cell transformation, and dramatically increased chromosomal instability, which may increase the risk of multiple cancers.
Since the outcomes from meta-analysis can be affected by cancer origins, stratified analysis was conducted according to cancer type for the STK15 F31I polymorphism. The results demonstrate that the STK15 F31I polymorphism is associated with an increased risk of breast cancer and esophageal cancer, but not colorectal cancer and other cancers. However, all results should be interpreted with caution. For esophageal cancer, only three case-control studies were recruited in the current meta-analysis, which may restrict statistical power to detect a real influence or generate a fluctuated assessment, large heterogeneities among the studies enrolled in current meta-analysis should also be taken into consideration. More large scale studies are needed to verify these results. Stratified analysis was also performed regarding ethnicity for the STK15
F31I polymorphism. The STK15 F31I polymorphism is associated with the risk of cancer in Asians but not Caucasians. This meta-analysis confirmed the mutual effect of genetic diversity and variants in different populations to the risks of various cancers. In addition, cancer risk was affected
by genetic and environmental factors on different levels. The possible reason of the conflicting findings among different ethnicities could be that different genetic backgrounds and environmental factors they exposed to may have disproportionate effects on cancer risk. In the future, further investigations with large sample sizes should be conducted to identify these associations, particularly with regard to gene– gene and gene–environment interactions.
Two significant issues should be addressed in this study, that is, heterogeneity and publication bias, which may influence the results of meta-analysis. We don’t detect a significant publication bias in this meta-analysis, suggesting the reliability of our results. Significant heterogeneity was observed between publications for STK15 F31I polymorphisms. Potential sources of heterogeneity include the publication year, ethnicity, country, cancer type, sample size, and so on. When subgroup analyses were carried out according to ethnicity and cancer type, this heterogeneity was greatly reduced or removed in some subgroups, implying different effects on cancer types and ethnic populations, even for the same polymorphism. And then we performed further subgroup analyses by publication year, country, and sample size. The pooled subgroup analysis of a subset of studies published after 2006, esophageal cancer, Asian population, studies conducted in Chinese population and small sample size, suggested an association with more prominent heterogeneity. The reason might be due to uncontrolled mixed factors, the various susceptibility of cancer in different race or to internal bias in the study design. It is certain that the design of some of the included studies was suboptimal in this meta-analysis. From the forest plot in A vs. T compare genetic model (Figure 2), one can identify that 8 Table 3. Summary of results of the meta-analysis from different comparative genetic models in the subgroup analysis by ethnicity.
Polymorphism Genetic comparison Population OR(95%CI) P Test of heterogeneity Model
p -Value I2
AA+TA vs. TT All 1.04(0.97-1.12) 0.265 0.002 50.1% R
Asians 1.07(0.89-1.28) 0.482 0.001 65.6% R
Caucasians 1.04(0.97-1.11) 0.305 0.084 34.8% R
AA vs. TA+TT All 1.18(1.06-1.31) 0.002 0.000 56.2% R
Asians 1.27(1.10-1.47) 0.001 0.002 64.8% R
Caucasians 1.08(0.93-1.26) 0.310 0.026 45.3% R
AA vs. TT All 1.16(1.01-1.32) 0.035 0.000 55.7% R
Asians 1.26(1.01-1.56) 0.039 0.001 66.5% R
STK15 F31I Caucasians 1.08(0.91-1.28) 0.388 0.031 43.9% R
TA vs. TT All 1.01(0.95-1.08) 0.745 0.028 37.2% R
Asians 0.96(0.81-1.13) 0.628 0.015 54.6% R
Caucasians 1.03(0.98-1.08) 0.224 0.247 18.0% F
AA vs. TA All 1.18(1.06-1.30) 0.001 0.003 48.4% R
Asians 1.28(1.12-1.47) 0.000 0.010 57.0% R
Caucasians 1.07(0.93-1.23) 0.342 0.081 35.2% R
A vs. T All 1.08(1.01-1.14) 0.015 0.000 64.4% R
Asians 1.14(1.02-1.28) 0.023 0.000 73.9% R
Caucasians 1.04(0.97-1.11) 0.252 0.010 50.9% R F indicates fixed model; R indicates random model
studies are the main sources of heterogeneity [11,21-23,25,27,33,36]. In some publications, the study design included considerable oversights, for example, some investigations used small sample sizes (≤1000 subjects) [22,23,25,27,33,36]. Publication year may be the source of heterogeneity. Some studies published after 2006 was identified with prominent heterogeneity [22,25,27,33,36]. When come to country origins, studies conducted in Chinese population contribute the major outlier [11,21,23,25,27].
The power of this meta-analysis (α=0.05) was evaluated for each single genetic model using an internet-based Power and Sample Size Calculator (PS, version 3.0, 2009, http:// biostat.mc.vanderbilt.edu/twiki/bin/view/Main/
PowerSampleSize). The power was 1.000 in four genetic models (AA vs. TA+TT, AA vs. TT, AA vs. TA, and A vs. T), 0.526 in AA+TA vs. TT genetic model, and 0.075 in TA vs. TT genetic model.
However, there are certain limitations in this study that should be acknowledged. First, large heterogeneity exists in
our meta-analysis, which means the results should be interpreted with caution. Second, all recruited case–control studies were from Asians and Caucasians; thus, our results may only be suitable for these populations. Third, only published studies were eligible in this meta-analysis; therefore, some relevant unpublished studies were inevitably missed, which may lead to bias. Fourth, due to the lack of sufficient and uniform information in original case-control studies, data were not stratified by other factors (e.g., age, smoking, alcohol consumption, and other lifestyle factors). Considering the complexity of cancer etiology and the low penetrance cancer susceptibility gene effects from STK15 F31I SNP, these important environmental factors should not be ignored.
In summary, this meta-analysis suggests the STK15 F31I polymorphism represents a low risk factor for cancer, especially in Asians, in breast cancer and esophageal cancer subgroup. In the future, more studies with large sample sizes should be carried out to clarify the association between STK15
Table 4. Summary of results of the meta-analysis from different comparative genetic models in the subgroup analysis by cancer type.
Polymorphism Genetic comparison Cancer type OR(95%CI) P Test of heterogeneity Model
p -Value I2
AA+TA vs. TT All 1.04(0.97-1.12) 0.265 0.002, 50.1% R
Breast cancer 1.05(0.99-1.10); 0.120 0.462 0.0% F Colorectal cancer 1.04(0.94-1.15) 0.479 0.130 46.9% F Esophageal cancer 0.86(0.44-1.68) 0.652 0.000 90.2% R
Others 1.07(0.90-1.26) 0.445 0.007 43.2% R
AA vs. TA+TT All 1.18(1.06-1.31) 0.002 0.000 56.2% R
Breast cancer 1.20(1.05-1.37) 0.007 0.005 61.5% R Colorectal cancer 1.21(0.76-1.93) 0.416 0.027 67.4% R Esophageal cancer 1.28(1.08-1.53) 0.005 0.151 47.1% F
Others 1.10(0.84-1.44) 0.468 0.015 56.3% R
AA vs. TT All 1.16(1.01-1.32) 0.035 0.000 55.7% R
Breast cancer 1.22(1.10-1.35) 0.000 0.131 34.6% F Colorectal cancer 1.18(0.72-1.94) 0.501 0.078 56.1% R
STK15 F31I Esophageal cancer 1.02(0.47-2.22) 0.963 0.000 88.6% R
Others 1.04(0.77-1.41) 0.794 0.065 44.1% R
TA vs. TT All 1.01(0.95-1.08) 0.745 0.028 37.2% R
Breast cancer 1.01(0.96-1.07) 0.667 0.752 0.0% F Colorectal cancer 1.03(0.93-1.15) 0.553 0.313 15.7% F Esophageal cancer 0.78(0.42-1.47) 0.448 0.000 87.5% R
Others 1.05(0.94-1.16) 0.392 0.664 0.0% F
AA vs. TA All 1.18(1.06-1.30) 0.001 0.003 48.4% R
Breast cancer 1.19(1.04-1.36) 0.011 0.011 57.8% R Colorectal cancer 1.25(0.80-1.95) 0.335 0.050 61.7% R Esophageal cancer 1.32(1.10-1.58) 0.003 0.853 0.0% F
Others 1.07(0.83-1.39) 0.591 0.039 49.0% R
A vs. T All 1.08(1.01-1.14) 0.015 0.000 64.4% R
Breast cancer 1.08(1.01-1.15) 0.017 0.025 52.8% R Colorectal cancer 1.05(0.80-1.38) 0.732 0.008 74.7% R Esophageal cancer 1.00(0.71-1.42) 0.986 0.000 87.9% R
Others 1.11(0.95-1.28) 0.180 0.003 64.5% R
F31I polymorphism and cancer risk, especially for gene–gene and gene–environment interactions.
Table 5. Summary of results of the meta-analysis from different comparative genetic models in the breast cancer subgroup analysis by ethnicity.
Polymorphism Genetic comparison Population OR(95%CI) P Test of heterogeneity Model
p -Value I2
AA+TA vs. TT All 1.05(0.99-1.10) 0.120 0.462 0.0% F
Asians 1.07(0.96-1.20) 0.211 0.482 0.0% F
Caucasians 1.04(0.97-1.10) 0.284 0.309 16.3% F
AA vs. TA+TT All 1.20(1.05-1.37) 0.007 0.005 61.5% R
Asians 1.23(1.00-1.50) 0.049 0.006 75.9% R
Caucasians 1.18(0.96-1.44) 0.109 0.055 53.7% R
AA vs. TT All 1.22(1.10-1.35) 0.000 0.131 34.6% F
Asians 1.21(1.01-1.45) 0.037 0.266 24.3% F
STK15 F31I Caucasians 1.23(0.98-1.54) 0.075 0.081 49.0% R
TA vs. TT All 1.01(0.96-1.07) 0.667 0.752 0.0% F
Asians 1.02(0.90-1.14) 0.804 0.492 0.0% F
Caucasians 1.01(0.95-1.08) 0.723 0.628 0.0% F
AA vs. TA All 1.19(1.04-1.36) 0.011 0.011 57.8% R
Asians 1.22(0.98-1.52) 0.074 0.005 76.6% R
Caucasians 1.14(1.00-1.29) 0.042 0.136 40.5% F
A vs. T All 1.08(1.01-1.15) 0.017 0.025 52.8% R
Asians 1.15(0.97-1.36) 0.098 0.034 65.5% R
Caucasians 1.05(1.00-1.10) 0.069 0.109 44.5% F F indicates fixed model; R indicates random model
Figure 2. Meta-analysis with a random-effects model for the association between the risk of cancer and the STK15 F31I polymorphism (A vs. T).
Figure 3. Begg’s funnel plot of meta-analysis of between the STK15 F31I polymorphism and the risk of cancer in the dominant model.
doi: 10.1371/journal.pone.0082790.g003
Figure 4. Sensitivity analysis of the influence of A vs. T in overall cancer meta-analysis (random–effects estimates).
Figure 5. Filled funnel plot of meta-analysis of between the STK15 F31I polymorphism and the risk of cancer in the dominant model.
doi: 10.1371/journal.pone.0082790.g005
Figure 6. Galbraith radial plot of meta-analysis (A vs. T compare genetic model).
Supporting Information
Table S1. PRISMA checklist, Checklist of items to include when reporting a systematic review or meta-analysis (diagnostic review consisting of cohort studies).
(DOCX)
Author Contributions
Conceived and designed the experiments: HG JY. Performed the experiments: WT HQ HD. Analyzed the data: WT HQ HD BS LW HG JY. Contributed reagents/materials/analysis tools: HG JY. Wrote the manuscript: WT HQ HG JY.
References
1. Ihsan R, Chauhan PS, Mishra AK, Yadav DS, Kaushal M et al. (2011) Multiple analytical approaches reveal distinct gene-environment interactions in smokers and non smokers in lung cancer. PLOS ONE 6: e29431. doi:10.1371/journal.pone.0029431.
2. Liu L, Wu C, Wang Y, Zhong R, Wang F et al. (2011) Association of candidate genetic variations with gastric cardia adenocarcinoma in Chinese population: a multiple interaction analysis. Carcinogenesis 32: 336-342. doi:10.1093/carcin/bgq264.
3. Andrew AS, Nelson HH, Kelsey KT, Moore JH, Meng AC et al. (2006) Concordance of multiple analytical approaches demonstrates a complex relationship between DNA repair gene SNPs, smoking and bladder cancer susceptibility. Carcinogenesis 27: 1030-1037. doi: 10.1093/carcin/bgi284.
4. Maser RS, DePinho RA (2002) Connecting chromosomes. Crisis --Cancer. Science 297: 565-569.
5. Lengauer C, Kinzler KW, Vogelstein B (1998) Genetic instabilities in human cancers. Nature 396: 643-649. doi:10.1038/25292.
6. Gu J, Gong Y, Huang M, Lu C, Spitz MR et al. (2007) Polymorphisms of STK15 (Aurora-A) gene and lung cancer risk in Caucasians. Carcinogenesis 28: 350-355.
7. Ewart-Toland A, Briassouli P, de Koning JP, Mao JH, Yuan J et al. (2003) Identification of Stk6/STK15 as a candidate low-penetrance tumor-susceptibility gene in mouse and human. Nat Genet 34: 403-412. doi:10.1038/ng1220. PubMed: 12881723.
8. Egan KM, Newcomb PA, Ambrosone CB, Trentham-Dietz A, Titus-Ernstoff L et al. (2004) STK15 polymorphism and breast cancer risk in a population-based study. Carcinogenesis 25: 2149-2153. doi:10.1093/ carcin/bgh231.
9. Ruan Y, Song AP, Wang H, Xie YT, Han JY et al. (2011) Genetic polymorphisms in AURKA and BRCA1 are associated with breast cancer susceptibility in a Chinese Han population. J Pathol 225: 535-543. doi:10.1002/path.2902.
10. Webb EL, Rudd MF, Houlston RS (2006) Case-control, kin-cohort and meta-analyses provide no support for STK15 F31I as a low penetrance colorectal cancer allele. Br J Cancer 95: 1047-1049. doi:10.1038/sj.bjc. 6603382.
11. Miao X, Sun T, Wang Y, Zhang X, Tan W et al. (2004) Functional STK15 Phe31Ile polymorphism is associated with the occurrence and advanced disease status of esophageal squamous cell carcinoma. Cancer Res 64: 2680-2683. doi:10.1158/0008-5472.CAN-04-0651. 12. Moher D, Liberati A, Tetzlaff J, Altman DG, Group P (2009) Preferred
reporting items for systematic reviews and meta-analyses: the PRISMA statement. Ann Intern Med 151: 264-269, W264
13. Higgins JP, Thompson SG, Deeks JJ, Altman DG (2003) Measuring inconsistency in meta-analyses. BMJ 327: 557-560. doi:10.1136/bmj. 327.7414.557.
14. MARIE-GENICA Consortium on Genetic Susceptibility for Menopausal Hormone Therapy Related Breast Cancer Risk (2010) Polymorphisms in the BRCA1 and ABCB1 genes modulate menopausal hormone therapy associated breast cancer risk in postmenopausal women. Breast Cancer Res Treat 120: 727-736.
15. Vidarsdottir L, Bodvarsdottir SK, Hilmarsdottir H, Tryggvadottir L, Eyfjord JE (2007) Breast cancer risk associated with AURKA 91T -->A polymorphism in relation to BRCA mutations. Cancer Lett 250: 206-212. doi:10.1016/j.canlet.2006.10.003.
16. Tchatchou S, Wirtenberger M, Hemminki K, Sutter C, Meindl A et al. (2007) Aurora kinases A and B and familial breast cancer risk. Cancer Lett 247: 266-272. doi:10.1016/j.canlet.2006.05.002. PubMed: 16762494.
17. Fletcher O, Johnson N, Palles C, dos Santos Silva I, McCormack V et al. (2006) Inconsistent association between the STK15 F31I genetic polymorphism and breast cancer risk. J Natl Cancer Inst 98: 1014-1018. doi:10.1093/jnci/djj268.
18. Cox DG, Hankinson SE, Hunter DJ (2006) Polymorphisms of the AURKA (STK15/Aurora Kinase) Gene and Breast Cancer Risk (United
States). Cancer Causes Control 17: 81-83. doi:10.1007/ s10552-005-0429-9.
19. Lo YL, Yu JC, Chen ST, Yang HC, Fann CS et al. (2005) Breast cancer risk associated with genotypic polymorphism of the mitosis-regulating gene Aurora-A/STK15/BTAK. Int J Cancer 115: 276-283. doi:10.1002/ ijc.20855. PubMed: 15688402.
20. Dai Q, Cai QY, Shu XO, Ewart-Toland A, Wen WQ et al. (2004) Synergistic effects of STK15 gene polymorphisms and endogenous estrogen exposure in the risk of breast cancer. Cancer Epidemiol Biomarkers Prev 13: 2065-2070. PubMed: 15598762.
21. Sun T, Miao X, Wang J, Tan W, Zhou Y et al. (2004) Functional Phe31Ile polymorphism in Aurora A and risk of breast carcinoma. Carcinogenesis 25: 2225-2230. doi:10.1093/carcin/bgh244.
22. Chen J, Sen S, Amos CI, Wei C, Jones JS et al. (2007) Association between Aurora-A kinase polymorphisms and age of onset of hereditary nonpolyposis colorectal cancer in a Caucasian population. Mol Carcinog 46: 249-256. doi:10.1002/mc.20283.
23. Zhang WJ, Miao XP, Sun T, Zhang XM, Qu SN et al. (2006) Association between genetic polymorphism in STK15 and risk of colorectal cancer in a Chinese population. Zhonghua Zhong Liu Za Zhi 28: 43-46.
24. Hienonen T, Salovaara R, Mecklin JP, Jarvinen H, Karhu A et al. (2006) Preferential amplification of AURKA 91A (Ile31) in familial colorectal cancers. Int J Cancer 118: 505-508. doi:10.1002/ijc.21344. 25. Chen XB, Chen GL, Liu JN, Yang JZ, Yu DK et al. (2009) Genetic
polymorphisms in STK15 and MMP-2 associated susceptibility to esophageal cancer in Mongolian population. Zhonghua Yu Fang Yi Xue Za Zhi 43: 559-564.
26. Sang Y, Gu H, Ding G, Yang W, Chen S et al. (2012) Association between the esophageal cancer susceptibility and the STK15 T+91A polymorphism. Chinese Journal Experimental Surgery 29: 1220. 27. Song B, Hao G, Ma W, Tian Y, Du L (2010) Association between
STK15 genetic polymorphism and risk of bladder cancer. Xiandai Miniao Wa ike Za Zhi 15: 277-279.
28. Ju H, Cho H, Kim YS, Kim WH, Ihm C et al. (2006) Functional polymorphism 57Val>Ile of aurora kinase A associated with increased risk of gastric cancer progression. Cancer Lett 242: 273-279. doi: 10.1016/j.canlet.2005.11.015.
29. Chen L (2005) Genetic polymorphisms and disease risks: STKl5 gene and risk for gastric cancer, MMP9 gene and risk for Thoracic Aortic Aneurysm and Thoracic Aortic Dissection. China Medical University. 101 p.
30. Dogan I, Ekmekci A, Yurdakul AS, Onen IH, Ozturk C et al. (2008) Polymorphisms in the aurora-A gene is not associated with lung cancer in the Turkish population. DNA Cell Biol 27: 443-448. doi:10.1089/dna. 2007.0719.
31. Wang W, Spitz MR, Yang H, Lu C, Stewart DJ et al. (2007) Genetic variants in cell cycle control pathway confer susceptibility to lung cancer. Clin Cancer Res 13: 5974-5981. doi: 10.1158/1078-0432.CCR-07-0113. PubMed: 17908995.
32. Ricketts C, Zeegers MP, Lubinski J, Maher ER (2009) Analysis of germline variants in CDH1, IGFBP3, MMP1, MMP3, STK15 and VEGF in familial and sporadic renal cell carcinoma. PLOS ONE 4: e6037. doi: 10.1371/journal.pone.0006037.
33. Hammerschmied CG, Stoehr R, Walter B, Wieland WF, Hartmann A et al. (2007) Role of the STK15 Phe31Ile polymorphism in renal cell carcinoma. Oncol Rep 17: 3-7.
34. Dicioccio RA, Song H, Waterfall C, Kimura MT, Nagase H et al. (2004) STK15 polymorphisms and association with risk of invasive ovarian cancer. Cancer Epidemiol Biomarkers Prev 13: 1589-1594.
35. Navaratne KS, Weil RJ (2010) The Aurora A F31I polymorphism is not a risk factor for glioblastoma. World Neurosurg 74: 144-146. doi: 10.1016/j.wneu.2010.04.003.
37. Terry PD, Umbach DM, Taylor JA (2006) APE1 genotype and risk of bladder cancer: evidence for effect modification by smoking. Int J Cancer 118: 3170-3173. doi:10.1002/ijc.21768.
38. Zhao G, Li C, Okoro CA, Li J, Wen XJ, et al. (2013) Trends in modifiable lifestyle-related risk factors following diagnosis in breast cancer survivors. J Cancer Surviv.
39. Touvier M, Druesne-Pecollo N, Kesse-Guyot E, Andreeva VA, Galan P et al. (2013) Demographic, socioeconomic, disease history, dietary and lifestyle cancer risk factors associated with alcohol consumption. Int J Cancer.
40. Nickels S, Truong T, Hein R, Stevens K, Buck K et al. (2013) Evidence of gene-environment interactions between common breast cancer susceptibility loci and established environmental risk factors. PLOS Genet 9: e1003284.
41. Siegert S, Hampe J, Schafmayer C, von Schonfels W, Egberts JH et al. (2013) Genome-wide investigation of gene-environment interactions in colorectal cancer. Hum Genet 132: 219-231. doi:10.1007/ s00439-012-1239-2.
42. Shi Y, Luo GJ, Zhang L, Shi J, Zhang DQ et al. (2012) Interaction between alcohol consumption and CYP 2C19 gene polymorphism in relation to oesophageal squamous cell carcinoma. PLOS ONE 7: e43412. doi:10.1371/journal.pone.0043412.
43. Wang X, Zhou YX, Qiao W, Tominaga Y, Ouchi M et al. (2006) Overexpression of aurora kinase A in mouse mammary epithelium
induces genetic instability preceding mammary tumor formation. Oncogene 25: 7148-7158. doi:10.1038/sj.onc.1209707.
44. Briassouli P, Chan F, Savage K, Reis-Filho JS, Linardopoulos S (2007) Aurora-A regulation of nuclear factor-kappaB signaling by phosphorylation of IkappaBalpha. Cancer Res 67: 1689-1695. doi: 10.1158/0008-5472.CAN-06-2272.
45. Baba Y, Nosho K, Shima K, Irahara N, Kure S et al. (2009) Aurora-A expression is independently associated with chromosomal instability in colorectal cancer. Neoplasia 11: 418-425.
46. Yang SB, Zhou XB, Zhu HX, Quan LP, Bai JF et al. (2007) Amplification and overexpression of Aurora-A in esophageal squamous cell carcinoma. Oncol Rep 17: 1083-1088. PubMed: 17390048. 47. Evans WE, Relling MV (1999) Pharmacogenomics: translating
functional genomics into rational therapeutics. Science 286: 487-491. doi:10.1126/science.286.5439.487.
48. Marumoto T, Zhang D, Saya H (2005) Aurora-A - a guardian of poles. Nat Rev Cancer 5: 42-50. doi:10.1038/nrc1526. PubMed: 15630414. 49. Chen J, Li D, Wei C, Sen S, Killary AM et al. (2007) Aurora-A and p16