www.atmos-chem-phys.net/10/7963/2010/ doi:10.5194/acp-10-7963-2010
© Author(s) 2010. CC Attribution 3.0 License.
Chemistry
and Physics
Modelling surface ozone during the 2003 heat-wave in the UK
M. Vieno1,2, A. J. Dore2, D. S. Stevenson1, R. Doherty1, M. R. Heal3, S. Reis2, S. Hallsworth2, L. Tarrason4, P. Wind5,
D. Fowler2, D. Simpson5,6, and M. A. Sutton2
1School of GeoSciences, The University of Edinburgh, UK 2Centre for Ecology and Hydrology, Penicuik, UK
3School of Chemistry, The University of Edinburgh, UK 4Norwegian Institute for Air Research, Kjeller, Norway 5Norwegian Meteorological Institute, Oslo, Norway
6Dept. Earth & Space Sciences, Chalmers University of Technology, Gothenburg, Sweden Received: 15 July 2009 – Published in Atmos. Chem. Phys. Discuss.: 18 September 2009 Revised: 19 August 2010 – Accepted: 20 August 2010 – Published: 27 August 2010
Abstract. The EMEP4UK modelling system is a high
resolution (5×5 km2) application of the EMEP chemistry-transport model, designed for scientific and policy studies in the UK. We demonstrate the use and performance of the EMEP4UK system through the study of ground-level ozone (O3) during the extreme August 2003 heat-wave. Meteo-rology is generated by the Weather Research and Forecast (WRF) model, nudged every six hours with reanalysis data. We focus on SE England, where hourly average O3reached up to 140 ppb during the heat-wave. EMEP4UK accurately reproduces elevated O3and much of its day-to-day variabil-ity during the heat-wave. Key O3precursors, nitrogen diox-ide and isoprene, are less well simulated, but show generally accurate diurnal cycles and concentrations to within a factor of∼2–3 of observations. The modelled surface O3 distribu-tion has an intricate spatio-temporal structure, governed by a combination of meteorology, emissions and photochemistry. A series of sensitivity runs with the model are used to explore the factors that influenced O3 levels during the heat-wave. Various factors appear to be important on different days and at different sites. Ozone imported from outside the model do-main, especially the south, is very important on several days during the heat-wave, contributing up to 85 ppb. The effect of dry deposition is also important on several days. Modelled isoprene concentrations are generally best simulated if iso-prene emissions are changed from the base emissions: typi-cally doubled, but elevated by up to a factor of five on one hot
Correspondence to:M. Vieno ([email protected])
day. We found that accurate modelling of the exact positions of nitrogen oxide and volatile organic compound plumes is crucial for the successful simulation of O3at a particular time and location. Variations in temperature of±5 K were found to have impacts on O3of typically less than±10 ppb.
1 Introduction
of the heat-wave was on the 4 August and the end was on the 12 August. Between these dates, observed and simulated daily maximum temperatures satisfied the UK Climate Im-pacts Programme (UKCIP) definition for a heat-wave. These dates match closely the 5–11 August period defined as heat-wave in the work of Lee et al. (2006).
In this study we investigate the causes of the elevated ozone levels using a high resolution (5×5 km2grid) chemical transport model system over the UK domain (EMEP4UK). This system comprises the EMEP chemical transport model (Simpson et al., 2003a), the Weather Research and Fore-cast model, and fine-scale UK emissions from UK national databases. This paper represents the first demonstration of the abilities of the EMEP4UK model for photochemical oxi-dant modelling in the UK. We first show that the model sys-tem is able to simulate hourly ozone measurements realis-tically from a range of sites over SE England during 2003, including measurements made as part of the TORCH cam-paign. We then conduct a series of sensitivity runs to in-vestigate the influences of a variety of different meteorologi-cal and chemimeteorologi-cal factors (temperature, anthropogenic volatile organic compounds, emissions of biogenic isoprene, anthro-pogenic emissions of NOx(NO+NO2), ozone dry deposition, and transport) that contributed to the high ozone episodes in this region during the August 2003 heat-wave.
2 Model description and set-up
The EMEP4UK model framework is a nested regional chemistry-transport model (CTM) driven by high-resolution meteorology and national emissions that is used to produce a detailed representation of the physical and chemical state of the atmosphere over Europe and, in particular, over the UK (Vieno et al., 2009). The underlying CTM is the EMEP Uni-fied Model (Simpson et al., 2003a), which has been modiUni-fied in recent years to enable application on spatial scales rang-ing from the 5×5 km2grid used here for the UK to the global scale (Jonson et al. 2007, 2010).
For this study, the EMEP4UK model was driven by the Weather Research Forecast (WRF) model (www.wrf-model.org) with a resolution of 5×5 km2. The WRF model included data assimilation (Newtonian nudging) of the nu-merical weather prediction (NWP) model meteorological re-analysis from the US National Center for Environmental Pre-diction (NCEP)/National Center for Atmospheric Research (NCAR) Global Forecast System (GFS) at 1◦resolution,
ev-ery 6 h.
The WRF/EMEP4UK model was applied here using a one-way nested domain approach, with an outer domain res-olution of 50×50 km2 covering the official EMEP domain (Simpson et al., 2003a), an intermediate domain resolution of 10×10 km2 and an inner domain with a resolution of 5×5 km2. Simulations were performed over each of these domains, the results from the outermost domain being used
as boundary conditions to the intermediate domain and so on. The intermediate domain is required by the WRF model due to the complexity of simulating atmospheric dynamics, with stability criteria imposing a maximum nesting factor of 5. For the chemical transport (EMEP) modelling there are fewer numerical restrictions and we make use of just the outer and inner domains. As the inner domain covers all of the UK, this approach simplifies the interpretation of the model tests. The innermost domain covers the whole British Isles, plus adjacent parts of France, Denmark, Holland and Belgium. Both WRF and EMEP4UK models use 20 vertical layers, with terrain following coordinates, and resolution increasing towards the surface. The vertical column extends from the surface (centre of the surface layer ∼45 m) up to 100 hPa (∼16 km). Modelled species are calculated at 3 m above the surface plant or other canopy by making use of the constant-flux assumption and definition of aerodynamic re-sistance (Simpson et al., 2003b). The WRF coarse grid of 50×50 km2 resolution was used to drive the EMEP model across the European domain to calculate the chemical ini-tial conditions and boundary conditions (one-way nesting ap-proach) for the EMEP4UK model (driven by the inner WRF domain 5×5 km2). The EMEP model itself (50×50 km2) was initialised with climatologically-derived ozone boundary and initial conditions (Logan, 1999). To simulate the import of ozone realistically in a specific year, the so called “Mace Head” adjustment was applied (Simpson et al., 2003a). This adjustment uses monthly “clean-air (Atlantic)” observations from the Mace Head site on the west coast of Ireland, ad-justing the monthly Logan climatology to match Mace Head data, and it was only applied to the EMEP Unified Model at 50×50 km2resolution.
The current EMEP Unified model is a development of the 3-D chemical transport model of Berge and Jakob-sen (1998), extended with photo-oxidant chemistry (Simp-son et al., 1995, 2003a; Anders(Simp-son-Sk¨old et al., 1999) and the EQSAM gas/aerosol partitioning model (Metzger et al., 2002). Two types of emissions are present in the model: an-thropogenic and natural. For the UK, anan-thropogenic emis-sions of NOx, NH3, SO2, PM2.5, PMCO (coarse
calculations. Emissions of NOxfrom lightning are included as monthly averages (K¨ohler et al., 1995). Seasonally aver-aged aircraft emissions are included for NOxfrom Gardner et al. (1997). Both aircraft and lightning emissions are pro-vided as 3-D fields for the whole model domain. Natural soil NOxemissions and non-anthropogenic biomass burning are not included. For CH4a constant mixing ratio over the whole domain is prescribed (Simpson et al., 2003a).
Sixteen basic land-use classes are used in the dry deposi-tion module of the EMEP4UK model. For those vegetative landuse categories for which stomatal modelling is under-taken, the start and end of the growing season is specified and the development of leaf area index within this growing season is also modelled (Simpson et al., 2003a, b). Dry depo-sition is calculated using a resistance analogy combined with stomatal and non-stomatal conductance algorithms (Ember-son et al., 2001; Simp(Ember-son et al., 2003a, b), whereas wet depo-sition uses scavenging coefficients applied to the 3-D rainfall. Full details of the EMEP model are given in Simpson et al. (2003a) and Fagerli et al. (2004).
3 Methods
A full year simulation was performed for 2003 using EMEP4UK/WRF in the configuration described in Sect. 2. Thirteen further one-month sensitivity experiments were car-ried out to investigate the contributing factors to the elevated ozone in the southern UK during the 2003 August heat-wave. These were identical to the base experiment in all respects except that in each case a single meteorological or chemi-cal variable was changed in the EMEP4UK 5×5 km2 grid inner domain. Use of a one-way nesting algorithm means that changes to fields within the inner domain do not influ-ence fields in the outer domains. With this set-up, any air that recirculates (i.e. exits the inner domain, then re-enters) will lose the original influence of the inner domain also the coarse domain used to calculate the boundary and initial condition was not modified. This approximation is not expected to lead to significant problems in the simulations reported here.
The first factor investigated was surface temperature, which was either increased or decreased by 5 K. This af-fected ozone by changing both emissions of biogenic iso-prene, and dry deposition of ozone through the surface ex-change scheme. The 3-D potential temperature has also been increased by +5 K and +10 K, to investigate the effect of tem-perature on the chemistry. The imposed change in temper-ature did not affect the dynamic meteorology, as the influ-ence was limited to the chemical transport (EMEP) part of the code, and no feedbacks operate from the EMEP model to WRF. Furthermore, those dispersion parameters which are calculated in the EMEP model (mixing height, eddy diffu-sivity) rely on gradients in potential temperature rather than absolute temperature. As these gradients are preserved with a uniform 5 or 10 K change in potential temperature, this
test only affects the chemical scheme and avoids unphysi-cal (and NWP inconsistent) effects on the EMEP dispersion rates. Several experiments then varied emissions of spe-cific species: biogenic isoprene (zero (no emissions), 2×, and 5×base case emissions), anthropogenic VOC (±50%), or anthropogenic NOx (−10% and −50%). The focus of the three isoprene experiments, generally the most important biogenic VOC with regard to ozone formation, was to inves-tigate the importance of UK-generated isoprene on surface ozone formation. As an extreme test of the importance of dry deposition, a further experiment was conducted in which ozone dry deposition (both stomatal and non-stomatal) was entirely switched off. The final experiment fixed ozone at the EMEP4UK boundary to the monthly climatological value from Logan (1999) rather than using 3-hourly values from the EMEP 50×50 km2model. Hereafter we refer to this as the “O3import” experiment. This allowed the influence of import from the outer domain to be isolated. The sensitivity experiments are summarised in Table 1.
4 Results and discussion
4.1 Base 2003 simulation
4.1.1 Surface temperature
Table 1.Summary of the maximum changes in model-simulated ozone at the Writtle site during the first 15 days August 2003 induced by each of the various sensitivity model experiments described in this work.
Sensitivity test + (ppb) −(ppb) Effect on
1 +5 K Temperature (2 m) 9 0 Biogenic emission and dry dep.
2 −5 K Temperature (2 m) 0 9 Biogenic emission and dry dep.
3 +5 K 3-D potential temperature 10 0 Chemistry
4 +10 K 3-D potential temperature 15 0 Chemistry
5 +50% UK NMVOC emissions 30 0 Chemistry
6 −50% UK NMVOC emissions 0 16 Chemistry
7 No Isoprene emissions 0 10 Chemistry
8 2×UK Isoprene emissions 10 0 Chemistry
9 5×UK isoprene emissions 45 0 Chemistry
10 −50% UK NOxemissions 65 5 Chemistry
11 −10% UK NOxemissions 9 1 Chemistry
12 No dry deposition of O3 50 2 Dry deposition
13 fixed boundary conditions 10 85 All
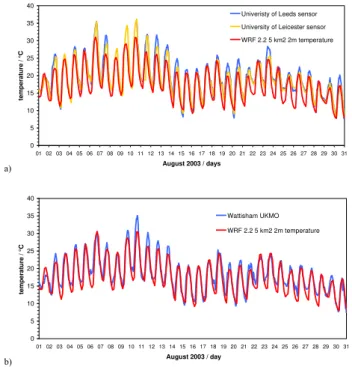
and the heat island effect may be larger. The temperature sensors used may also have accuracy limitations. The fact that there is some disagreement between the two sensors at Writtle (TORCH) indicates that at least one of these intro-duces uncertainty of up to 3 K. In summary, despite some limitations, the WRF model captures the main features of the heat-wave and diurnal variations of temperature during Au-gust 2003.
As an additional test of the WRF model performances we compared the calculated hourly temperature for the first 15 days of August 2003 at all available UK site of the UK Me-teorological Office MIDAS Land Surface Station data (169 sites across the UK, data available from http://badc.nerc. ac.uk/data/ukmo-midas). Overall the bias was found to be 1.5◦C as for the Wattisham site (Fig. 1b); hence the bias at Writtle site (2◦C) is larger than at other UK sites for the cor-responding period.
4.1.2 Surface wind speed and direction
Wind speed and direction are also important parameters that may influence surface ozone at a given location. Figure 2 shows the comparison between the WRF model and ob-servation for the first 15 days of August at Wattisham for surface wind speed and direction. The low winds speeds associated with the slow-moving anticyclone over Europe are well represented, although the magnitude of simulated low wind speeds is underestimated on average by 1.3 m s−1 (±1.2 m s−1one standard deviation). Moreover, the wind di-rection (generally from the south east or south west) is well captured by the model (R2=0.9, slope 0.8 and intercept of 18 degrees). We note that the highest wind speeds occur on the 6 August when imported ozone made the largest contribution to the ozone simulated at Writtle as compared to other days in the 15-day period (see Sect. 4.2.6). For the 9–10 August when wind speed are lowest the model suggests a smaller
a)
0 5 10 15 20 25 30 35 40
01 02 03 04 05 06 07 08 09 10 11 12 13 14 15 16 17 18 19 20 21 22 23 24 25 26 27 28 29 30 31 August 2003 / days
tem
p
erat
ure
/ °
C
Univeristy of Leeds sensor University of Leicester sensor WRF 2.2 5 km2 2m temperature
b)
0 5 10 15 20 25 30 35 40
01 02 03 04 05 06 07 08 09 10 11 12 13 14 15 16 17 18 19 20 21 22 23 24 25 26 27 28 29 30 31 August 2003 / day
temperature / °C
Wattisham UKMO WRF 2.2 5 km2 2m temperature
Fig. 1.Measured (blue, orange) and modelled (red) hourly surface
temperature (◦C) during August 2003 at(a)Writtle TORCH
cam-paign, and(b)Wattisham UK Met Office weather station. For
Writ-tle, measurements from two different sensors are shown. Model
results are from the WRF 5×5 km2grid-square containing the site.
0 2 4 6 8 10 12 14 16 18 20 22 24
01 02 03 04 05 06 07 08 09 10 11 12 13 14 15
August 2003 / day
w in d sp ee d m s -1 -180 -120 -60 0 60 120 180 240 300 360 w in d dire cti o n degre e
wind speed obs wind speed WRF wind direction obs wind direction WRF
Fig. 2. Time series of hourly modelled (red, black) and observed
(blue, pale blue) 10 m wind speed (bottom, m s−1)and 10 m wind
direction (top, degrees) at Wattisham.
4.1.3 Surface ozone
Figure 3a and b show observed and model-simulated sur-face ozone for two sites from the UK Automatic Urban and Rural monitoring network (AURN), for the hour 14:00– 15:00 GMT for each day of 2003. The two sites are Wicken Fen (for all hours of 2003, R2=0.6, slope=0.7 and inter-cept=12 ppb), a rural site (52◦17′54′′N, 0◦17′28′′E), and London Eltham (for all hours of 2003,R2=0.6, slope=0.8 and intercept=10 ppb), an urban background site (51◦ 27′09′′N,
0◦04′14′′), (see Fig. 7 for locations). The model closely
simulates the seasonal variation of surface ozone at the two sites. Moreover the model is able to capture ozone peaks (>50 ppb) for the whole of 2003. It is interesting to note that the August episode is not exceptional – there are sev-eral episodes of similar magnitude, from late March to mid-September. The fact that comparatively high concentrations of ozone occur in England at other times not associated with exceptional temperatures is probably linked to the fact that many ozone episodes can be attributed to long-range trans-port, arising from precursors over continental Europe and with multi-day processes controlling ozone formation (e.g. Cox et al., 1975, Guicherit and van Dop, 1977; Simpson et al., 1995). We found that there is not a clear direct link be-tween high UK temperature and high UK ozone, since high UK ozone episodes may occur at relatively low UK temper-atures when ozone and/or precursors are imported from out-side of the inner model domain.
Modelled and observed hourly ozone from the same two AURN stations (Wicken Fen and London Eltham) in August 2003 are shown in Fig. 4a and b. Similarly, model simula-tions are compared with observasimula-tions at Writtle (TORCH) in Fig. 4c. Scatter plots of these data are shown in Fig. 5. In terms of R2 for all the hourly August data, the model performs best at Wicken Fen (R2=0.7), London Eltham (R2=0.6) and worst at Writtle (R2=0.5). Nevertheless, the model accurately simulates many of the high ozone days
dur-a) 0 25 50 75 100 125 150
01 02 03 04 05 06 07 08 09 10 11 12
2003 / month
O3 / ppb 0 50 100 150 200 250 300
Wicken Fen AURN Wicken Fen EMEP4UK
b) 0 25 50 75 100 125 150
01 02 03 04 05 06 07 08 09 10 11 12
2003 / month
O3 / ppb 0 50 10 15 20 25 30
London Eltham AURN London Eltham EMEP4UK
Fig. 3. Mid-afternoon (14:00–15:00) hourly mean surface ozone
(ppb) for each day of 2003 (modelled, red; measured, blue) at:(a)
Wicken Fen and(b)London Eltham (some missing data in the
ob-servations in May and June).
a) 0 25 50 75 100 125 150
01 02 03 04 05 06 07 08 09 10 11 12 13 14 15 16 17 18 19 20 21 22 23 24 25 26 27 28 29 30 31 August 2003 / day
O3 / ppb 0 50 100 150 200 250 300 Series3
Wicken Fen AURN Wicken Fen EMEP4UK
b) 0 25 50 75 100 125 150
01 02 03 04 05 06 07 08 09 10 11 12 13 14 15 16 17 18 19 20 21 22 23 24 25 26 27 28 29 30 31 August 2003 / day
O3 / ppb 0 50 100 150 200 250 300 Series4
London Eltham AURN London Eltham EMEP4UK
c) 0 25 50 75 100 125 150
01 02 03 04 05 06 07 08 09 10 11 12 13 14 15 16 17 18 19 20 21 22 23 24 25 26 27 28 29 30 31 August 2003 / day
O3
/ ppb
TORCH campaign EMEP4UK Writtle
Fig. 4. Hourly time-series of modelled (red line) and measured
(blue circles) surface ozone (ppb) during August 2003 at: (a)
Wicken Fen,(b)London Eltham, and(c)TORCH campaign
(Writ-tle).
a)
y = 0.7x + 8.0 R2
= 0.7
0 40 80 120 160
0 40 80 120 160
O3 AURN / ppb
O3
EMEP4
UK / ppb
b)
y = 0.7x + 3.1 R2
= 0.6
0 40 80 120 160
0 40 80 120 160
O3 AURN / ppb
O3
EM
EP4
U
K
/ ppb
c)
y = 0.5x + 9.3 R2 = 0.5
0 40 80 120 160
0 40 80 120 160
O3 TORCH / ppb O3
EMEP4UK
/ ppb
Fig. 5.Scatter plots of modelled vs. observed hourly August 2003
surface ozone (ppb) at(a)Wicken Fen (AURN),(b)London Eltham
(AURN), and(c)Writtle (TORCH). The 1:1 line extends to the full
scale whereas the best fit line finishes with the maximum modelled or observed value.
would yield lower isoprene emissions, which under high NOx conditions would mean less local ozone production. Lower temperatures would shift equilibrium towards more peroxyacetyl nitrate formation, tying up some NOxand radi-cals thus lowering local ozone production (Sillman and Sam-son, 1995; Baertsch-Ritter et al., 2004). Secondly, a lower frequency of easterly wind components on the 9–10 August could lead to lesser background concentrations of “high” ozone since the highest ozone concentrations during the heat-wave period were found over France and Germany in both model and observations (not shown), although we note that winds were light. Further reasons for the discrepancy be-tween the model and observations at Writtle are discussed in Sect. 4.2.
The spatial and temporal variability of simulated surface daily maximum ozone for the first 15 days of August 2003 is shown in Fig. 6. During this period a clear feature of ele-vated ozone building up after the 3 August is visible across southern England. The feature shows strong spatial and day-to-day variability. The detailed structure in the simulated O3 field clearly illustrates how difficult it is to simulate every site accurately, particularly those close to emissions sources or with other strong local influences on ozone.
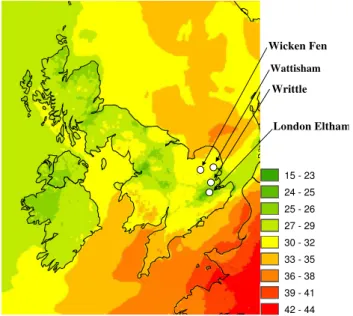
The modelled monthly mean distribution of surface ozone for August 2003 is shown in Fig. 7, together with the location of the observation sites included in this study. The influence of surface NOxemissions on these ozone fields is clearly ev-ident along road corridors and over cities such as London, Birmingham and Manchester. This highlights the importance
23 - 39 40 - 49 50 - 55 56 - 61 62 - 70 71 - 82 83 - 103 104 - 120 121 - 203
01/08 02/08 03/08 04/08
05/08 06/08 07/08 08/08
09/08 10/08 11/08 12/08
13/08 14/08 15/08
Fig. 6.EMEP4UK surface daily maximum ozone (ppb) for the first
15 days of August 2003.
of detailed emissions to simulate properly the spatial pattern of ozone over the UK and, more generally, wherever discrete emissions are present (i.e., road, point sources etc.).
4.2 Which factors contributed to the high surface ozone
during the 2003 heat-wave?
In this section we present and discuss results from the sensi-tivity experiments described in Table 1, with the aim of de-termining the key factors that led to the high values of ozone during the 2003 heat-wave. We focus in particular on O3 at Writtle, but also consider the influences on O3across the EMEP4UK model domain.
4.2.1 Surface temperature and 3-D potential
temperature
! !
!
( 15 - 23
24 - 25
25 - 26
27 - 29 30 - 32
33 - 35
36 - 38
39 - 41
42 - 44
Wicken Fen
Writtle
London Eltham Wattisham
Fig. 7.Monthly mean (August 2003) surface ozone (ppb) calculated
by the EMEP4UK model. The white dots indicate the sites included in this work.
emissions scheme is based on that of Guenther et al. (1995) and Simpson et al. (2003a). At 30◦C (the average max tem-perature during the heat-wave period) a 5◦C increase in
tem-perature corresponds to a doubling of isoprene emissions. This similarity suggests that the major parameter modified by the temperature experiment in this range of temperatures is the isoprene emissions.
Over the 15-day period a +5 K and +10 K increase of the 3-D potential temperature monotonically increased surface O3by up to 10 and 15 ppb, respectively. The results for the +5 K increase of 3-D potential temperature are shown in Fig-ure 8 (Changes in O3 for 10 K, not shown, are essentially double those of the 5 K experiment). Considering that 5 or 10 K changes are a large perturbation to 3-D temperature as compared with model biases, we suggest that O3 is biased only by a few ppb due to the effects of WRF model temper-ature biases on the EMEP model. The change of potential temperature throughout the atmosphere affects all chemical conversion rates only, whereas the effect of surface temper-ature change is limited to isoprene emission and dry depo-sition rates only. As mentioned in the methods section, the changes to 3-D temperature were applied only to the chem-istry, leaving the dynamic meteorology unchanged.
4.2.2 Anthropogenic NMVOC emissions
The effects of the NMVOC sensitivity experiments on mod-elled surface ozone are shown in Fig. 9. When the UK an-thropogenic emissions of NMVOC were modified by±50%, the model response was to change surface ozone at Writtle by typically±4 ppb. Larger responses occurred on the 2, 6,
a)
0 40 80 120 160
1 2 3 4 5 6 7 8 9 10 11 12 13 14 15
August 2003 / day O3
/ p
pb
+5 K potential temperature +5 K surface temperature -5 K surface temperature TORCH campaign EMEP4UK Base run
b) -15
-10 -5 0 5 10 15
1 2 3 4 5 6 7 8 9 10 11 12 13 14 15
Δ
O3
/ pp
b
+5 K potential temperature +5 K surface temperature -5 K surface temperature
Fig. 8. (a)Hourly time-series of modelled (lines) and measured
(cir-cles) surface ozone (ppb) for 1–15 August 2003 at the TORCH cam-paign site, Writtle. EMEP4UK baseline simulation (black line) and model sensitivity experiments for 3-D potential temperature (+5 K
yellow) and surface temperature (+5 K, blue;−5 K red):(b)change
in O3(ppb) for the three sensitivity experiments relative to the
base-line.
9 and 13 August, when an increase in NMVOC increased surface ozone by as much as 30 ppb, while reduced NMVOC emissions decreased it by as much as 16 ppb (Fig. 9). Some of the days showing great sensitivity (6, 9 August) coin-cide with days when the temperature-induced changes were also important, but other days (2, 13 August) seem specific to NMVOC. As temperature changes in the model impact BVOC emissions but not anthropogenic VOC, these differ-ent periods likely reflect days when isoprene did and did not play a large role in ozone formation.
a)
0 40 80 120 160
1 2 3 4 5 6 7 8 9 10 11 12 13 14 15
August 2003 / day O3
/ ppb
+50% emitted UK NMVOCs -50% emitted UK NMVOCs TORCH campaign EMEP4UK Base run
b) -20
-10 0 10 20 30
1 2 3 4 5 6 7 8 9 10 11 12 13 14 15
Δ
O3
/
p
pb
+50% emitted UK NMVOCs -50% emitted UK NMVOCs
Fig. 9.As for Fig. 8 but for model sensitivity experiments varying
the emissions of UK anthropogenic NMVOC (+50%, blue;−50%,
red).
general both NOxand VOC control must be considered to-gether. Such non-linearities are expected from earlier studies (e.g. Sillman et al., 1990; Simpson et al., 1995; Baertsch-Ritter at al., 2004), but quantifying the magnitude of such effects is essential to assess the expected impacts of such pol-icy.
4.2.3 Biogenic isoprene emissions
Figure 10 shows the comparison between observed isoprene and model-simulated isoprene at Writtle for the base run and for a 2×and 5×increase in UK emissions of biogenic iso-prene. The model-simulated isoprene is, in general, in better agreement with observations for the model simulation with double isoprene emissions. In terms of impact on surface ozone (Fig. 11), the models indicates that UK biogenic iso-prene emissions contribute up to ∼10 ppb ozone on some days in the base run case as compared to the zero isoprene emissions experiment. Doubling UK isoprene emissions en-hances surface ozone concentrations by a further 10 ppb, and with 5×emissions the effect is∼5 times higher (up to
∼45 ppb). An approximately linear dependency of surface ozone to zero, 2× and 5×UK biogenic emissions during this period is therefore found with this experiment (Fig. 11).
0.0 0.5 1.0 1.5 2.0 2.5
01 02 03 04 05 06 07 08 09 10 11 12 13 14 15
August 2003 / day
Isoprene
/ ppb
2x UK Isoprene 5x UK Isoprene TORCH Isoprene Isoprene EMEP4UK base run
Fig. 10. Time-series of modelled (lines) and measured
(cir-cles) hourly surface isoprene (ppb) during August 2003 at Writtle (TORCH).
The maximum change of ozone due to isoprene (5× sce-nario) is 45 ppb which occurred on the 6 August 2003 at 17:00, but when the ozone concentration was at its maxi-mum at 15:00 this difference was 23 ppb, which is not the major factor when compared with import on that day (see Sect. 4.2.6). On the 10 August the 5× scenario fits the observed isoprene concentrations better and the ozone at-tributable to isoprene emissions is then around 30 ppb. Over the whole heat-wave period, it is only on the 10 August that UK isoprene emissions appear to be the dominant cause of elevated ozone concentrations. Taken over an extended pe-riod and the whole UK, isoprene emissions had relatively modest effects on simulated UK ozone. However, the mod-elling suggests that isoprene may play a substantial role for the warmest day at Writtle, when emissions are greatly en-hanced.
a)
0 40 80 120 160
1 2 3 4 5 6 7 8 9 10 11 12 13 14 15
August 2003 / day O3
/ ppb
no - UK isoprene 2x - UK Isoprene 5x - UK Isoprene TORCH campaign EMEP4UK Base run
b) -20
-10 0 10 20 30 40 50
1 2 3 4 5 6 7 8 9 10 11 12 13 14 15
Δ
O3
/
p
p
b
no - UK Isoprene
2x - UK Isoprene 5x - UK Isoprene
Fig. 11.As for Fig. 8 but for model sensitivity experiments varying
the emissions of biogenic isoprene (none, 2×, 5×).
and the vertical resolution of the model may not be adequate to simulate fully the vertical distribution of isoprene. De-spite the above-noted complexities, Fig. 10 shows that the EMEP4UK model was able to simulate isoprene at the Writ-tle site to within a factor of 3 with respect to observations. It should also be noted that the EMEP4UK model currently does not include estimates of any anthropogenic emissions of isoprene.
The vertical resolution of the model (lowest level thick-ness ca. 90 m) also has strong implications for the compar-ison of modelled versus observed isoprene concentrations. However, the timescale for mixing in unstable boundary lay-ers is typically much less than the oxidation-lifetime of iso-prene to OH (order 1 h during daytime), so the model resolu-tion should be adequate for the task. Similar issues apply to NOxalso, which also has mainly surface sources and chemi-cal loss slower than mixing times.
It should also be noted that the biogenic emission inven-tory available to this study has a resolution of 50×50 km2, which likely leads to uncertainties in the spatial allocation of isoprene concentrations as applied here. However, isoprene inventories are inherently uncertain, requiring species-level coverage of vegetation which is rarely available (even in the UK), and with different studies suggesting widely different emission factors to be applied (Simpson et al., 1999; Rinne et al., 2009; Stewart et al., 2003).
0.0 0.1 0.2 0.3 0.4 0.5 0.6 0.7 0.8
01 02 03 04 05 06 07 08 09 10 11 12 13 14 15
August 2003 / day
is
opre
ne / ppb
-1000 -800 -600 -400 -200 0 200 400 600 800 1000
mi
xi
ng he
ight
/
m
45 m 250 m 650 m Hmix
Fig. 12.Time series of modelled hourly isoprene (ppb) for the first,
third and fifth level of the EMEP4UK model (mid-level altitudes in-dicated in the legend) at Writtle for the first 15 days of August 2003 (bottom graph, left hand scale). Modelled boundary layer mixing height (m) is also shown (upper trace, right hand scale).
An interesting feature of surface isoprene was a double peak in the morning and evening, with the latter peak gen-erally higher. This feature (also found by Steinbacher et al., 2005) was present in both observations and simulated iso-prene concentrations, as seen in Figs. 10 and 12. OH is un-derstood to be the cause of the mid-day dip in isoprene con-centrations while the afternoon decline in OH concentration (and hence isoprene loss rate), and increased afternoon tem-peratures (hence higher isoprene emissions) are the cause of the higher evening peak in isoprene concentrations. Another potentially important contribution to the second peak may be the reduction of the mixing height after sunset (Fig. 12), which will act to limit vertical mixing and dilution. The mix-ing height and OH-levels are decreasmix-ing at the same time in the evening, thus a combination these two factors may be the cause of the evening isoprene peaks. An interesting day in the period under study here is the 1st August. Here the modelled surface isoprene concentration is still high around midnight. This is likely related to almost complete depletion of ozone in the nocturnal boundary layer in the model (i.e. Fig. 11). When surface ozone is depleted there is no loss of isoprene through the isoprene + ozone reaction or the NO3+ isoprene reaction.
Our results can also be compared to those of Curci et al. (2009), who estimated that BVOC emissions contribute 0–4 ppb towards the maximum daily ozone for the summer (June-July-August) of 2003 in the UK. This is reasonably consistent with our results: we find an EMEP4UK domain average contribution for August of∼1 ppb for the base sim-ulation, and∼3 ppb for the case with 5×isoprene emissions (Fig. 11).
emissions will affect ozone, often with similar dependen-cies on temperature to isoprene. However, tests with a re-search version of the EMEP model (Simpson et al., 2007a) which includes monoterpene emissions, as well as the study of Curci et al. (2009), both suggest that isoprene emissions are a much more important factor than monoterpene emis-sions for ozone formation in NW Europe, and in any case the effects of monoterpenes should fall within the range of uncertainty we have explored here for isoprene.
The large uncertainties in isoprene emission estimates clearly affect model calculations, and emphasise the need for improved inventories of this important compound as well as of other BVOC compounds.
4.2.4 Anthropogenic NOx
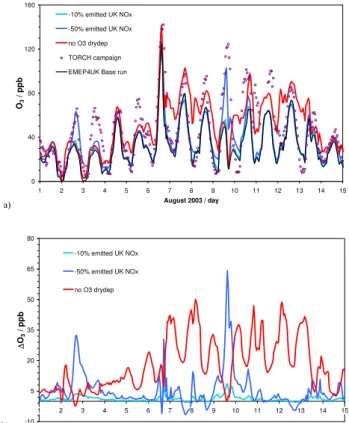
The impact of decreasing UK anthropogenic NOxemissions by 10% and 50% on modelled surface ozone at Writtle is shown in Fig. 13. This impact varies substantially in both cases across the 15 days in August. As with NMVOC emis-sions, a decrease in UK NOxemissions affects a few days on which high ozone concentrations were simulated (Fig. 4c). Reducing NOxemissions by 10% and 50% enhances the sur-face concentration of ozone by up to 9 ppb and 65 ppb, re-spectively, on 9 August, and up to 4 ppb and 32 ppb, respec-tively, on 2 August, whilst on other days it has less impact (Fig. 13a). On some days both 10% and 50% reduction in NOxemissions leads to increased ozone, a result of the well-known titration effect and NOx-VOC relationships in high-NOxconditions (Sillman et al., 1990; Simpson et al., 1995). The impact on O3 at Writtle acts in the same direction in both cases (10% and 50% reduction in NOx emissions) for all the days showing little evidence of non-linearity between the 10% and 50% experiments.
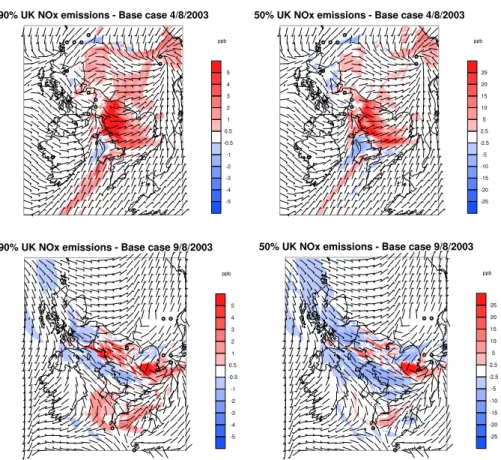
Figure 14 show maps of the impacts of these NOx reduc-tions on changes in daily maximum surface O3 for the 4 and 9 August 2003 across the UK. For most locations across the UK, and on most days, reducing NOx emissions leads to higher O3 levels (red colours on Fig. 14). This is es-pecially true for locations downwind of large NOxsources (e.g., large urban centres, such as London and Birmingham). This is indicative of the VOC-limited O3production regime (e.g., see Fig. 3.3a of Royal Society, 2008). In this regime, increases in NOx lead to reductions in O3production. For typical mid-latitude conditions, peak O3 production occurs at around 1 ppb NOx. This NOx level for peak O3 produc-tion increases as VOC levels increase. This is particularly relevant during the August 2003 heatwave, as on hotter days, biogenic VOC emissions increase, pushing the position of peak ozone production to higher NOxlevels, and potentially moving some parts of the UK out of the VOC-limited regime and into the NOx-limited regime. These regions are the blue regions of Fig. 14 where EMEP4UK simulates less O3when NOx emissions are reduced. These regions tend to be sites more remote from NOxemissions (e.g., parts of Wales and
a)
0 40 80 120 160
1 2 3 4 5 6 7 8 9 10 11 12 13 14 15
August 2003 / day O3
/
ppb
-10% emitted UK NOx -50% emitted UK NOx no O3 drydep TORCH campaign EMEP4UK Base run
b) -10
5 20 35 50 65 80
1 2 3 4 5 6 7 8 9 10 11 12 13 14 15
Δ
O3
/ ppb
-10% emitted UK NOx -50% emitted UK NOx no O3 drydep
Fig. 13. As for Fig. 8 but for model sensitivity experiments with
−10% (pale blue) and−50% (blue) UK anthropogenic NOx
emis-sions and with zero O3dry deposition (red).
Scotland on 4 August – Fig. 14). These regions of NOx-limitation are also slightly more widespread in the 50% re-duction case – this is simply because more regions pass over the peak in the O3production curve when there is a larger NOx reduction. More regions of NOx-limitation emerge on hotter days during the heatwave (compare 4 and 9 August on Fig. 14 – the 9 was hotter – see Fig. 1); as explained above, these are days with higher VOC levels.
We also show wind speed and wind direction in Fig. 14. The low wind speed and variable wind directions are clearly seen in red region where reducing NOxleads to higher O3.
Fig. 14.Change in simulated surface daily maximum ozone (ppb) relative to the base case scenario for the sensitivity experiment with 10%
(left) and 50% (right) reduction of the UK anthropogenic NOxemissions, for two days, 4 (upper panels) and 9 August (lower panels). The
12:00 10 m wind is also shown.
ozone declines as NOxincreases (i.e. most1O3/1NOx val-ues are negative), indicative of a VOC-limited regime. At times of lower background NOx, additional NOxsometimes leads to increases in O3– this is seen most often at the more rural site – indicating a NOx-limited regime. There is not a single value for background NOx where the switch from NOx-limited to VOC-limited occurs (this will be a function of several other variables, e.g. VOC levels), but the regime is clearly VOC-limited above∼8 ppb NOx, and NOx-limited below ∼0.5 ppb NOx. This is broadly consistent with the schematic figure presented in the Royal Society report dis-cussed above.
These sensitivity tests further support the conclusion that the deviations between modelled and observed O3were par-ticularly related to uncertainties in local patterns of calcu-lated NOxconcentrations, which may be related to local un-certainties in the NOxemission data. Figure 14 highlights the area affected by the London plume. The location of Writtle is on the edge of the London plume and is therefore highly sensitive to small errors in modelled location of the plume. This is illustrated by the fact that on 9 August the model performed well for the two sites Wicken Fen and London Eltham, which were well outside and inside the London NOx
plume, respectively. The model does not agree well with observed NO2 at Writtle for the first 9 days of August, but shows better agreement for the remaining days included in this study (Fig. 16).
-5 0 5 10 15 20
0.01 0.1 1 10 100
NOx / ppb
Δ
O3 /Δ
NO
x
Wicken Fen TORCH London Eltham
Δ Δ Δ
Fig. 15.Hourly modelled values at three sites (Wicken Fen – green;
Writtle – blue; and London Eltham – red) for the whole of August
of the ratio1O3/1NOx(where1is the change in mixing ratio
be-tween the base experiment and the 50% NOxreduction experiment),
plotted as a function of base experiment NOx.
0 10 20 30 40 50 60
01 02 03 04 05 06 07 08 09 10 11 12 13 14 15
August 2003 / day
NO
2
/ p
p
b
TORCH campaign EMEP4UK
Fig. 16. Hourly time-series of modelled (red) and observed (blue)
surface NO2(ppb) during August 2003 at Writtle.
4.2.5 Ozone dry deposition
Dry deposition of ozone is a major factor controlling the magnitude of surface ozone concentrations, and during the extreme conditions of August 2003 there is a possibility that uptake to vegetation was severely restricted, as stomatal de-position is a strong function of temperature, humidity, and sunlight (Emberson et al., 2001; Simpson et al., 2007b). The impact of switching off UK ozone dry deposition (both stom-atal and non stomstom-atal) is also shown in Fig. 13. This model change had a comparatively large impact on surface ozone throughout the simulation period, particularly at night time when surface ozone increases up to 50 ppb.
Suppressing dry deposition in the model generally in-creased surface ozone, as expected, although there were two points on 2 August when ozone was reduced in the late af-ternoon/early evening (Fig. 13). This must have been due to the earlier, enhanced levels of O3 influencing the
abun-a)
0 40 80 120 160
1 2 3 4 5 6 7 8 9 10 11 12 13 14 15
August 2003 / day O3
/ pp
b
fix boundary condition TORCH campaign EMEP4UK Base run
b) -100
-75 -50 -25 0 25
1 2 3 4 5 6 7 8 9 10 11 12 13 14 15
Δ
O3
/
p
p
b
fix boundary condition
Fig. 17.As for Fig. 8, but for the model sensitivity experiment with
fixed (climatological) O3at the boundary of the EMEP4UK inner
domain.
dance of O3 precursors to such an extent that although de-position was switched off, O3levels fell below those in the control simulation. Our results show clearly that in general, turning off ozone dry deposition increases modelled ozone concentrations. In the case of the anomalous two-hour pe-riod, NO2was also overestimated compared with the mea-surements. This suggests a temporal interaction between O3 dry deposition and NO concentrations may have occurred, whereby previous higher O3concentrations (as a result of no model dry deposition), had depleted the modelled NO levels, thereby briefly limiting the potential for O3formation.
Fig. 18.Change in simulated surface daily maximum ozone (ppb) relative to the base case scenario for the sensitivity experiment with fixed
(climatological) boundary condition for O3, for 6 and 10 August 2003. The 12:00 10 m wind is also shown.
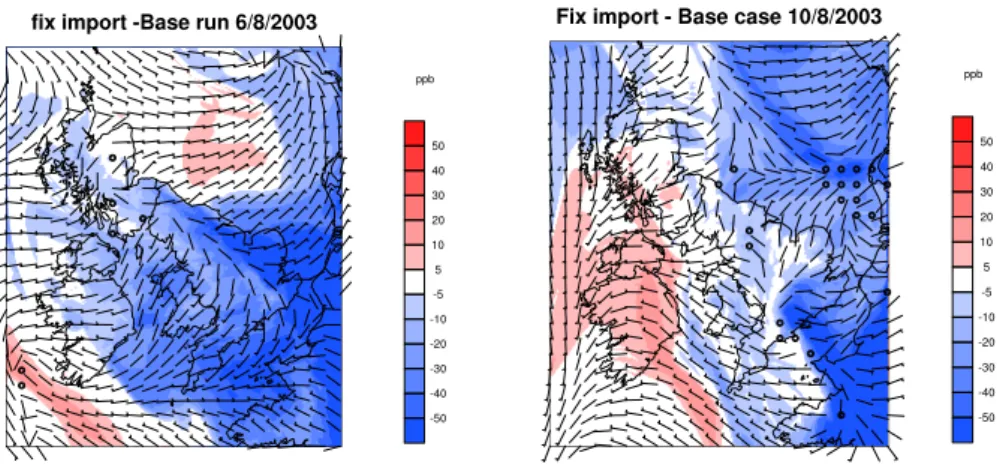
4.2.6 UK import
In the final sensitivity experiment, the ozone boundary conditions for the inner domain (5×5 km2 region) of the EMEP4UK model were fixed to climatological values (32 ppb – Logan, 1999) for the whole month, rather than using output from the larger scale 50×50 km2 runs. The results of this sensitivity test (Fig. 17) show that in August 2003 surface ozone concentrations were strongly influenced by import on most days, especially in SE England (Fig. 18). Import contributed up to 85 ppb. For example, most of the ozone present at Writtle on the 6 August was generated and imported from outside the EMEP4UK inner domain.
Correct boundary conditions are very important to ac-curately calculate UK surface ozone and previous work has demonstrated that European transport and trans-Atlantic transport are well simulated by the EMEP model (e.g. Jon-son et al., 2006). Figures 17 and 18 show that the import of ozone from outside the UK was typically the most im-portant factor contributing to the very high surface ozone in SE England during August 2003. Import is important on different days at different locations (Fig. 18). This is evi-dent for the 6 and 10 August (Fig. 18) when localised in-cursions of European-emitted precursors and/or ozone itself were present. This agrees with Solberg et al. (2008), who re-ported that the higher values of ozone observed over SE Eng-land were often the result of import from the continent. How-ever, one of the conclusions in Solberg et al. (2008) was that Portuguese forest fires were a possible cause for the unusu-ally high surface ozone over Europe. The EMEP4UK model was able to simulate high surface ozone without emissions from forest fires, further development of the EMEP model to include forest fire emissions should be undertaken in order to properly assess their impact on ozone over the UK.
Overall, however, it has been shown that, during the TORCH campaign at Writtle, the high level of ozone ob-served was not created within the model domain of the British Isles, but imported from continental Europe. Fig-ure 18 highlights this clearly on the 6 of August where an incursion of European ozone was present in SE England. The simulations of Solberg et al. (2008) showed a cluster of high ozone concentrations (>90 ppb) near the border be-tween France and Germany on this date. The implication is that ozone produced in this region was thereafter advected over the UK. High resolution modelling is also critical as this type of incursion may influence a small area (<100 km2)as can be seen in Fig. 18 for the 10 August.
5 Summary and conclusions
For the first time a derivative of the EMEP Unified model (EMEP4UK) has been successfully applied to the UK at an enhanced horizontal resolution of 5×5 km2to simulate sur-face ozone, and been driven by the WRF model instead of the HIRLAM model used to drive the Unified model. Par-ticular attention has been given to the site at Writtle, where the TORCH campaign made extensive atmospheric measure-ments, and at two nearby rural and urban background sites.
it is intermittently exposed to the plume of pollution emanat-ing from greater London and its proximity to the coast. Both these factors contribute to steep spatial gradients in meteo-rology and air pollutants near the site (Figs. 6 and 7). Nev-ertheless, model performance is sufficiently good for us to use model results for the site, together with the detailed cam-paign measurements, to investigate the origins of ozone dur-ing the heat-wave.
A series of sensitivity experiments were performed with the model, repeatedly simulating the heat-wave period (Ta-ble 1). In each experiment an individual model parame-ter/input was varied across the EMEP4UK domain, in order to isolate and quantify its influence on ozone. Uniformly in-creasing surface temperature by 5 K led to increases in ozone at Writtle of up to 9 ppb on certain days; decreasing temper-ature by the same amount induced similar magnitude ozone reductions (Fig. 8).
The main influence of temperature on ozone is via bio-genic isoprene; doubling isoprene emissions produced a sim-ilar response to increasing temperature by 5 K (Fig. 11). Re-moving isoprene emissions, or multiplying them by five, in-duced ozone responses that indicate a broadly linear response of ozone to the magnitude of isoprene emissions on specific days (Fig. 11). Isoprene concentrations at Writtle show sig-nificant day-to-day variability, and this is partly captured by the model (Fig. 10). Overall during the heat-wave, we found that doubling baseline isoprene emissions produced the best fit to observations, although on some days the 5×experiment was best.
Days with the highest sensitivity of ozone to isoprene (6, 9 and 10 August) were days with high isoprene levels, al-though other days with similarly high isoprene levels (4 and 5 August) showed much lower sensitivity. This sensitivity is a function of coincident NOxlevels; relative amounts of NOxand VOC determine whether ozone production is NOx-limited or VOC-NOx-limited. These changes in ozone production regime are clearly shown with results from sensitivity ex-periments that reduced anthropogenic NOxemissions. Fig-ure 14 shows the influence of these NOxreductions on sur-face ozone across the model domain for 4 and 9 August. On the 4th, winds at Writtle were from the East, and the ozone production regime is not strongly VOC-limited, hence the low sensitivity of ozone to isoprene emissions on this day. In contrast on the 9th, winds are lighter, Writtle is within the London plume, the ozone production regime is VOC-limited, and consequently there is a higher sensitivity of ozone to iso-prene emissions. The ozone production regime at Writtle is generally VOC-limited, like London, but occasionally is NOx-limited, like the more rural Wicken Fen site (Fig. 15). Experiments varying anthropogenic NMVOC emissions also show strong day-to-day variations in the sensitivity of ozone at Writtle (Fig. 9), again illustrating the importance of the prevailing ozone production regime.
Switching off the biophysical process of dry deposition across the UK increases ozone at Writtle by up to 50 ppb, and improves the fit to observed ozone on some days (Fig. 13). The influence on ozone on most heat-wave days is ∼20– 35 ppb, although on some days there is much less impact (e.g. 9 August).
Setting ozone at the model boundaries to a climatological value, rather than allowing it to vary, shows that import of ozone from outside the EMEP4UK domain typically con-tributes ∼15–20 ppb to ozone levels at Writtle, but up to 85 ppb on 6 August (Figs. 17 and 18).
In summary, we find that multiple important influences contributed to the elevated ozone over SE England during the August 2003 heat-wave. Our simulations indicate that differ-ent processes dominated at differdiffer-ent times, with local bio-genic and anthropobio-genic emissions important on some days, whilst import from Europe and suppression of dry deposition were important on other days. All these processes need to be simulated accurately in order to fully understand the episode.
Acknowledgements. This work is supported jointly by the UK
Department for Environment Food and Rural Affairs (Defra), the Centre for Ecology and Hydrology (CEH), the Natural Environ-ment Research Council (NERC) under its EnvironEnviron-ment and Health Programme (Grant NE/E008593/1), the EMEP programme under the UNECE LRTAP Convention, and the Norwegian Meteorolog-ical Institute (Met.No), and provides a contribution to the work of the NitroEurope Integrated Project (Verification Component) funded by the European Commission. We gratefully acknowledge travel support from the COST 729 action and the European Science Foundation NinE programme.
Edited by: A. S. H. Prevot
References
Andersson-Skold, Y. and Simpson, D.: Comparison of the chemical schemes of the EMEP MSC-W and IVL photochemical trajec-tory models, Atmos. Environ., 33, 1111–1129, 1999.
Andreani-Aksoyoglu, S., Keller, J., Prevot, A. S. H.,
Bal-tensperger, U., and Flemming, J.: Secondary aerosols in
Switzerland and northern Italy: Modeling and sensitivity stud-ies for summer 2003, J. Geophys. Res.-Atmos., 113, D06303, doi:10.1029/2007JD009053, 2008.
Baertsch-Ritter, N., Keller, J., Dommen, J., and Prevot, A. S. H.: Effects of various meteorological conditions and spatial
emis-sionresolutions on the ozone concentration and ROG/NOx
lim-itationin the Milan area (I), Atmos. Chem. Phys., 4, 423–438, doi:10.5194/acp-4-423-2004, 2004.
Baertsch-Ritter, N., Prevot, A. S. H., Dommen, J., Andreani-Aksoyoglu, S., and Keller, J.: Model study with uam-v in the milan area (i) during PIPAPO: Simulations with changed emis-sions compared to ground and airborne measurements, Atmos. Environ., 37, 4133–4147, 2003.
Chaxel, E. and Chollet, J. P.: Ozone production from Grenoble city during the August 2003 heat wave, Atmos. Environ., 43, 4784– 4792, 2009.
Cox, R., Eggleton, A., Derwent, R., Lovelock, J., and Pack, D.: Long range transport of photochemical ozone in North-Western Europe, Nature, 255, 118–121, 1975
Curci, G., Beekmann, M., Vautard, R., Smiatek, G., Steinbrecher, R., Theloke, J., and Friedrich, R.: Modelling study of the impact of isoprene and terpene biogenic emissions on European ozone levels, Atmos. Environ., 43, 1444–1455, 2009.
Dore, C. J., Murrells, T. P., Passant, N. R., Hobson, M. M., Thistlethwaite, G., Wagner, A., Li, Y., Bush, T., King, K. R., Norris, J., Coleman, P. J., Walker, C., Stewart, R. A., Tsagatakis, I., Conolly, C., Brophy, N. C. J., and Hann, M. R.: UK Emissions of Air Pollutants 1970 to 2006, AEA Energy & Environment, Harwell, Oxfordshire, 2008.
Emberson, L., Ashmore, M., Simpson, D., Tuovinen, J.-P., and Cambridge, H.: Modelling and mapping ozone deposition in Eu-rope, Water Air Soil Pollut., 130, 577–582, 2001.
Fagerli, H., Simpson, D., and Tsyro, S.: Transboundary acidifica-tion, eutrophication and ground level ozone in Europe, EMEP Status Report 1/2004, Unified EMEP model: Updates, The Nor-wegian Meteorological Institute, Oslo, Norway, 11–18, 2004. Gardner, R. M., Adams, K., Cook, T., Deidewig, F., Ernedal, S.,
Falk, R., Fleuti, E., Herms, E., Johnson, C. E., Lecht, M., Lee, D. S., Leech, M., Lister, D., Masse, B., Metcalfe, M., Newton, P., Schmitt, A., Vandenbergh, C., and VanDrimmelen, R.: The
ANCAT/EC global inventory of NOx emissions from aircraft,
Atmos. Environ., 31, 1751–1766, 1997.
Guicherit, R. and van Dop, H.: Photochemical production of ozone in Western Europe and its relation to meteorology 1971–1975, Atmos. Environ., 11, 145–155, 1977
Guenther, A. B., Zimmerman, P. R., Harley, P. C., Monson, R. K. and Fall, R.: Isoprene and monoterpene emission rate variabil-ity: model evaluations and sensitivity analyses, J. Geophys. Res., 98(D7), 12609–12617, 1993.
Guenther, A., Hewitt, C., Erickson, D., Fall, R., Geron, C., Graedel, T., Harley, P., Klinger, L., Lerdau, M., McKay, W., Pierce, T., Scholes, R., Steinbrecher, R., Tallamraju, R., Taylor, J., and Zim-merman, P.: A global model of natural volatile organic com-pound emissions, J. Geophys. Res., 100(D5), 8873–8892, 1995. Hellsten, S, Dragosits, U., Place, C. J, Vieno, M, Dore, A. J,
Mis-selbrook, T. H., Tang Y. S., and Sutton, M. A.: Modelling the spatial distribution of ammonia emissions in the UK, Environ. Pollut., 154, 370–379, 2008.
Jenkin, M. E., Davies, T. J., and Stedman, J. R, The origin and day-of-week dependence of photochemical ozone episodes in the UK, Atmos. Environ., 36, 999–1012, 2002
Jonson, J. E., Simpson, D., Fagerli, H., and Solberg, S.: Can we ex-plain the trends in European ozone levels?, Atmos. Chem. Phys., 6, 51–66, doi:10.5194/acp-6-51-2006, 2006.
Jonson J. E., Tarrason L., Wind P., Gauss M., Valiyaveetil S. S., Tsyro S., Klein H., Isaksen S. A. I., and Benedictow A.: First evaluation of the global EMEP model and comparison with the global OsloCTM2 model. EMEP/MSC-W Technical Report 2/07. Norwegian Meteorological Institute, Blindern. Norway, 2007.
Jonson, J. E. and Travnikov, O. (eds.): Development of the
EMEP global modeling framework: Progress report; Joint
MSC-W/MSC-E Report. EMEP/MSC-W Technical Report 1/2010. Norwegian Meteorological Institute, Blindern, Norway, 2010.
K¨ohler, I., Sausen, R., and Klenner, G.: NOx production from
lightning, in: The impact of NOxemissions from aircraft upon
the atmosphere at flight altitudes 8-15 km (AERONOX), edited by: Schumann, U., final report to the Commission of the Eu-ropean Communities, Deutch Luft und Raumfart, Oberpfaffen-hofen, Germany, 1995.
Lee, J. D., Lewis, A. C., Monks, P. S., Jacob, M., Hamilton, J. F., Hopkins, J. R., Watson, N. M., Saxton, J. E., Ennis, C., Carpen-ter, L. J., Carslaw, N., Fleming, Z., Bandy, B. J., Oram, D. E., Penkett, S. A., Slemr, J., Norton, E., Rickard, A. R., Whalley, L. K., Heard, D. E., Bloss, W. J., Gravestock, T., Smith, S. C., Stan-ton, J., Pilling, M. J., and Jenkin, M. E.: Ozone photochemistry and elevated isoprene during the UK heatwave of August 2003, Atmos. Environ., 40, 7598–7613, 2006.
Logan, J. A.: An analysis of ozonesonde data for the troposhere: Recommendations for testing 3-d models and development of a gridded climatology for troposheric ozone, J. Geophys. Res., 104(D13), 16115–16149, 1999.
Metzger, S., Dentener, F., Pandis, S., and Lelieveld, J.: Gas/aerosol partitioning: 1. A computationally efficient model, J. Geophys. Res.-Atmos., 107(D16), 4312, doi:10.1029/2001JD001102, 2002.
Ord´o˜nez, C., Mathis, H., Furger, M., Henne, S., H¨uglin, C., Stae-helin, J., and Pr´evˆot, A. S. H.: Changes of daily surface ozone maxima in Switzerland in all seasons from 1992 to 2002 and dis-cussion of summer 2003, Atmos. Chem. Phys., 5, 1187–1203, doi:10.5194/acp-5-1187-2005, 2005.
Rinne, J., Back, J., and Hakola, H.: Biogenic volatile organic com-pound emissions from the eurasian taiga: Current knowledge and future directions, Boreal Environ. Res., 14, 807–826, 2009. Royal Society: Ground-level ozone in the 21st century: future
trends, impacts and policy implications, RS Policy document 15/08, London, 2008.
Sch¨ar, C. and Jendritzky, G.: Climate change: Hot news from sum-mer 2003, Nature, 432, 559–560, 2004.
Seco, R., Penuelas, J., and Filella, I.,: Short-chain oxygenated VOCs: Emission and uptake by plants and atmospheric sources, sinks, and concentrations, Atmos. Environ., 41, 2477–2499, 2007
Sillman, S. and Samson, F. J.: Impact of temperature on oxi-dant photochemistry in urban, polluted rural and remote envi-ronments, J. Geophys. Res.-Atmos., 100, 11497–11508, 1995. Sillman, S.; Logan, J., and Wofsy, S.: The sensitivity of ozone to
nitrogen oxides and hydrocarbons in regional ozone episodes, J. Geophys. Res.-Atmos., 95, 1837–1851, 1990
Simpson, D. Biogenic emissions in Europe 2: Implications for ozone control strategies, J. Geophys. Res.-Atmos., 100, 22891– 22906, 1995
Simpson, D., Winiwarter, W., Borjesson, G., Cinderby, S., Ferreiro, A., Guenther, A., Hewitt, C. N., Janson, R., Khalil, M. A. K., Owen, S., Pierce, T. E., Puxbaum, H., Shearer, M., Skiba, U., Steinbrecher, R., Tarrason, L., and Oquist, M. G.: Inventory-ing emissions from nature in Europe, J. Geophys. Res.-Atmos., 104(D7), 8113–8152, 1999.
Description. EMEP/MSC-W Report 1/03, Norwegian Meteoro-logical Institute, Blindern, Norway, 2003a.
Simpson, D., Tuovinen, J.-P., Emberson, L. D., and Ashmore, M. R.: Characteristics of an ozone deposition module II: Sensitivity analysis, Water Air Soil Pollut., 143, 123–137, 2003b.
Simpson, D., Yttri, K., Klimont, Z., Kupiainen, K., Caseiro, A., Ge-lencs´er, A., Pio, C., and Legrand, M.: Modeling Carbonaceous Aerosol over Europe. Analysis of the CARBOSOL and EMEP EC/OC campaigns, J. Geophys. Res.-Atmos., 112, D23S14, doi:10.1029/2006JD008158, 2007a.
Simpson, D., Emberson, L., Ashmore, M., and Tuovinen, J.: A comparison of two different approaches for mapping potential ozone damage to vegetation. A model study, Environ. Pollut., 146, 715–725, doi:10.1016/j.envpol.2006.04.013, 2007b. Solberg, S., Hov, O., Sovde, A., Isaksen, I. S. A., Coddeville, P.,
De Backer, H., Forster, C., Orsolini, Y., and Uhse, K.: European surface ozone in the extreme summer 2003, J. Geophys. Res.-Atmos., 113, D07307, doi:10.1029/2007JD009098, 2008. Stedman, J. R.: The predicted number of air pollution related deaths
in the UK during the August 2003 heatwave, Atmos. Environ., 38, 1087–1090, 2004.
Steinbacher, M., Dommen, J., Ordonez, C., Reimann, S., Gruebler, F., Staehelin, J., Andreani-Aksoyoglu, S., and Prevot, A. S. H.: Volatile organic compounds in the Po basin. Part B: Biogenic VOCs, J. Atmos. Chem., 51, 293–315, 2005.
Stewart, H. E., Hewitt, C. N., Bunce, R. G. H., Steinbrecher,
R., Smiatek, G., and Schoenemeyer, T.: A highly
spa-tially and temporally resolved inventory for biogenic isoprene and monoterpene emissions: Model description and applica-tion to Great Britain, J. Geophys. Res.-Atmos., 108, 4644, doi:10.1029/2002JD002694, 2003.
Tarrason, L., Turner, S., and Floisand, I.: Estimation of Sea-sonal Dimethyl Sulfide Fluxes over the North-Atlantic Ocean and Their Contribution to European Pollution Levels, J. Geophys. Res.-Atmos., 100, 11623–11639, 1995.
Tressol, M., Ordonez, C., Zbinden, R., Brioude, J., Thouret, V., Mari, C., Nedelec, P., Cammas, J.-P., Smit, H., Patz, H.-W., and Volz-Thomas, A.: Air pollution during the 2003 European heat wave as seen by MOZAIC airliners, Atmos. Chem. Phys., 8, 2133–2150, doi:10.5194/acp-8-2133-2008, 2008.
Trigo, R. M., Garcia-Herrera, R., Diaz, J., Trigo, I. F., and
Valente, M. A.: How exceptional was the early August
2003 heatwave in France?, Geophys. Res. Lett., 32, L10701, doi:10.1029/2005GL022410, 2005.
Vautard, R., Honore, C., Beekmann, M., and Rouil, L.: Simulation of ozone during the August 2003 heat wave and emission control scenarios, Atmos. Environ., 39, 2957–2967, 2005.
Vieno, M., Dore, A. J., Wind, P., Di Marco, C., Nemitz, E., Phillips, G., Tarrason, L., and Sutton, M. A.: Application of the EMEP Unified Model to the UK with a Horizontal Resolution of
5×5 km2, Atmospheric Ammonia - Detecting Emission Changes