ABSTRACT:Objective: To analyze the regional diferences and factors associated with physical activity during the leisure time in the adult participants of the National Health Survey, 2013. Methods: This study was carried out with the data from the National Health Survey, conducted in 2013 with an approximate sample of 63,000 adults (18+ years). For each of the ive regions of Brazil, the prevalence of physically active adults during the leisure time was calculated, and the participants were classiied as active if they practiced at least 150 minutes per week of physical activity during leisure time. Results: The prevalence of individuals who were active during the leisure time varied from 21.9% in the south to 24.4% in the midwest. The men were 1.48 (95%CI 1.40‑1.57) times more active than women, with the northern region showing the highest diference between the sexes. The prevalence of active individuals was 67% lower among those aged 75+ years when compared with the 18–24 age group, and this diference was more marked in the north. Those with higher levels of education were on average three times more active than the participants with lower education levels. In terms of education level, the lowest diference was observed in the northeast. Conclusion: Despite the slight variations in the prevalence of physical activity during the leisure time among the regions, when population subgroups are considered, important diferences were observed. These results suggest the need for promotion initiatives on physical activity with diferent approaches in each of the ive regions of Brazil.
Keywords: Motor activity. Health promotion. Health surveys. Chronic diseases. Sports. Leisure activities. Health services accessibility.
Regional diferences and correlates of leisure
time physical activity in Brazil: results from
the Brazilian National Health Survey-2013
Diferenças regionais e fatores associados à prática de atividade física
no lazer no Brasil: resultados da Pesquisa Nacional de Saúde-2013
Grégore Iven MielkeI,II,III, Deborah Carvalho MaltaII,IV, Gisele Balbino Araújo Rodrigues de SáII, Rodrigo Siqueira ReisV, Pedro Curi HallalI,III,VI
ORIGINAL ARTICLE / ARTIGO ORIGINAL
IGraduate Program in Epidemiology, Universidade Federal de Pelotas – Pelotas (RS), Brazil. IIDepartment of Health Surveillance – Brasília (DF), Brazil.
IIIPhysical Activity Epidemiology Study Group, Universidade Federal de Pelotas – Pelotas (RS), Brazil. IVUniversidade Federal de Minas Gerais – Belo Horizonte (MG), Brazil.
VGraduate Program in Urban Management, Pontifícia Universidade Católica do Paraná – Curitiba (PR), Brazil. VIGraduate Program in Physical Education, Universidade Federal de Pelotas – Pelotas (RS), Brazil.
Corresponding author: Grégore I Mielke. Programa de Pós-Graduação em Epidemiologia, Universidade Federal de Pelotas. Rua Marechal Deodoro, 1160, 3º piso. CEP: 96020-220. Pelotas (RS), Brasil. E-mail: gregore.mielke@gmail.com
INTRODUCTION
Owing to circulatory diseases being the leading cause of death in Brazil1,2, the promotion
of physical activity has integrated the agenda for the ight against chronic noncommunica‑ ble diseases adopted by the country in recent years3,4. Thus, from the perspective of health
management, knowing the existing physical activity standard and the population groups most at risk for this condition is very important. Several studies have investigated the demo‑ graphic, environmental, and behavioral determinants and correlates of physical activity in diferent geographical locations and regions. In general, these studies have shown that men, young adults, and those with higher education levels are the population groups with the highest prevalence of physical activity during leisure time5,6.
Research on physical activity in Brazil, especially on correlates and description of prevalence, is vast7‑9. However, despite the large number of studies, there are still gaps
in this area, especially in relation to the north and midwest regions7. With the comple‑
tion of the National Health Survey (PNS), it became possible to compare the physical activity patterns across regions and, therefore, understand any differences between the population groups. In addition, the evaluation of these differences is essential to guide and support the development of promotion policies and programs for physical activity in the three levels of management, in order to meet the needs and specificities of the population in different regions.
RESUMO:Objetivo: Analisar as diferenças regionais e os fatores associados à prática de atividade física no lazer em adultos participantes da Pesquisa Nacional de Saúde, de 2013. Métodos: Este estudo foi realizado com os dados da Pesquisa Nacional de Saúde, realizada em 2013 com uma amostra aproximada de 63.000 adultos (18+ anos). Para cada uma das cinco regiões do Brasil foi calculada a prevalência de adultos ativos no lazer, sendo classiicados como ativos aqueles participantes que praticaram pelo menos 150 minutos por semana de atividades físicas no lazer.
Resultados: A prevalência de ativos no lazer variou de 21,9% no Sul a 24,4% no Centro‑Oeste. Homens foram 1,48 (IC95% 1,40 – 1,57) vezes mais ativos que as mulheres, sendo a região Norte aquela que apresentou maior diferença entre sexos. A prevalência de ativos foi 67% menor entre aqueles com 75+ anos quando comparado ao grupo de 18‑24 anos, sendo que esta diferença foi mais acentuada na região Norte. Aqueles com maior grau de instrução foram, em média, três vezes mais ativos que os participantes com menor grau de instrução. Em termos de grau de instrução, a menor diferença observada ocorreu no Nordeste. Conclusões: Apesar das pequenas variações na prevalência de prática de atividade física no lazer entre as regiões, quando são considerados subgrupos populacionais, diferenças importantes são observadas. Estes resultados sugerem a necessidade de ações de promoção de atividade física com diferentes abordagens em cada uma das cinco regiões do Brasil.
Thus, this study aimed to analyze the regional diferences and the factors associated with physical activity in leisure time among the adult participants of the 2013 National Health Survey.
METHODS
To conduct this study, we used information collected from the National Health Survey (PNS), which was designed and conducted by means of a partnership between the Ministry of Health and the Brazilian Institute of Geography and Statistics (IBGE). This is a home‑based survey and is part of IBGE’s Integrated Household Survey System, being the baseline for monitoring of noncommunicable diseases and disorders and its risk factors in Brazil.
Methodological, operational, and logistical details of PNS can be obtained on the oi‑ cial survey report10. Briely, the sampling process conducted in the PNS targeted adults aged
18 years or older, living in private households in Brazil, with the exception of adults living in barracks, military bases, lodges, camps, boats, prisons, penal colonies, nursing homes, orphanages, convents, and hospitals, as its population. The sample selection was done in three stages, with census tracts, households, and residents aged 18 years or older as pri‑ mary, secondary, and tertiary units, respectively. For each selected household, one adult aged 18 years or older was interviewed and selected equiprobabilistically among all adults living in the household. The selected adults answered three questionnaires, one containing information on the household, another with information on the health status of the other residents, and a questionnaire on lifestyle and health status, in which issues related to phys‑ ical activity, were incorporated.
To measure the physical activity during leisure time, the following questions were used:
1. “In the last three months, did you practice some form of physical exercise or sport?”;
2. “What is the main type of exercise or sport that you practiced?”;
3. “Do you practice the exercise at least once a week?”;
4. “How many days per week do you practice physical exercise or a sport?” and
5. “On the day that you practice the exercise or sport, how long does this activity last?”
Initially, for each of the ive major regions, the prevalence of participants who were active during leisure time was calculated according to sex (male and female), age groups (18 – 24; 25 – 34; 35 – 44; 45 – 54; 55 – 64 ; 65 – 74; and 75+ years), and education level; it was classiied as
• Grade I – uneducated and incomplete primary education;
• Grade II – complete primary and incomplete secondary education;
• Grade III – complete secondary and incomplete superior education;
• Grade IV – complete superior education.
To compare the degree of diference between the practice of physical activity during lei‑ sure time between age groups and education levels, we used the equiplot graphical method, developed by the International Center for Equity in Health (www.equidade.org). Second, the crude and adjusted prevalence ratios were calculated, and the respective 95% conidence intervals (95%CI) were measured for each of the independent variables. For this, Poisson regression analyzes were conducted. Analyses were performed using Stata, version 12.1. In all analyzes, we used the svy command in order to consider the sample weights and expand the results for the Brazilian population. All interviewees were consulted, informed, and agreed to participate by signing an informed consent form. The PNS was approved by the National Ethics Committee, under protocol number 328.159 in June 26, 2013.
RESULTS
A total of 81,167 households were eligible to participate in the PNS, distributed in all major regions of Brazil. From the selected universe, 60,202 adults aged 18 years or older were interviewed, with valid data on physical activity obtained for 59,667 participants. The inter‑ viewed sample consisted of 52% women. The proportion of participants aged 75 years or older was around 5%, varying 2.7% in the northern region to 5.2% in the southeastern region. Just over 12% of the sample exhibited Grade IV instruction (complete superior edu‑ cation), with 8.3% in the northeast and 15.5% in the southeast regions.
Table 1 shows the prevalence of individuals who are active during leisure time according to sex, age groups, and the level of education for Brazil and each of the ive major regions. In all the regions, the prevalence of physical activity during leisure time was higher among men, younger people, and those with higher levels of education. Around 27% of men were classiied as active during leisure time, with little variation in this prevalence among the ive major regions.
Variables Brazil %
North %
Northeast %
Southeast %
South %
Midwest %
Sex
Female 18.5 15.5 17.7 19.2 18.3 20.4
Male 27.4 29.8 27.8 27.1 25.8 28.9
Age
18 – 24 35.9 36.8 34.9 38.1 30.7 36.5
25 – 34 27.4 26.7 28.6 26.4 27.8 28.2
35 – 44 21.0 20.2 20.4 20.9 21.6 23.1
45 – 54 18.0 15.7 16.0 19.5 17.1 19.2
55 – 64 17.6 10.4 16.2 18.9 17.1 20.1
65 – 74 15.3 9.6 15.3 15.7 16.5 15.2
75+ 8.0 2.2 5.3 8.8 10.0 12.4
Educational level (grade)
I 11.8 11.3 13.0 11.0 11.1 12.1
II 23.9 25.3 29.1 21.1 23.2 23.2
III 29.2 31.5 30.8 28.2 27.7 30.4
IV 38.3 36.1 36.4 38.9 36.4 43.3
Total 22.7 22.4 22.5 22.9 21.9 24.4
Table 1. Description of the practice of physical activity during leisure time according to sociodemographic variables in Brazil and major regions. National Health Survey, 2013.
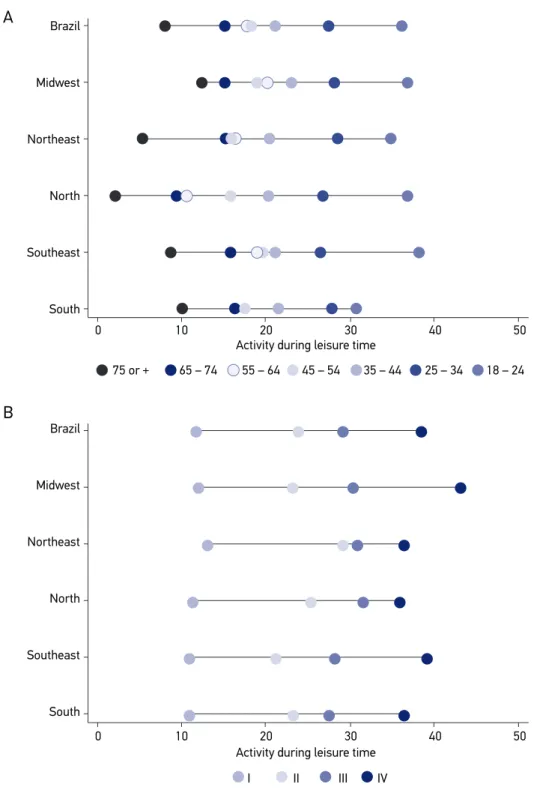
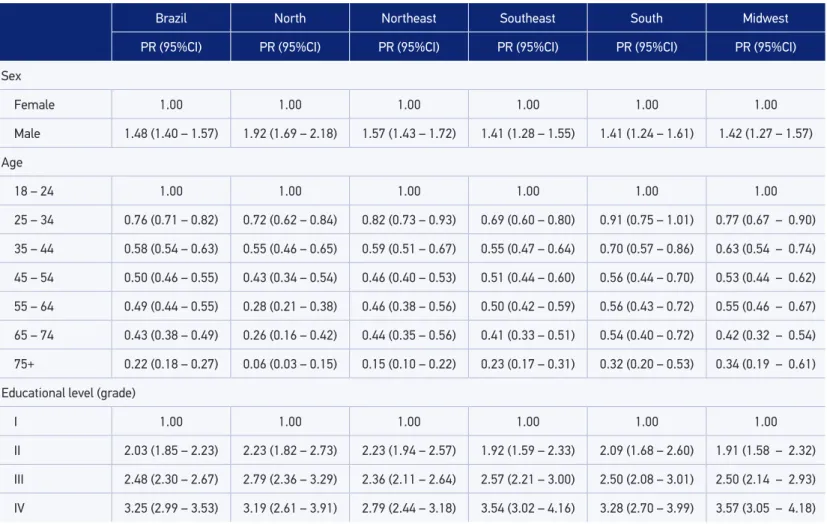
one with the smallest diference. Finally, the practice of physical activity during leisure time according to the educational level did not show a large regional variation (Figure 1).
Figure 1. Diferences in the practice of physical activity during leisure time in Brazil according to (A) age groups; (B) educational level. National Health Survey, 2013.
Brazil
Northeast Midwest
North
Southeast
South
Brazil
Northeast Midwest
North
Southeast
South
75 or + 65 – 74 55 – 64 45 – 54 35 – 44 25 – 34 18 – 24
0 10 20
Activity during leisure time
30 40 50
0 10 20
Activity during leisure time
30 40 50
IV III
I II
A
PR: prevalence ratio; 95%CI: 95% conidence intervals.
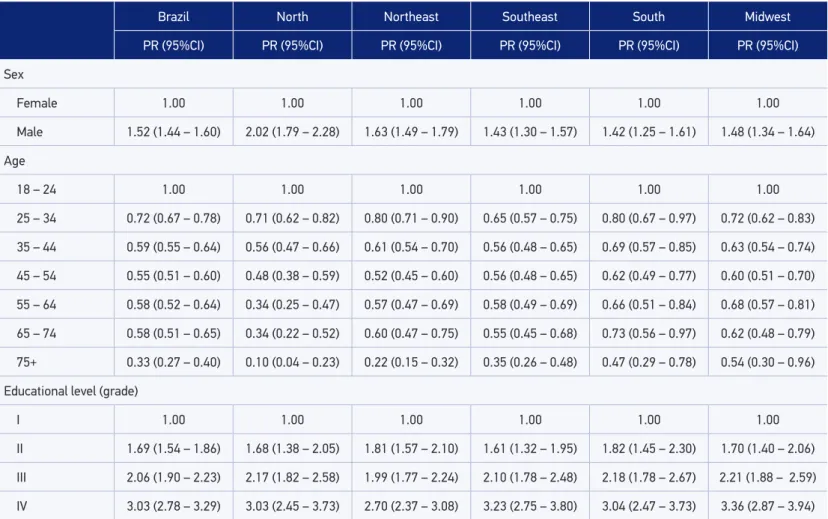
Table 2. Crude association between the practice of physical activity during leisure time and sociodemographic variables in Brazil and major regions. National Health Survey, 2013.
Brazil North Northeast Southeast South Midwest
PR (95%CI) PR (95%CI) PR (95%CI) PR (95%CI) PR (95%CI) PR (95%CI)
Sex
Female 1.00 1.00 1.00 1.00 1.00 1.00
Male 1.48 (1.40 – 1.57) 1.92 (1.69 – 2.18) 1.57 (1.43 – 1.72) 1.41 (1.28 – 1.55) 1.41 (1.24 – 1.61) 1.42 (1.27 – 1.57)
Age
18 – 24 1.00 1.00 1.00 1.00 1.00 1.00
25 – 34 0.76 (0.71 – 0.82) 0.72 (0.62 – 0.84) 0.82 (0.73 – 0.93) 0.69 (0.60 – 0.80) 0.91 (0.75 – 1.01) 0.77 (0.67 – 0.90)
35 – 44 0.58 (0.54 – 0.63) 0.55 (0.46 – 0.65) 0.59 (0.51 – 0.67) 0.55 (0.47 – 0.64) 0.70 (0.57 – 0.86) 0.63 (0.54 – 0.74)
45 – 54 0.50 (0.46 – 0.55) 0.43 (0.34 – 0.54) 0.46 (0.40 – 0.53) 0.51 (0.44 – 0.60) 0.56 (0.44 – 0.70) 0.53 (0.44 – 0.62)
55 – 64 0.49 (0.44 – 0.55) 0.28 (0.21 – 0.38) 0.46 (0.38 – 0.56) 0.50 (0.42 – 0.59) 0.56 (0.43 – 0.72) 0.55 (0.46 – 0.67)
65 – 74 0.43 (0.38 – 0.49) 0.26 (0.16 – 0.42) 0.44 (0.35 – 0.56) 0.41 (0.33 – 0.51) 0.54 (0.40 – 0.72) 0.42 (0.32 – 0.54)
75+ 0.22 (0.18 – 0.27) 0.06 (0.03 – 0.15) 0.15 (0.10 – 0.22) 0.23 (0.17 – 0.31) 0.32 (0.20 – 0.53) 0.34 (0.19 – 0.61)
Educational level (grade)
I 1.00 1.00 1.00 1.00 1.00 1.00
II 2.03 (1.85 – 2.23) 2.23 (1.82 – 2.73) 2.23 (1.94 – 2.57) 1.92 (1.59 – 2.33) 2.09 (1.68 – 2.60) 1.91 (1.58 – 2.32)
III 2.48 (2.30 – 2.67) 2.79 (2.36 – 3.29) 2.36 (2.11 – 2.64) 2.57 (2.21 – 3.00) 2.50 (2.08 – 3.01) 2.50 (2.14 – 2.93)
*Adjusted for sex, age and educational level. PR: prevalence ratio; 95%CI: 95% conidence intervals.
Table 3. Adjusted association* between the practice of physical activity during leisure time and sociodemographic variables in Brazil and major regions. National Health Survey, 2013.
Brazil North Northeast Southeast South Midwest
PR (95%CI) PR (95%CI) PR (95%CI) PR (95%CI) PR (95%CI) PR (95%CI)
Sex
Female 1.00 1.00 1.00 1.00 1.00 1.00
Male 1.52 (1.44 – 1.60) 2.02 (1.79 – 2.28) 1.63 (1.49 – 1.79) 1.43 (1.30 – 1.57) 1.42 (1.25 – 1.61) 1.48 (1.34 – 1.64)
Age
18 – 24 1.00 1.00 1.00 1.00 1.00 1.00
25 – 34 0.72 (0.67 – 0.78) 0.71 (0.62 – 0.82) 0.80 (0.71 – 0.90) 0.65 (0.57 – 0.75) 0.80 (0.67 – 0.97) 0.72 (0.62 – 0.83)
35 – 44 0.59 (0.55 – 0.64) 0.56 (0.47 – 0.66) 0.61 (0.54 – 0.70) 0.56 (0.48 – 0.65) 0.69 (0.57 – 0.85) 0.63 (0.54 – 0.74)
45 – 54 0.55 (0.51 – 0.60) 0.48 (0.38 – 0.59) 0.52 (0.45 – 0.60) 0.56 (0.48 – 0.65) 0.62 (0.49 – 0.77) 0.60 (0.51 – 0.70)
55 – 64 0.58 (0.52 – 0.64) 0.34 (0.25 – 0.47) 0.57 (0.47 – 0.69) 0.58 (0.49 – 0.69) 0.66 (0.51 – 0.84) 0.68 (0.57 – 0.81)
65 – 74 0.58 (0.51 – 0.65) 0.34 (0.22 – 0.52) 0.60 (0.47 – 0.75) 0.55 (0.45 – 0.68) 0.73 (0.56 – 0.97) 0.62 (0.48 – 0.79)
75+ 0.33 (0.27 – 0.40) 0.10 (0.04 – 0.23) 0.22 (0.15 – 0.32) 0.35 (0.26 – 0.48) 0.47 (0.29 – 0.78) 0.54 (0.30 – 0.96)
Educational level (grade)
I 1.00 1.00 1.00 1.00 1.00 1.00
II 1.69 (1.54 – 1.86) 1.68 (1.38 – 2.05) 1.81 (1.57 – 2.10) 1.61 (1.32 – 1.95) 1.82 (1.45 – 2.30) 1.70 (1.40 – 2.06)
III 2.06 (1.90 – 2.23) 2.17 (1.82 – 2.58) 1.99 (1.77 – 2.24) 2.10 (1.78 – 2.48) 2.18 (1.78 – 2.67) 2.21 (1.88 – 2.59)
DISCUSSION
The results of this study showed that, approximately, one in ive Brazilian adults practiced physical activity during leisure time, in accordance with the international recommendations, with a low variation of this practice among the ive major regions of Brazil. As expected, men, younger people, and those with higher levels of education were more active during lei‑ sure time, regardless of the region analyzed. However, signiicant variations were observed in relation to sex, age, and level of education among the regions of Brazil.
It is not surprising in the scientiic literature that younger individuals with higher educational levels are those with the highest prevalence of physical activity when com‑ pared with their peers, including in Brazil5,6. The diferences found in terms of age can
be explained by factors ranging from biological questions to social and environmental aspects. The limitations imposed by age and the burden of disease may be one of the factors that explain the lower prevalence of physical activity during leisure time among these groups. Moreover, older individuals are less likely to perceive regular physical activ‑ ity as an important factor for health, compared with younger people11,12. It should be
noted that environmental aspects can also interact with age in relation to physical activ‑ ity during leisure time. For example, Rech et al.13, analyzing the social and environmental
correlates of physical activity in adults living in Curitiba, showed that the greatest secu‑ rity against crimes was a predictor of practice of physical activity only among the older participants13. Thus, the same degree of environmental exposure related to security can
negatively inluence the physical activity in older individuals. However, it may not interfere with the younger, conirming the diferences in levels of physical activity during leisure time between the age groups.
In this study, it was observed that the north and northeast regions showed the largest diferences in physical activity during leisure time between the age groups, while the south region was the one that showed the lowest diference. We can analyze these results in view of the wide disparity in life expectancy between the regions. By considering the results of the National Health Survey, we observed that the percentage of participants aged 75 years or older was twice as high in the south and southeast regions, when compared with the north. Thus, the diferences may be owing to the age diference, with a larger presence of young people in the northern region, but a higher degree of disability owing to older age in the region should also be considered.
Despite the advances and the fight against socioeconomic inequalities, which have been occurring in the recent decades, Brazil still shows large inequality14, which is a
living in a city in southern Brazil, showed that lack of money was twice more reported as a barrier to physical activity among the participants with a lower socioeconomic classification when compared with their peers. On the other hand, in the same study, the authors found that not liking to practice physical activity was reported in a similar proportion among the richest and poorest.
The discussion on socioeconomic inequalities in physical activity can occur under difer‑ ent contexts. From the perspective of preventing and ighting chronic diseases, lower levels of physical activity may be one of the factors associated with higher rates of premature car‑ diovascular death, being more frequent among individuals living with a low socioeconomic status. A study conducted by Nogueira et al.16 showed that residents of the city of Juiz de
Fora (MG) who lived in areas with better socioeconomic conditions showed signiicantly lower premature cardiovascular mortality rates than their peers. Studies in other countries have found similar results17,18.
Given the importance of physical activity in coping with chronic noncommunicable dis‑ eases in recent years, Brazil has advanced in the incentive to health promotion and physical activity promotion initiatives18. Local initiatives such as the Academia da Cidade Program in
Recife (PE) and Aracaju (SE) have been successful in allowing the population greater access to spaces for the practice of physical activity. Assessment of these programs have shown that user’s proile is the women, the elderly, and the less educated, precisely the groups with the lowest prevalence of physical activity during leisure time19,20. Moreover, exposure to
the Academia da Cidade program in Recife was associated with larger rates of practice of physical activity21. Still, individuals using public spaces with the program were more active
when compared with individuals using similar spaces but without the program22. In addi‑
tion to local initiatives, it is worth highlighting the creation of the Academia da Saude program by the Ministry of Health in 2011, with a funding forecast of up to 4,000 poles for the development of community interventions to promote health, including the promotion of physical activity free of charge, as a way to facilitate population access to appropriate spaces for physical activity23.
Despite the development of actions and policies to promote physical activity, there are still regional disparities which, in part, may explain the diferences found in our study. For example, in order to increase access to physical activity options during leisure time, between 2005 and 2009, the Ministry of Health has financially supported more than 1,000 municipalities for the development of physical activity promotion programs, and the midwest region showed the larger proportion of cities supported. However, most munic‑ ipalities inanced were small, resulting in low population coverage24. In this study, it was
observed that the northern region showed the lowest proportion of inanced municipali‑ ties, showing that the environmental and political characters of actions and diiculties in physical infrastructure and professional training constitute important points of relection, so that the efectiveness of physical activity programs is leveraged24. Ramos et al.25, when
health care units carry out activities within the framework of physical activity. However, this prevalence varied signiicantly between the regions of Brazil, with 50.9% in the southeast region to 21.3% in the north25.
Some limitations should be discussed. The socioeconomic indicator used for these analyzes was the level of education. We believe that the construct of socioeconomic conditions can be more complex than simply the level of education. However, we believe that this variable can be a great indicator of socioeconomic conditions, both individ‑ ually and contextually. Although physical activity can occur in different domains such as work, housework, and during the trip to work/back home, we decided to restrict our analysis only to the leisure time, as we believe that this area has a great potential for intervention.
CONCLUSION
This was the irst study investigating the practice of physical activity during leisure time, focusing on the analysis of the degree of diference between population subgroups and regions of Brazil. This type of research is only made possible owing to the robustness of the data collected and standardization of the instrument applied to all regions of Brazil, a fact that allows us to make comparisons in absolute and relative terms.
Finally, although there is little diference in the prevalence of physical activity during leisure time among regions, this study showed that there are important diferences in physical activity during leisure time among the ive major regions when population sub‑ groups are analyzed, highlighting the low prevalence of physical activity during leisure time among the older population living in the northern region. These results suggest the need for physical activity promotion initiatives with diferent approaches in each of the ive regions of Brazil.
1. Brasil. Ministério da Saúde. Secretaria de Vigilância em Saúde. Saúde Brasil 2013: uma análise da situação de saúde e das doenças transmissíveis relacionadas à pobreza. Brasília: Ministério da Saúde; 2014. 2. Malta DC, de Moura L, Prado RR, Escalante JC,
Schmidt MI, Duncan BB. Mortalidade por doenças crônicas não transmissíveis no Brasil e suas regiões, 2000 a 2011. Epidemiol Serv Saúde 2014; 23(4): 599‑608 3. Brasil. Ministério da Saúde. Secretaria de Vigilância
em Saúde. Secretaria de Atenção à Saúde. Política Nacional de Promoção da Saúde. Disponível em:
http://bvsms.saude.gov.br/bvs/publicacoes/politica_ nacional_promocao_saude_3ed.pdf (Acessado em 17 de novembro de 2014).
4. Brasil. Ministério da Saúde. Secretaria de Vigilância em Saúde. Departamento de Análise de Situação de Saúde. Plano de ações estratégicas para o enfrentamento das Doenças Crônicas Não Transmissíveis (DCNT) no Brasil 2011‑2022 [Internet]. Brasília: Ministério da Saúde; 2011 Disponível em: http://www.sbn.org.br/ noticias/acoes_estrategicas.pdf (Acessado em 17 de junho de 2012).
5. Hallal PC, Andersen LB, Bull FC, Guthold R, Haskell W, Ekelund U, et al. Global physical activity levels: surveillance progress, pitfalls and prospects. Lancet 2012; 380: 20‑30.
6. Bauman AE, Reis RS, Sallis JF, Wells JC, Loos RJ, Martin BW; Lancet Physical Activity Series Working Group. Correlates of physical activity: why are some people physically active and others not? Lancet 2012; 380(9838): 258‑71. 7. Ramires VV, Becker LA, Sadovsky ADI, Zago AM,
Bielemann RM, Gerra PH. Evolução da pesquisa epidemiológica em atividade física e comportamento sedentário no Brasil: atualização de uma revisão sistemática. Rev Bras Ativ Fis Saude 2014; 19(5): 529‑47. 8. Knuth AG, Malta DC, Dumith SC, Pereira CA, Morais Neto OL, et al. Practice of physical activity and sedentarism among Brazilians: results of the National Household Sample Survey ‑ 2008. Cien Saude Colet 2011; 16(9): 3697‑705
9. Mielke GI, Hallal PC, Rodrigues GBA, Szwarcwald CL, Santos FV, Malta DC. Prática de atividade física e tempo assistindo televisão de adultos no Brasil: Pesquisa Nacional de Saúde‑2013. Epidemiol Serv Saúde 2015; 24(2): 277‑86.
10. Instituto Brasileiro de Geograia e Estatística (IBGE). Pesquisa Nacional de Saúde, 2013. Rio de Janeiro: Instituto Brasileiro de Geograia e Estatística; 2014. Disponível em: http://www.ibge.gov.br/home/ estatistica/populacao/pns/2013/ (Acessado em 08 de janeiro de 2015).
11. Reichert FF, Domingues MR, Hallal PC., Azevedo MR, Siqueira FV, Barros AJD. Priorities in health: what do they mean to Brazilian adults? Cad Saúde Pública 2010; 26(4): 775‑85.
12. Siqueira FV, Nahas MV, Facchini LA, Silveira DS, Piccini RX, Tomasi E, et al . Factors considered important for health maintenance by the population. Rev Saúde Pública 2009; 43(6): 961‑71.
13. Rech CR, Reis RS, Hino AA, Hallal PC. Personal, social and environmental correlates of physical activity in adults from Curitiba, Brazil. Prev Med 2014; 58: 53‑7 14. Instituto Brasileiro de Geograia e Estatística (IBGE). Séries históricas e estatísticas. Rio de Janeiro: Instituto Brasileiro de Geograia e Estatística; 2014. Disponível em http://seriesestatisticas.ibge.gov.br/lista_tema. aspx?op=0&de=16&no=6 (Acessado em 27 de março de 2015).
15. Reichert FF, Barros AJD, Domingues MR, Hallal PC. The Role of Perceived Personal Barriers to Engagement in Leisure‑Time Physical Activity. Am J Public Health 2007; 97(3): 515‑9
16. Nogueira MC; Ribeiro LC, Cruz OG. Desigualdades sociais na mortalidade cardiovascular precoce em um município de médio porte no Brasil. Cad Saúde Pública 2009; 25(11): 2321‑32
17. Singh GK, Siahpush M. Increasing inequalities in all cause and cardiovascular mortality among US adults aged 25‑64 years by area socioeconomic status, 1969‑ 1998. Int J Epidemiol 2002; 31(3): 600‑13.
18. Malta, DC, Silva Jr, JB. Policies to promote physical activity in Brazil. Lancet 2012; 380(9838): 195‑6. 19. Hallal PC, Tenório MC, Tassitano RM, Reis RS,
Carvalho YM, Cruz DK, et al. Avaliação do programa de promoção da atividade física Academia da Cidade de Recife, Pernambuco, Brasil: percepções de usuários e não‑usuários. Cad Saúde Pública 2010; 26(1): 70‑8. 20. Reis, RS, Yan, Y, Parra, DC, Brownson, RC. Assessing
participation in community‑based physical activity programs in Brazil. Med Sci Sports Exerc 2014; 46(1): 92‑8. 21. Simoes EJ, Hallal P, Pratt M, Ramos L, Munk M,
Damascena W, et al. Efects of a community‑based, professionally supervised intervention on physical activity levels among residents of Recife, Brazil. Am J Public Health 2009; 99(1): 68‑75.
22. Parra DC, McKenzie TL, Ribeiro IC, Ferreira Hino AA, Dreisinger M, Coniglio K, et al. Assessing Physical Activity in Public Parks in Brazil Using Systematic Observation. Am J Public Health 2010; 100(8): 1420‑6. 23. Brasil. Ministério da Saúde. Redeine o Programa Academia da Saúde no âmbito do Sistema Único de Saúde (SUS). Portaria n. 2.681, de 7 de Novembro de 2013. 24. Amorim TC, Knuth AG, Cruz DKA, Malta DC, Reis
RS, Hallal PC. Descrição dos programas municipais de promoção da atividade física inanciados pelo Ministério da Saúde. Rev Bras Ativ Fís Saúde 2013; 18(1): 63‑74. 25. Ramos LR, Malta DC, Gomes GAO, Bracco MM,
Florindo AA, Mielke GI, et al . Prevalence of health promotion programs in primary health care units in Brazil. Rev Saúde Pública 2014; 48(5): 837‑44.
Received on: 04/30/2015