RESUMO
JUSTIFICATIVA E OBJETIVOS: A acidose metabóli-ca diagnostimetabóli-cada pela mensuração do standard base excess (SBE) é indicadora de maior mortalidade e sua melhora temporal é associada à maior sobrevida em pa-cientes críticos. O objetivo deste estudo foi esclarecer o mecanismo de variação do SBE, em pacientes com choque séptico, durante os três primeiros dias de inter-nação na unidade de terapia intensiva (UTI), através da avaliação físico-química do equilíbrio ácido básico. MÉTODO: Os dados foram coletados de pacientes com choque séptico a partir de um banco de dados, prospectivamente, diariamente até o terceiro dia de in-ternação na UTI. Correlações entre o SBE e outras vari-áveis físico-químicas independentes foram realizadas, assim como um modelo matemático multilinear foi de-senhado para revelar os determinantes independentes da variação do SBE.
RESULTADOS:A variação do SBE em pacientes
sép-ticos nos primeiros três dias de internação na UTI foi fracamente correlacionado ao strong ion gap (SIG), lac-tato, albumina, creatinina e PaCO2 quando analisados individualmente. Quando analisados de forma
conco-Partitioning Evolutive Standard Base Excess
Determinants in Septic Shock Patients*
Determinantes da Evolução do Standard Base
Excess em Pacientes com Choque Séptico
Marcelo Park1, Danilo Teixeira Noritomi1, Alexandre Toledo-Maciel1,
Luciano Cesar Pontes de Azevedo1, Vladimir Ribeiro Pizzo1, Luiz Monteiro da Cruz-Neto1
1. Assistant Doctor - Intensive Care Unit – Emergency Department – Hospital das Clínicas – University of São Paulo Medical School.
*Received from Intensive Care Unit - Emergency Department - Hos-pital das Clínicas - University of São Paulo Medical School - Brazil
Presented in June, 26, 2007 Accepted in October, 18, 2007
Author for correspondence: Marcelo Park, M.D.
Rua Francisco Preto, 46, B3, Apto 64 05623-010, São Paulo, SP - Brazil E-mail: [email protected]
©Associação de Medicina Intensiva Brasileira, 2007
mitante, as variáveis albumina, strong ion difference (SIDa), SIG, PaCO2 e diurese foram independentemen-te associados à variação do SBE com um coeicienindependentemen-te de determinação de 0,866.
CONCLUSÔES: A variação do SBE durante os três pri-meiros dias de internação na UTI foi resultante da inte-ração de alguns fatores independentes como PaCO2, diurese, SIG, SIDa e albumina
Unitermos: Acidose metabólica, choque séptico, lac-tato, monitorização, sepse grave
SUMMARY
BACKGROUND AND OBJECTIVES: The amount of
metabolic acidosis measured through the standard base excess (SBE) has been shown to be an outcome marker and its improvement has been associated with better survival. We studied the mechanism of standard base excess variation in the irst three days of intensive care unit (ICU) stay through the evaluation of indepen-dent variables of physico-chemical approach.
METHODS: Data were retrieved from our prospecti-ve collected data base from patients with diagnosis of septic shock, daily up to the third day after the ICU admission. Single correlations between SBE and inde-pendent variables were performed as well as a mathe-matical multilinear model was built to disclose the SBE variation determinants.
RESULTS:We have shown that in septic shock patients the standard base excess variation during the irst three days of ICU stay is weakly correlated to strong ion gap (SIG), lactate, creatinin and PaCO2 when individually analyzed. Analyzing concomitantly those independent variables, we built a mathematical model with a stepwi-se multilinear regression compostepwi-sed by apparent strong ion difference (SIDa), SIG, PaCO2, albumin and diuresis that resulted in a R2 coeficient of 0.866 to determine
CONCLUSIONS: Variations of metabolic acidosis mea sured through the standard base excess in septic shock patients when analyzed until the third day after intensive care unit admission, is resultant of interaction of several independent determinants as PaCO2, diure-sis, SIG, SIDa and albumin.
Key Words: lactate, metabolic acidosis, monitoriza-tion, septic shock, severe sepsis
INTRODUCTION
Base excess is the quantity of metabolic acidosis or alkalosis, deined as the amount of acid or base that must be added to a sample of whole blood in vitro in order to restore the pH of the sample to 7.40 while the PCO2 is held at 40 mmHg1. Currently the most
com-monly used methodology for acquire base excess is the Van Slyke equation which takes into account the bicarbonate serum level, hemoglobin and pH2. Base
excess is quite accurate in vitro, although inaccu-racy has always been a problem when Van Slyke is applied in vivo, where base excess changes slightly with changes in arterial carbon dioxide partial pressu-re (PaCO2)3. Thus, the base excess equation has been
modiied to standardize the effect of hemoglobin in order to improve the accuracy of base excess in vivo2.
The term standard base excess (SBE) has been given to this last described variable, which better quantiies the change in metabolic acid base status in multipartment systems, highlighting the plasmatic com-partment2,3.
In 1981, Dr. Peter Stewart, a Canadian physiologist, proposed a novel physico-chemical theory of acid base balance based mainly on an explicit master fourth-or-der polynomial equation that relates the pH to three in-dependent variables: 1. SID which is the difference of charge of all strong ions (cations – anions), 2. PCO2 and 3. Atot which is the total concentration of weak acids, represented in the human physiology by albumin and phosphate4,5. This new theory has brought new light to
the area of acid base disturbances of critically ill pa-tients.
In critically ill subjects, the presence of metabolic aci-dosis is very common, particularly in septic shock pa-tients6. The amount of metabolic acidosis measured
through the SBE has been shown to be an outcome marker, when it is evaluated isolated on admission or during the irst days after ICU admission7. Its
improve-ment has been associated with better survival. Howe-ver, so far it is not clear which are the factors
associa-ted with SBE variations in critically ill septic patients. In this study, we splitted septic shock patients in two groups, one group of patients who improved SBE from the day of ICU admission to the third day of ICU stay, and one group who worsened SBE in the same period. The aim of this study was to characterize the acid-base variables, according to the Stewart’s theory, responsi-ble for SBE improvement and worsening within the irst three days of ICU stay.
METHODS
Data were retrieved from our prospective collected data base of a tertiary teaching seven beds intensive care unit (ICU) in São Paulo – Brazil. The period investiga-ted was from January 2004 to May 2004. Age, gender, APACHE II score, length of stay in ICU, clinical outco-me, needing for mechanical ventilation, previous diag-nosis of chronic renal failure, needing for dialysis, luids handling, general laboratorial data and infection source were collected from patients with diagnosis of septic shock daily up to the third day after ICU admission. The diagnosis of septic shock was performed according to the consensus conference criteria8.
Blood samples and luids handling data were obtained at the end of each day. The arterial line was used to collect blood samples. Albumin, phosphate and se-rum Mg2+ were analyzed by colorimetric techniques,
and other serum electrolytes were measured with an ion-selective electrode. Arterial blood gases and lacta-te were measured by the OMNI analyzer (Roche Diag-nostics System, F. Hoffmann - la Roche ltd, Basel, Switzerland) and to determine SBE value the Van Slyke method was used2. All standard formulas used to
cal-culate physico-chemical variables are described in the appendix.
RESULTS
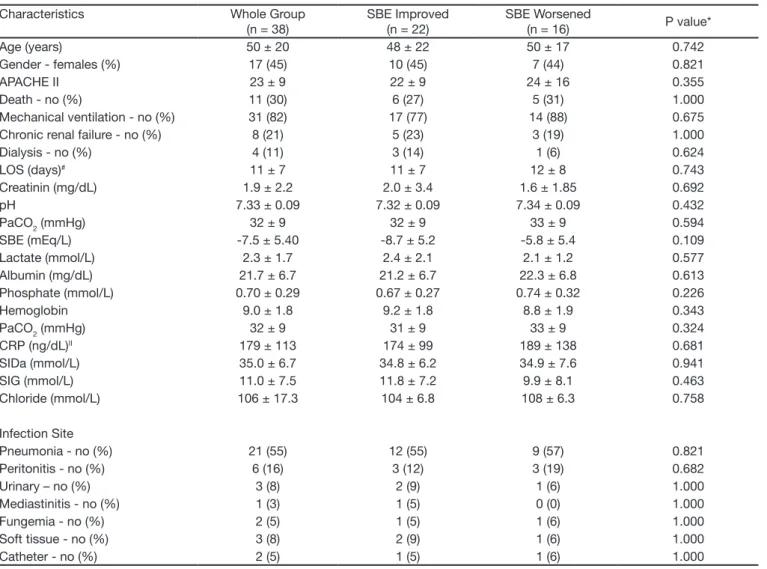
During ive months, thirty eight patients with septic sho-ck treated according to the surviving sepsis campaign, were observed. General characteristics and infection sites of whole group are shown in table 1.
The SBE evolution was linear beyond the three irst days in both groups (Figure 1 - Panel A). A slight varia-tion around 35 mmol/l was the feature of SIDa beha-vior, and lactate also had a small variation. Unmeasu-red anions, disclosed by SIG, fall in the group who im-proved SBE and rise in the group who worsened SBE (Figure 1 - Panel B). Albumin levels fall in the group who
worsened SBE, and initially fall in the irst day rising in the second day in the group who improved SBE (Figure 1 - Panel C).
The SBE variation was individually correlated with lac-tate, PaCO2, creatinin and SIG (Table 4). When a ste-pwise multilinear regression model with SBE as a de-pendent variable was built, the indede-pendent variables albumin, PaCO2, SIDa, SIG and diuresis have compo-sed an equation with the determination coeficient (R2)
of 0.866. Beta unstandardized coeficients of the mul-tilinear regression model are shown in table 4. When analyzing the group of patients who SBE improved or worsened individually the results are similar.
Table 1 – General Characteristics at Admission and Infection Site of Patients Characteristics Whole Group
(n = 38)
SBE Improved (n = 22)
SBE Worsened
(n = 16) P value* Age (years) 50 ± 20 48 ± 22 50 ± 17 0.742 Gender - females (%) 17 (45) 10 (45) 7 (44) 0.821
APACHE II 23 ± 9 22 ± 9 24 ± 16 0.355
Death - no (%) 11 (30) 6 (27) 5 (31) 1.000 Mechanical ventilation - no (%) 31 (82) 17 (77) 14 (88) 0.675 Chronic renal failure - no (%) 8 (21) 5 (23) 3 (19) 1.000 Dialysis - no (%) 4 (11) 3 (14) 1 (6) 0.624
lOS (days)# 11 ± 7 11 ± 7 12 ± 8 0.743
Creatinin (mg/dl) 1.9 ± 2.2 2.0 ± 3.4 1.6 ± 1.85 0.692 pH 7.33 ± 0.09 7.32 ± 0.09 7.34 ± 0.09 0.432 PaCO2 (mmHg) 32 ± 9 32 ± 9 33 ± 9 0.594 SBE (mEq/l) -7.5 ± 5.40 -8.7 ± 5.2 -5.8 ± 5.4 0.109 lactate (mmol/l) 2.3 ± 1.7 2.4 ± 2.1 2.1 ± 1.2 0.577 Albumin (mg/dl) 21.7 ± 6.7 21.2 ± 6.7 22.3 ± 6.8 0.613 Phosphate (mmol/l) 0.70 ± 0.29 0.67 ± 0.27 0.74 ± 0.32 0.226 Hemoglobin 9.0 ± 1.8 9.2 ± 1.8 8.8 ± 1.9 0.343 PaCO2 (mmHg) 32 ± 9 31 ± 9 33 ± 9 0.324 CRP (ng/dl)II 179 ± 113 174 ± 99 189 ± 138 0.681
SIDa (mmol/l) 35.0 ± 6.7 34.8 ± 6.2 34.9 ± 7.6 0.941 SIG (mmol/l) 11.0 ± 7.5 11.8 ± 7.2 9.9 ± 8.1 0.463 Chloride (mmol/l) 106 ± 17.3 104 ± 6.8 108 ± 6.3 0.758
Infection Site
Pneumonia - no (%) 21 (55) 12 (55) 9 (57) 0.821 Peritonitis - no (%) 6 (16) 3 (12) 3 (19) 0.682
Urinary – no (%) 3 (8) 2 (9) 1 (6) 1.000
Mediastinitis - no (%) 1 (3) 1 (5) 0 (0) 1.000 Fungemia - no (%) 2 (5) 1 (5) 1 (6) 1.000 Soft tissue - no (%) 3 (8) 2 (9) 1 (6) 1.000 Catheter - no (%) 2 (5) 1 (5) 1 (6) 1.000
no denotes number of patients.
*P value denotes the signiicance of comparisons between SBE worsened and SBE improved groups. # lOS denotes lenght of stay.
Table 2 – Fluids Handling During the First Three Days
Characteristics Whole Group (n = 38)
SBE Improved (n = 22)
SBE Worsened
(n = 16) P value* Day 1
Diuresis (ml) 1312 ± 1462 1402 ± 1450 1445 ± 1842 0.950 Hydric balance (ml) 3822 ± 4542 2880 ± 2570 5313 ± 5899 0.201 Fluid intake (ml) 5134 ± 4482 4281± 2907 6597 ± 6390 0.290 Day 2
Diuresis (ml) 1608 ± 1639 1792 ± 2097 1437 ± 1129 0.599 Hydric balance (ml) 4565 ± 4171 4306 ± 4573 4804 ± 3937 0.773 Fluid intake (ml) 6172 ± 3912 6098 ± 3921 6240 ± 4026 0.930 Day 3
Diuresis (ml) 1852 ± 1884 2192 ± 2241 1585 ± 1584 0.435 Hydric balance (ml) 1761 ± 3192 645 ± 3242 2639 ± 2974 0.123 Fluid intake (ml) 3613 ± 2506 2836 ± 1785 4224 ± 2869 0.174 First 3 days
Diuresis (ml) 1630 ± 1664 1784 ± 1920 1491 ± 1509 0.433 Hydric balance (ml) 3505 ± 4092 2666 ± 3779 4212 ± 4454 0.244 Fluid intake (ml) 5084 ± 3765 4450 ± 3249 5703 ± 4274 0.142
no denotes number of patients.
* P value denotes the signiicance of comparisons between SBE worsened and SBE improved groups.
Table 3 – Vasopressors and Inotropics Used
Characteristics Whole Group (n = 38)
SBE Improved (n = 22)
SBE Worsened
(n = 16) P value* Norepinephrine – no (%) 38 (100) 22 (100) 16 (100)
Mean maximal dosis (µg/kg/min) 0.81 ± 1.68 0.96 ± 1.89 0.69 ± 1.35 0.270 Dobutamine – no (%) 33 (87) 19 (86) 14 (88) 0.831 Mean maximal dosis (µg/kg/min) 13.7 ± 6.1 13.1 ± 5.9 14.1 ± 6.2 0.617
no denotes number of patients.
*P value denotes the signiicance of comparisons between SBE worsened and SBE improved groups.
Table 4 – linear and Multilinear Correlation between SBE and Metabolic Acidosis Determinant Variables Single Correlation Stepwise Multilinear Regression *
Variables Pearson Coeficient P value Beta Unstandardized Coeficient P value
lactate -0.211 0.024 -
-Albumin -0.059 0.534 -34.5 < 0.001
Phosphate -0.226 0.016 -
-PaCO2 0.364 <0.001 -0.2 < 0.001
Creatinin -0.346 <0.001 -
-Hemoglobin 0.064 0.524 -
-SIDa -0.124 0.187 1.2 < 0.001
SIG -0.368 < 0.001 -1.2 < 0.001
Diuresis# 0.044 0.711 0.03 0.014
C-reactive protein -0.242 0.105 -
-Hydric balance# -0.101 0.390 -
-Fluids received# -0.090 0.441 -
-*The inal model with ive variables resulted in a determination coeficient (R2) of 0.866. The inclusion criteria of the model was an F probability of 0.05 and exclusion criteria was an F probability of 0.1. C-reactive protein was not included in the initial multilinear model due to a high collinearity with albumin (Pearson coeficient of 0.550).
Figure 1 – Panel A shows the Evolution of SBE during the Three First Days. Panel B shows the Evolution of SIDa, SIG and lacta-te. Panel C shows the Evolution of Albumin.
DISCUSSION
In our study, we have shown that in septic shock pa-tients the SBE variation during the irst three days of ICU stay is weakly correlated to SIG, lactate, creatinin and PaCO2 when individually analyzed. Analyzing con-comitantly those independent variables, we built a ma-thematical model with a stepwise multilinear regression composed by SIDa, SIG, PaCO2, albumin and diuresis that resulted in a R2 coeficient of 0.866 to determine
SBE variations.
Since the description of base excess in 19601, it has
been largely used in the clinical practice to disclose and measure metabolic acidosis3,4,9. However, base excess
or its clinical derivation SBE are limited to detect true metabolic acidosis in adult critically ill patients and in pediatric cardiac postoperative10,11. This limitation has
been ascribed to hypoalbuminemia, which can cause metabolic alkalosis hiding or attenuating any kind of installed metabolic acidosis11. In spite of the apparent
limited information’s given by the SBE, low values of SBE at the admission to ICU has been associated with poor outcome12-15, and in the same way the
improve-ment of SBE by the third day after the ICU admission has been independently correlated with better progno-sis7. In the hemodynamic early goal directed therapy
study performed by Rivers et al.16 to severe sepsis and
septic shock patients, the interventional group impro-ved SBE close to normal values by the third day, star-ting from very low initial values. Those characteristics turn SBE an important clinical physiological tool to be used in the modern ICU.
It is interesting to note that among our patients there were not admission characteristics that have identiied the subjects who could improve or worse SBE until the third day. The amount and quality of luids used in re-suscitation of shock can, theoretically, be related to acid base state modiications3,9. In our study, the amount of
luids used in both groups were similar (Table 2) and the standard luid used was ringer lactate, in this way, the great acid base derangements expected using crys-talloids would be SIDa variations, by contrast, our in-ding point out to SIG as a correlate with SBE in the uni-variate analysis (Table 4). SIG actually quantify unmea-sured anions3,5, and it can be raised by colloids3, which
were not used in our patients. Other possible sources of SIG acidosis in septic shock patients are: 1. mito-chondrial dysfunction, which can be secondary to oxy-gen deprivation17 or inlammatory mediators18, and 2.
renal dysfunction by reducing clearance of non volatile
SBE (mEq/L)
Anions and SIDa (mmol/L)
acids19. Currently, there are some investigations about
the unmeasuble anions components of SIG acidosis, and some metabolic intermediates of krebs` cycle as isocitrate, α-ketoglutarate and malate has been asso-ciated with SIG acidosis20, although, the deinitive list of
endogenous anions that can cause metabolic SIG aci-dosis in sepsis and shock states is far from complete21.
There are some evidences that SIG acidosis is correla-ted with outcome13,14, and it is additive with prognostic
information of serum lactate level12.
Serum lactate level is a well known cause of metabo-lic acidosis in critically ill patients22, but its clinical and
physiological importance has been shared with other unmeasured anions12,14. It has been associated with
oxygen deprivation, inlammation and hepatic dysfunc-tion22. Our correlation inding between SBE and
lacta-te is physiologically rational (Table 4)9, and the lactate
exclusion of the inal stepwise regression model can be explained by the fact that the unmeasured anions calculated by SIG physiologically behave quite similar to lactate17,20, likewise, in the mathematical model the
inclusion of lactate could not be of great importance in the modiication of F probability statistics, and this fact is an acquard relection of clinical association among SIG, SBE and lactate12,14,20.
Creatinin was other inding associated with SBE varia-tion. low renal clearance is associated with increments in SIG19, but in our patients it is hard to afirm that SIG
acidosis has been caused by low renal clearance or SIG acidosis has been epiphenomena which has resulted from the critical illness and multiorgan dysfunction18,23.
Diuresis is an immediate relection of renal clearance and can disclose renal impairment earlier than creatinin elevations24. Otherwise, few patients can present
oligu-ria without elevations of creatinin, but acidosis will be present only if renal failure is present19. In this way, we
can understand why diuresis was associated with SBE variations only in the mathematical multilinear model25.
Partial pressure of carbon dioxide was positively asso-ciated with SBE variations as expected by the mathe-matical calculus using the Van Slyke equation, where bicarbonate concentration is one of the independent variables besides pH2. Thus, from the stoichiometric
point of view, one can expect that rising PaCO2 the bi-carbonate and then SBE will also rise1. Otherwise, in our
multilinear mathematical model, an interesting inding was the negative correlation of PaCO2 and SBE varia-tions, contrasting with the single correlation. This in-ding can represent the clinical status of patients, where higher the severity of the disease, higher the probability
to be on mechanical ventilation, relecting in low SBE due to the severity of disease and PaCO2 dependent of mechanical ventilation strategy. In this way, we would like to stress that fourteen patients (37%) accompli-shed acute respiratory distress syndrome (ARDS) cri-teria of consensus conference26, and in our patients the
open lung approach with permissive hypercapnia has been used to ventilate ARDS patients27. The advantage
of the mathematical stepwise multilinear regression in this case was the representation of SBE as a multicom-ponent tool, reproducing the complex clinical acid base environment25.
Albumin and phosphate have been considered as the main weak acids in organic systems that are responsi-ble for acid base modulation10,28-30. Hypoalbuminemia is
a frequent inding in critically ill patients and also in our patients (Table 1, Figure 2), being an important source of metabolic alkalosis and pH and SBE neutralization in this setting as we can observe in table 4, in the mathe-matical model11.
Funk et al.31 studied the acid base behavior in a
gene-ral ICU population, showing chloride and SIDa as the main determinants of acid base behavior. By contrast, in septic shock patients, according to our indings the acidosis variation measured by the SBE results from a complex situation, and SIDa was important only in the mathematical multilinear model when analyzed toge-ther with otoge-ther components associated with metabolic acidosis.
We would like to stress that the physico-chemical ap-proach is not superior to the traditional apap-proach at be-dside to diagnose acid-base derangements32.
Howe-ver, this methodology allows the quantiication of respi-ratory and / or metabolic shifts to statistical measure-ment. In this way, we have used the physico-chemical approach in our study.
In conclusion, variations of metabolic acidosis mea-sured through the SBE in septic shock patients when analyzed until the third day after ICU admission, is re-sultant of interaction of several independent determi-nants as PaCO2, diuresis, SIG, SIDa and albumin.
APPENDIX – STANDARD FORMULAS
1. Standard base excess (Van Slyke`s equation) (SBEVS) (mEq/l) = 0.9287 x (HCO3 – 24.4 + 14.83 × [pH – 7.4]) 2. Apparent strong ion difference (SIDa) (mEq/l) = Na+ +
k+ + Ca2+ + Mg2+ – Cl- - lactate
× 10-8 × PCO 2/10
-pH + [albumin (g/dl)] × (0.123 × pH –
0.631) + [phosphate (mg/dl)/3 × (pH – 0.469)] 4. SIG (mEq/l) = SIDa – SIDa
5. Albumin (mEq/l) = 10 x Albumin (g/dl) x (0.123 x pH – 0.631)
6. Inorganic phosphate (Pi)(mEq/l) = (PO4(mg/dl) x 10/30,97) x (0.309 x pH - 0.469)
7. The unit of all strong ions was mEq/l
REFERENCES
01. Astrup P, Jorgensen k, Andersen OS et al - The acid-base metabolism. A new approach. lancet, 1960;1:1035-1039.
02. Morgan TJ, Clark C, Endre ZH - Accuracy of base excess--an in vitro eva-luation of the Van Slyke equation. Crit Care Med, 2000;28:2932-2936. 03. kellum JA - Clinical review: reuniication of acid-base physiology. Crit
Care, 2005;9:500-507.
04. Corey HE - Bench-to-bedside review: Fundamental principles of acid-base physiology. Crit Care, 2005;9:184-192.
05. Stewart PA - Modern quantitative acid-base chemistry. Can J Physiol Pharmacol, 1983;61:1444-1461.
06. Mackenzie IM - The haemodynamics of human septic shock. Anaesthe-sia, 2001;56:130-144.
07. Palma lC, Ferreira GF, Amaral ACkB et al - Acidosis and mortality in severe sepsis and septic shock evaluated by base excess variation. Crit Care, 2003;7(Suppl3):P39.
08. Bone RC, Sibbald WJ, Sprung Cl - The ACCP-SCCM consensus confe-rence on sepsis and organ failure. Chest, 1992;101:1481-1483. 09. Gunnerson kJ - Clinical review: the meaning of acid-base abnormalities in
the intensive care unit part I - epidemiology. Crit Care, 2005;9:508-516. 10. Murray DM, Olhsson V, Fraser JI - Deining acidosis in postoperative
cardiac patients using Stewart’s method of strong ion difference. Pediatr Crit Care Med, 2004;5:240-245.
11. Fencl V, Jabor A, kazda A et al - Diagnosis of metabolic acid-ba-se disturbances in critically ill patients. Am J Respir Crit Care Med, 2000;162:2246-2251.
12. Smith I, kumar P, Molloy S et al - Base excess and lactate as prognostic indicators for patients admitted to intensive care. Intensive Care Med, 2001;27:74-83.
13. Balasubramanyan N, Havens Pl, Hoffman GM - Unmeasured anions identiied by the Fencl-Stewart method predict mortality better than base excess, anion gap, and lactate in patients in the pediatric intensive care unit. Crit Care Med, 1999;27:1577-1581.
14. kaplan lJ, kellum JA - Initial pH, base deicit, lactate, anion gap, strong
ion difference, and strong ion gap predict outcome from major vascular injury. Crit Care Med, 2004;32:1120-1124.
15. Dondorp AM, Chau TT, Phu NH et al - Unidentiied acids of strong prognos-tic signiicance in severe malaria. Crit Care Med, 2004;32:1683-1688. 16. Rivers E, Nguyen B, Havstad S et al - Early goal-directed therapy in
the treatment of severe sepsis and septic shock. N Engl J Med, 2001;345:1368-1377.
17. kellum JA, Bellomo R, kramer DJ et al - Hepatic anion lux during acute endotoxemia. J Appl Physiol, 1995;78:2212-2217.
18. Brealey D, Brand M, Hargreaves I et al - Association between mitochon-drial dysfunction and severity and outcome of septic shock. lancet, 2002;360(9328):219-223.
19. Rocktaeschel J, Morimatsu H, Uchino S et al - Acid-base status of criti-cally ill patients with acute renal failure: analysis based on Stewart-Figge methodology. Crit Care, 2003;7:R60.
20. Forni lG, Mckinnon W, lord GA et al - Circulating anions usually asso-ciated with the krebs cycle in patients with metabolic acidosis. Crit Care, 2005;9:R591-R595.
21. Bowling FG, Morgan TJ - krebs cycle anions in metabolic acidosis. Crit Care, 2005;9(5):E23.
22. De Backer D - lactic acidosis. Intensive Care Med, 2003;29:699-702. 23. Singer M, De Santis V, Vitale D et al - Multiorgan failure is an adaptive,
endocrine-mediated, metabolic response to overwhelming systemic in-lammation. lancet, 2004;364(9433):545-548.
24. Bellomo R, Ronco C, kellum JA et al - Acute renal failure - deinition, ou-tcome measures, animal models, luid therapy and information technolo-gy needs: the Second International Consensus Conference of the Acute Dialysis Quality Initiative (ADQI) Group. Crit Care, 2004;8:R204-R212. 25. Marill kA - Advanced statistics: linear regression, part II: multiple linear
regression. Acad Emerg Med, 2004;11:94-102.
26. Bernard GR, Artigas A, Brigham kl et al - The American-European Consensus Conference on ARDS. Deinitions, mechanisms, relevant outcomes, and clinical trial coordination. Am J Respir Crit Care Med, 1994;149:818-824.
27. Amato MB, Barbas CS, Medeiros DM et al - Effect of a protective-venti-lation strategy on mortality in the acute respiratory distress syndrome. N Engl J Med, 1998;338:347-354.
28. Figge J, Jabor A, kazda A et al - Anion gap and hypoalbuminemia. Crit Care Med, 1998;26:1807-1810.
29. Figge J, Mydosh T, Fencl V - Serum proteins and acid-base equilibria: a follow-up. J lab Clin Med, 1992;120:713-719.
30. Figge J, Rossing TH, Fencl V - The role of serum proteins in acid-base equilibria. J lab Clin Med, 1991;117:453-467.