ORIGINAL ARTICLE
Latent class profile of psychiatric symptoms and
treatment utilization in a sample of patients with
co-occurring disorders
Luis Villalobos-Gallegos,
1Rodrigo Marı´n-Navarrete,
1Calos Roncero,
2,3Hugo Gonza´lez-Cantu´
41Unidad de Ensayos Clı´nicos en Adicciones y Salud Mental, Instituto Nacional de Psiquiatrı´a Ramo´n de la Fuente Mun˜iz, Mexico City, Mexico. 2Unidad de Adicciones y Patologı´a Dual, Servicio de Psiquiatrı´a, Hospital Universitario Vall d’Hebro´n-Agencia de Salud Pu´blica de Barcelona
(ASPB), Centro de Investigacio´n Biome´dica en Red-A´ rea Tema´tica de Salud Mental (CIBERSAM).3Departamento de Psiquiatrı´a, Universidad
Auto´noma de Barcelona, Barcelona, Spain.4Clı´nica de Trastornos Adictivos, Instituto Nacional de Psiquiatrı´a Ramo´n de la Fuente Mun˜iz,
Mexico City, Mexico.
Objective: To identify symptom-based subgroups within a sample of patients with co-occurring disorders (CODs) and to analyze intersubgroup differences in mental health services utilization.
Methods:Two hundred and fifteen patients with COD from an addiction clinic completed the Symptom Checklist 90-Revised. Subgroups were determined using latent class profile analysis. Services utilization data were collected from electronic records during a 3-year span.
Results:The five-class model obtained the best fit (Bayesian information criteria [BIC] = 3,546.95; adjusted BIC = 3,363.14; bootstrapped likelihood ratio test po0.0001). Differences between classes
were quantitative, and groups were labeled according to severity: mild (26%), mild-moderate (28.8%), moderate (18.6%), moderate-severe (17.2%), and severe (9.3%). A significant time by class interaction was obtained (chi-square [w2[15]] = 30.05, p = 0.012); mild (w2[1]= 243.90, po0.05),
mild-moderate (w2[1]= 198.03, po0.05), and moderate (w2[1]= 526.77, po 0.05) classes displayed
signi-ficantly higher treatment utilization.
Conclusion:The classes with more symptom severity (moderate-severe and severe) displayed lower utilization of services across time when compared to participants belonging to less severe groups. However, as pairwise differences in treatment utilization between classes were not significant between every subgroup, future studies should determine whether subgroup membership predicts other treatment outcomes.
Keywords: Co-occurring disorders; latent class profile; treatment utilization; psychiatric symptoms
Introduction
A large body of evidence suggests that psychiatric symp-toms are very common in samples of patients with sub-stance use disorders (SUDs).1,2This circumstance, known as co-occurring disorders (CODs), is linked to poor treat-ment response and worse overall clinical outcomes across the patient’s lifespan.3
Current perspectives in psychiatry propose that the introduction of modern mental disorders classifications (ICD and DSM) has resulted in the appearance of condi-tions known as ‘‘subsyndromal’’ or ‘‘subthreshold’’ dis-orders. These are defined as psychiatric syndromes that do not endorse enough diagnostic criteria to be considered full-criteria mental disorders, and are frequently coded as ‘‘not otherwise specified’’ in current diagnostic systems.4,5
As a response, the use of a dimensional or spectrum-based approach toward disease classification (understood as a continuum of the severity of psychiatric symptoms that ranges from the mildest to the most severe manifestation of the disorders) has been proposed to reduce uncertainty when assessing psychiatric comorbidities.6,7
The heterogeneity resulting from the possible combina-tions between CODs and psychiatric symptoms plays a major role in clinical decision making. Therefore, unveiling subtypes of such symptoms in patients with COD is imperative8and should be the first step toward developing tailored and adaptive interventions.9
The latent class profile (LCP) is a numerical extension of latent class analysis (LCA), a person-centered (rather than variable-centered) approach which has proven use-ful in testing whether meaninguse-ful subgroups exist within a population.10LCP is a finite mixture model that assumes the existence of two or more underlying subgroups within a population, where the subgroups are defined as the inter-section of a manifest set of numerical indicators.11
Regardless of the amount of evidence pointing out that contact with mental health services in patients with COD is briefer when compared to SUD-only patients,12 it is Correspondence: Rodrigo Marı´n-Navarrete, Unidad de Ensayos
Clı´nicos en Adicciones y Salud Mental, Instituto Nacional de Psiquiatrı´a Ramo´n de la Fuente Mun˜iz, Calzada Me´xico-Xochimilco, 101, 14370, San Lorenzo Huipulco, Tlalpan, Me´xico D.F., Mexico. E-mail: [email protected]
Submitted Mar 31 2016, accepted Aug 22 2016, Epub Jan 09 2017.
Associac¸a˜o Brasileira de Psiquiatria
clear that the heterogeneity of this population hinders identification of predictors of treatment attendance.13
The objective of this study was twofold: to use LCP to determine whether subgroups based on psychiatric symp-toms exist and, if so, to analyze differences in mental health services utilization between these subgroups.
Methods
Setting
Data collection was carried out at Clı´nica de Trastornos Adictivos, Instituto Nacional de Psiquiatrı´a Ramo´n de la Fuente Mun˜iz (CTA-INPRFM), Mexico City, Mexico, between January 2012 and November 2014. The CTA-INPRFM is an outpatient treatment program special-ized in pharmacological and psychological treatment of patients with COD.
Participants
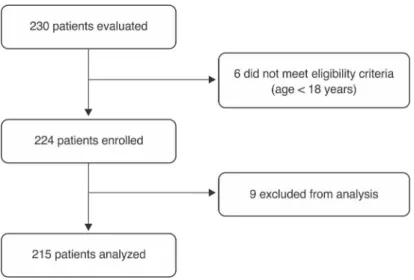
Consecutive patients were recruited at treatment intake in CTA-INPRFM. Patients were eligible for participation if they endorsed criteria for COD (defined as endorsing any SUD and any non-addictive psychiatric disorder simultaneously) and were at least 18 years old. Patients for whom data were missing were excluded from the analyses. Figure 1 displays participant flow during the study.
Measures
The Spanish version of the Symptom Checklist 90-Revised version (SCL-90-R) was used to assess psychiatric symp-toms.14 The psychometric properties of this scale have been published elsewhere.15The SCL-90-R is composed of 90 items distributed across nine subscales: somatiza-tion (SOM), obsessive-compulsive (O-C), interpersonal sensitivity (I-S), depression (DEP), anxiety (ANX), hostility (HOS), phobic anxiety (PHOB), paranoid ideation (PAR),
and psychoticism (PSY). Responses are given on a five-point Likert scale, and the score of each subscale is the mean of the responses to its items. For this study, the subscale scores were taken as observable indicators of psychiatric symptoms.
Mental health services utilization was measured as the number of visits to CTA-INPRFM for psychiatric or behav-ioral treatment over 6-month periods. Participants’ records were tracked during a span of 3 years.
Psychiatric disorders and SUDs were assessed by a fully trained psychiatrist from the CTA-INPRFM team based on the DSM-IV-TR criteria. Diagnoses were grouped into the following broad categories: depressive disorders (including major depressive disorders and dysthymia); anxiety disorders (including social phobia, agoraphobia, generalized anxiety disorders, and post-traumatic stress disorder); bipolar disorders (including bipolar I and II disorders); psychotic disorders (including schizophrenia, brief psychotic disorders, and substance-induced disorders); attention deficit/hyperactivity disorder (ADHD); eating disorders (including anorexia, bulimia nervosa, and non-specific eating disorders); any somato-form disorder; personality disorders from clusters A, B, and C; and alcohol, cannabis, cocaine, inhalants, and other SUDs (including substances with lower prevalence, such as benzodiazepines, opiates, hallucinogens, and MDMA).
Procedures
At intake, the CTA-INPRFM on-site research team evaluated all patients for eligibility. Within the following week, eligible patients returned for clinical assessment. During this assessment session, an on-site researcher provided information on the study’s aims and procedures and, after obtaining written informed consent from the patient, collected data on demographic characteristics and administered the SCL-90-R. Participants’ visits at the CTA-INPRFM and psychiatric/SUD diagnoses were extracted from their electronic records.
Statistical analysis
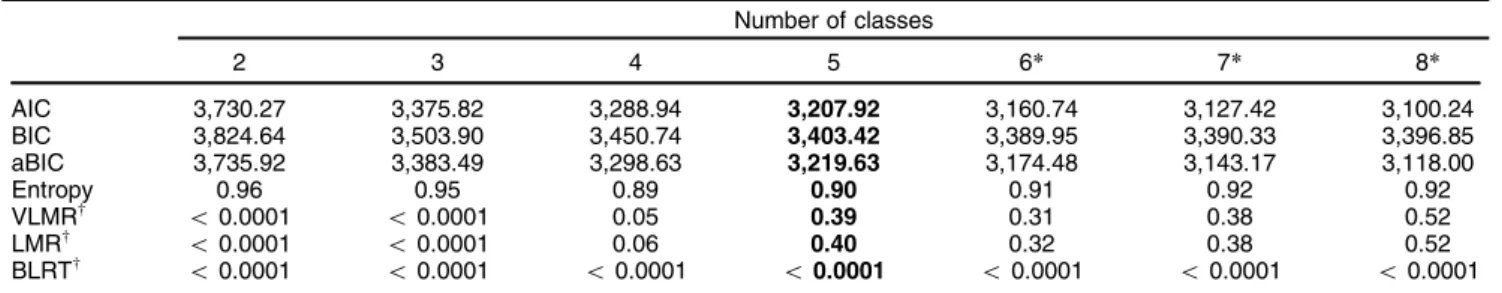
The nine SCL-90-R composite scores were included as numerical indicators in the LCP. Two- to eight-class LCP models were evaluated. Bayesian information criteria (BIC), sample-adjusted BIC (aBIC), class entropy, and the boot-strapped likelihood ratio test (BLRT) were estimated for every class. To determine which model obtained the best comparative fit, we used the recommendations of Nylund et al.,16 considering the best-fitting model as that with the lowest BIC, aBIC, and a significant BLRT (po0.05). To prevent local solutions, every model was
estimated with 1,000 random starts and 10 optimizations. We operationalized a global solution as the replication of the best log-likelihood in eight of 10 optimizations. This analysis was performed in the Mplus6 statistical software package17 using maximum likelihood estimation with standard errors. Missing data were assumed to be com-pletely at random (MCAR); therefore, we used the full information maximum likelihood approach to handle missing data, as it has shown better results in Monte Carlo simulation studies.18For this purpose, we tested the MCAR assumption using a method based on esti-mation of multivariate normality and homoscedasticity.19 Differences in psychiatric disorders and SUDs between classes were tested using the chi-square statistic. To compare differences in mental health services utilization between the classes, we used generalized estimating equations (GEEs) for negative binomial distribution and a logit link function to analyze the time by class interaction, using SPSS version 19.0. GEE, a repeated-measures statistical analysis for count and categorical variables, is useful when the structure of the covariance matrix is unknown.20The significance level was set at po0.05.
Ethical considerations
All patients provided written informed consent for partici-pation in the study. To maintain confidentiality, all data provided to the research team were anonymized. The study protocol, informed consent form, and assess-ment materials were approved by the Institutional Ethics Committee.
Results
Sample characteristics
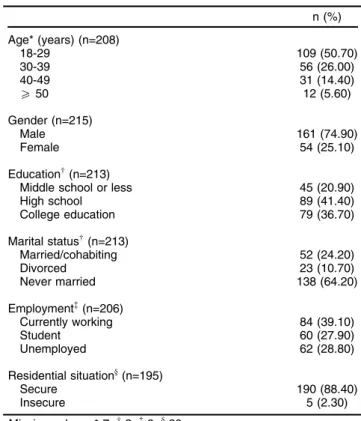
Of the 231 enrolled participants, 215 (96.1%) completed all required data for analysis. Most participants were male, with a mean age of 30.85 years (standard deviation = 10.30 years). Most reported being currently employed, completed high school, and having never been married (Table 1).
Testing for the MCAR assumption
The first step was to conduct the Hawkins test, which yielded po0.001. This indicates rejection of the
assump-tions of multivariate normality and homoscedasticity. We then conducted a nonparametric analysis, which
yielded p = 0.329. These results are consistent with insufficient evidence to reject the MCAR assumption.
Latent class model selection
When the LCP analysis was performed, six-, seven-, and eight-class models obtained the best results in goodness-of-fit measures (Table 2). However, after performing LCP with 1,000 random starts, these models failed to obtain global solutions, resulting in seven replications for the six-class model and two for the seven- and eight-class models. In the remaining models (two to five classes), the best log-likelihood was replicated 10 times in 10 opti-mizations. With regard to goodness-of-fit, the five-class model yielded the best BIC, aBIC, and BLRT results. Table 2 displays goodness-of-fit measures from two- to eight-class models.
Description of the five-class model
Figure 2 displays a plot representation of the subscale mean scores obtained in the five-class model. Taking into account that differences between classes are mostly quan-titative, we decided to label the resulting classes based on relative severity, from mild (which was characterized by individuals with the lowest mean scores on all nine of the SCL-R dimensions) to severe (which had participants with the highest mean scores across all dimensions). Prevalence for each class was as follows: mild, 26%; mild-moderate, 28.8%; moderate, 18.6%; moderate-severe, 17.2%; and severe, 9.3%.
Table 1 Patients’ characteristics
n (%)
Age* (years) (n=208)
18-29 109 (50.70)
30-39 56 (26.00)
40-49 31 (14.40)
X50 12 (5.60)
Gender (n=215)
Male 161 (74.90)
Female 54 (25.10)
Educationw(n=213)
Middle school or less 45 (20.90)
High school 89 (41.40)
College education 79 (36.70)
Marital statusw(n=213)
Married/cohabiting 52 (24.20)
Divorced 23 (10.70)
Never married 138 (64.20)
Employment=(n=206)
Currently working 84 (39.10)
Student 60 (27.90)
Unemployed 62 (28.80)
Residential situationy(n=195)
Secure 190 (88.40)
Insecure 5 (2.30)
On between-class comparison of demographic char-acteristics, only gender was significantly different (w2[4]= 12.504, po0.05). The most prevalent psychiatric
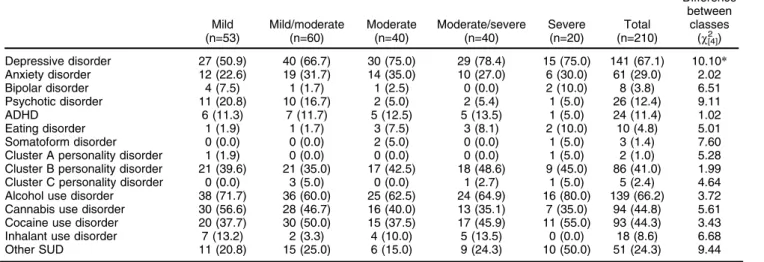
disorders were depressive (67.1%) and cluster B person-ality disorders (41%), while the most common SUDs were alcohol (66.6%), cannabis (44.8%), and cocaine (44.3%) use disorders. When comparing differences in psychiatric and SUDs in the five-class model, only depression was found to be significant (w2[4] = 10.107, po0.05). These
results imply that distribution for most disorders was class-independent (Table 3).
Differences in mental health service utilization by class
Before estimating the association of each class with number of service visits, we tested the effects of demographic variables on this outcome. No significant variable by time interactions were found for gender (w2[4]= 8.20, p = 0.084), age (w2[5]= 0.78, p = 0.37), marital status (w2[5]= 6.45, p = 0.26), or education (w2[15]= 5.57, p = 0.35).
A significant time effect was found (w2[5] = 323.25, p o 0.001), indicating that the amount of visits
de-creased significantly over time. While no significant main effects of the classes where found (w2[5] = 2.34, p = 0.67), a significant time by class interaction was obtained (w2[15]= 30.05 p = 0.01), indicating differences between the classes across time. When analyzing results across classes, significant differences were found between classes with lower severity (mild, mild/moderate, and moderate) when compared to the more severe (moderate/severe) (Table 4).
Discussion
The present study sought to determine the existence of psychiatric symptom subgroups in a sample of COD outpatients and to assess whether the resulting sub-groups differed significantly in their utilization of mental health services. On LCP analysis, a five-class model based on levels of symptom severity obtained the best fit. Participants in the classes with higher symptom severity
Table 2 Fit measures of latent profile analysis models
Number of classes
2 3 4 5 6* 7* 8*
AIC 3,730.27 3,375.82 3,288.94 3,207.92 3,160.74 3,127.42 3,100.24 BIC 3,824.64 3,503.90 3,450.74 3,403.42 3,389.95 3,390.33 3,396.85 aBIC 3,735.92 3,383.49 3,298.63 3,219.63 3,174.48 3,143.17 3,118.00
Entropy 0.96 0.95 0.89 0.90 0.91 0.92 0.92
VLMRw
o0.0001 o0.0001 0.05 0.39 0.31 0.38 0.52
LMRw
o0.0001 o0.0001 0.06 0.40 0.32 0.38 0.52
BLRTw
o0.0001 o0.0001 o0.0001 o0.0001 o0.0001 o0.0001 o0.0001
aBIC = adjusted-Bayesian information criteria; AIC = Akaike information criterion; BIC = Bayesian information criteria; BLRT = bootstrapped likelihood ratio test; LMR = Lo-Mendell-Rubin test; VLMR = Vuong-Lo-Mendell-Rubin test.
*Failed to obtain a global solution. wp-values.
(moderate-severe and severe) displayed lower utilization of services across time when compared to participants belonging to less severe groups (mild, mild-moderate, and moderate).
These results are in line with a body of work which points toward the integration of both a categorical and a dimensional (understood as symptom severity, expressed by the score of a particular subscale item) approach to patient classification. For instance, studies seeking to find subgroups based on combinations of psychiatric comorbidities in adolescents,21patients with posttraumatic stress disorder (PTSD),22 patients with schizophrenia,23 and the general population24-26 obtained solutions with quantitative and qualitative differences between classes, suggesting that subgroups are mostly based on combina-tions of specific disorders and symptom severity. In another study,27carried out with adults seeking treatment for sub-stance use, the best fit was obtained by a three-class model with quantitative differences only (classes were labeled as SUD-only, co-occurring major depressive disorder, and multimorbidity). This implies that, similarly to our findings and despite methodological and sample differences (i.e., indicators were categorical), psychiatric symptoms in patients with COD might be distributed
across distinctive levels of severity. A study performed in a sample of trauma-exposed soldiers,28 which also used a dimensional approach to assess depression, anxiety, and PTSD symptoms, also reported that the best fit was obtained by a three-class model with only quantitative differences. This suggests that differences in psychiatric symptoms between COD patients might be attributable more to symptom severity than to combi-nations of disorders.
Taking into account that the dimensions of symptoma-tology measured by the SCL-90-R are only those within the internalizing spectrum and that previous studies assessing psychiatric symptom subgroups have obtained models with quantitative differences only,28,29our results may be explained by the existence of a hierarchical structure of emotional disorders,30 which includes mood and anxiety disorders, assuming that such disorders are highly interrelated and dependent on a higher-order construct (labeled ‘‘emotional disorders’’). These results indicate that the emotional disorders might encompass all possible ‘‘subthreshold’’ and ‘‘full-criteria’’ cases of comor-bidity, e.g., from mild depressive symptoms to severe major depressive disorder). A similar pattern was also found on the SCL-90-R subscales related to psychotic symptoms
Table 3 Psychiatric and substance use disorders (SUDs) by class (n=210)
Mild (n=53)
Mild/moderate (n=60)
Moderate (n=40)
Moderate/severe (n=40)
Severe (n=20)
Total (n=210)
Difference between
classes (w2[4])
Depressive disorder 27 (50.9) 40 (66.7) 30 (75.0) 29 (78.4) 15 (75.0) 141 (67.1) 10.10* Anxiety disorder 12 (22.6) 19 (31.7) 14 (35.0) 10 (27.0) 6 (30.0) 61 (29.0) 2.02 Bipolar disorder 4 (7.5) 1 (1.7) 1 (2.5) 0 (0.0) 2 (10.0) 8 (3.8) 6.51 Psychotic disorder 11 (20.8) 10 (16.7) 2 (5.0) 2 (5.4) 1 (5.0) 26 (12.4) 9.11
ADHD 6 (11.3) 7 (11.7) 5 (12.5) 5 (13.5) 1 (5.0) 24 (11.4) 1.02
Eating disorder 1 (1.9) 1 (1.7) 3 (7.5) 3 (8.1) 2 (10.0) 10 (4.8) 5.01 Somatoform disorder 0 (0.0) 0 (0.0) 2 (5.0) 0 (0.0) 1 (5.0) 3 (1.4) 7.60 Cluster A personality disorder 1 (1.9) 0 (0.0) 0 (0.0) 0 (0.0) 1 (5.0) 2 (1.0) 5.28 Cluster B personality disorder 21 (39.6) 21 (35.0) 17 (42.5) 18 (48.6) 9 (45.0) 86 (41.0) 1.99 Cluster C personality disorder 0 (0.0) 3 (5.0) 0 (0.0) 1 (2.7) 1 (5.0) 5 (2.4) 4.64 Alcohol use disorder 38 (71.7) 36 (60.0) 25 (62.5) 24 (64.9) 16 (80.0) 139 (66.2) 3.72 Cannabis use disorder 30 (56.6) 28 (46.7) 16 (40.0) 13 (35.1) 7 (35.0) 94 (44.8) 5.61 Cocaine use disorder 20 (37.7) 30 (50.0) 15 (37.5) 17 (45.9) 11 (55.0) 93 (44.3) 3.43 Inhalant use disorder 7 (13.2) 2 (3.3) 4 (10.0) 5 (13.5) 0 (0.0) 18 (8.6) 6.68 Other SUD 11 (20.8) 15 (25.0) 6 (15.0) 9 (24.3) 10 (50.0) 51 (24.3) 9.44
Data presented as n (%).
ADHD = attention deficit/hyperactivity disorder;w2= chi-square. Data from five participants was missing for this analysis. *po0.01.
Table 4 Between-class differences in mental health services utilization Months since intake
Differences between classes
6 12 18 24 30 36 (w2[1])
Mild 14.33 (22.14) 3.69 (10.70) 2.08 (5.18) 0.49 (1.80) 0.37 (1.14) 0.10 (0.50) 243.90* Mild/moderate 13.04 (13.97) 0.95 (1.69) 0.93 (2.74) 0.58 (1.98) 0.31 (1.27) 0.05 (0.40) 198.03* Moderate 13.74 (15.38) 4.00 (9.18) 2.55 (7.71) 1.08 (3.43) 0.00 (0.00) 0.05 (0.32) 526.77* Moderate/severe 17.26 (13.83) 2.24 (3.66) 1.35 (3.18) 0.47 (1.63) 0.00 (0.00) 0.00 (0.00) 0.947 Severew 10.33 (9.41) 3.00 (6.09) 0.44 (0.85) 0.89 (3.77) 0.00 (0.00) 0.00 (0.00) -Total 13.99 (16.37) 2.66 (7.29) 1.57 (4.75) 0.66 (2.43) 0.18 (0.90) 0.05 (0.36)
-Data presented as mean (standard deviation). *po0.01.
w
(psychoticism and paranoid ideation), suggesting, at least partially, that such symptoms might be closely related to the emotional disorders construct.
It is important to note that significant time effects were found, implying that the probability of using mental health services in the overall sample decreased over time. In addition, a significant time by class interaction was found, indicating that the frequency of clinic visits decreased more steeply in classes with greater symptom severity. Research into mental health services utilization by patients with COD has yielded mixed findings; however, a major limitation of many studies focused on this subject is the exclusion of patients with acute and severe mental disorders.31Furthermore, previous studies analyzing the effect of psychiatric symptom severity on service utiliza-tion32,33 have also found a direct association between these two variables. This may be explained by the increase in interpersonal difficulties at higher levels of disease severity, which may lead to difficulty receiving feedback and instructions from the clinician,34 or by higher levels of self-stigma and internalized shame, which reduce overall participation in mental health services.35
The results of the present study stress the importance of using person-centered (rather than variable-centered) approaches, such as LCA and LCP, because the differen-ces in treatment utilization found between classes imply that differential characteristics in this variable exist between subgroups, suggesting that the use of a categorization based on symptom severity might help achieve better patient classification. This, in turn, may be a useful tool for tailoring treatment.
Nevertheless, further studies are needed to analyze – through longitudinal models, such as latent growth mix-ture modeling or latent trajectories analysis – the stability of such latent class models and to link class membership to other variables of treatment response, promoting the development of adaptive treatment interventions for patients with CODs.
As mentioned before, the restriction to assessing internalizing symptoms with the SCL-90-R precluded inclusion of externalizing symptoms, such as those related to ADHD, antisocial behavior, and impulse control (highly prevalent in this sample), thus limiting the scope of our results regarding the whole spectrum of psychiatric symptoms. On the other hand, even though the sample size was not small in absolute terms, when dividing it into five subgroups, the power to find associations between disorders with low prevalence and class membership and our ability to control for covariates such as gender may have been compromised. Another potential limitation of this study is that pairwise differences in treatment utiliza-tion across time were not found between every subgroup; the mild, mild-moderate, and moderate groups displayed significant differences only when compared to the moderate-severe and moderate-severe classes, indicating that the model did not find complete validation for this distal variable and may exhibit better external validity for treatment outcomes (substance use or psychiatric severity).
Despite these limitations, our findings support the use of a dimensional approach for categorization of patients with COD in order to account for possible subtypes that
may impact treatment outcomes. Further studies are needed to ascertain whether class membership predicts a differential response to treatment in outcomes such as psy-chiatric symptoms or days of substance use; to assess the replicability of the LCP model in samples with a higher level of severity, such as residential patients; and to determine whether gender-related differences exist within the model.
To the best of our knowledge, this was one of the first studies to use such an approach to analyze mental health services utilization on a sample of patients with COD and provide evidence of the importance of developing empi-rically derived subgroups for treatment planning in these patients.
Acknowledgements
The authors thank Lorena Larios-Cha´vez, MSc, and Elvia Pe´rez-Va´zquez, BSc, for their valuable contributions to the logistic coordination of data collection procedures. This study is part of the project Development of a Clinical Trial Network on Addiction and Mental Health in Mexico, funded by the U.S. Department of State (grants SINLEC-11GR0015/A001/A002 to Instituto Nacional de Psiquiatrı´a Ramo´n de la Fuente Mun˜iz, Mexico). The U.S. Depart-ment of State had no role in study design, collection, data analysis or interpretation, manuscript writing, or the decision to submit this paper for publication.
Disclosure
The authors report no conflicts of interest.
References
1 Szerman N, Martinez-Raga J, Peris L, Roncero C, Basurte I, Vega P, et al. Rethinking dual disorders/pathology. Addict Disord Their Treat. 2013;12:1-10.
2 Marin-Navarrete R, Szerman N. Repensando el concepto de adic-ciones: pasos hacia la patologı´a dual. Salud Ment. 2015;38:395-6. 3 Murthy P, Chand P. Treatment of dual diagnosis disorders. Curr Opin
Psychiatry. 2012;25:194-200.
4 Pincus HA, Davis WW, McQueen LE. ‘‘Subthreshold’’ mental dis-orders. A review and synthesis of studies on minor depression and other ‘‘brand names’’. Br J Psychiatry. 1999;174:288-96.
5 Helmchen H, Linden M. Subthreshold disorders in psychiatry: clinical reality, methodological artifact, and the double-threshold problem. Compr Psychiatry. 2000;41:1-7.
6 Safer DJ, Rajakannan T, Burcu M, Zito JM. Trends in subthreshold psychiatric diagnoses for youth in community treatment. JAMA Psy-chiatry. 2015;72:75-83.
7 Zimmerman M, Rothschild L, Chelminski I. The prevalence of DSM-IV personality disorders in psychiatric outpatients. Am J Psychiatry. 2005;162:1911-8.
8 Green AI, Drake RE. Subtyping and tailoring treatment approaches. J Dual Diagn. 2015;11:1-2.
9 Collins LM, Murphy SA, Bierman KL. A conceptual framework for adaptive preventive interventions. Prev Sci. 2004;5:185-96. 10 Lanza ST, Rhoades BL. Latent class analysis: an alternative
per-spective on subgroup analysis in prevention and treatment. Prev Sci. 2013;14:157-68.
11 Lanza ST, Flaherty BP, Collins LM. Latent class and latent transition analysis. In: Research methods in psychology. Vol. 2. New Jersey: John Wiley & Sons; 2003. p. 663-85.
13 Cui R, Haller M, Skidmore JR, Goldsteinholm K, Norman S, Tate SR. Treatment attendance among veterans with depression, substance use disorder, and trauma. J Dual Diagn. 2016;12:15-26.
14 Derogatis LR, Cleary PA. Confirmation of the dimensional structure of the scl-90: a study in construct validation. J Clin Psychol. 1977;33: 981-9.
15 Cruz FCS, Lo´pez BL, Blas GC, Gonza´lez ML, Cha´vez BRA. Datos sobre la validez y confiabilidad de la Symptom Check List 90 (SCL90) en una muestra de sujetos mexicanos. Salud Ment. 2005;28:72-81. 16 Nylund KL, Asparouhov T, Muthe´n BO. Deciding on the number of
classes in latent class analysis and growth mixture modeling: a Monte Carlo simulation study. Struct Equ Model. 2007;14:535-69. 17 Muthe´n LK, Muthe´n BO. Mplus user’s guide. 6th edition. Los Angeles:
Muthe´n & Muthe´n; 2011.
18 Enders CK, Bandalos DL. The relative performance of full information maximum likelihood estimation for missing data in structural equation models. Struct Equ Modeling. 2001;8:430-57.
19 Jamshidian M, Jalal S, Jansen C. MissMech: An R Package for Testing Homoscedasticity, Multivariate Normality, and Missing Com-pletely at Random (MCAR). J Stat Softw. 2014;56:1-31.
20 Zeger SL, Liang KY. Longitudinal data analysis for discrete and continuous outcomes. Biometrics. 1986;42:121-30.
21 Olino TM, Klein DN, Farmer RF, Seeley JR, Lewinsohn PM. Exam-ination of the structure of psychopathology using latent class analy-sis. Compr Psychiatry. 2012;53:323-32.
22 Mu¨ller M, Vandeleur C, Rodgers S, Ro¨ssler W, Castelao E, Preisig M, et al. Factors associated with comorbidity patterns in full and partial PTSD: findings from the PsyCoLaus study. Compr Psychiatry. 2014;55:837-48.
23 Tsai J, Rosenheck RA. Psychiatric comorbidity among adults with schizophrenia: a latent class analysis. Psychiatry Res. 2013;210:16-20. 24 El-Gabalawy R, Tsai J, Harpaz-Rotem I, Hoff R, Sareen J, Pietrzak RH. Predominant typologies of psychopathology in the United States: a latent class analysis. J Psychiatr Res. 2013;47:1649-57.
25 Vaidyanathan U, Patrick CJ, Iacono WG. Patterns of comorbidity among mental disorders: a person-centered approach. Compr Psy-chiatry. 2011;52:527-35.
26 Weich S, McBride O, Hussey D, Exeter D, Brugha T, McManus S. Latent class analysis of co-morbidity in the Adult Psychiatric Morbidity Survey in England 2007: implications for DSM-5 and ICD-11. Psychol Med. 2011;41:2201-12.
27 Urbanoski K, Kenaszchuk C, Veldhuizen S, Rush B. The clustering of psychopathology among adults seeking treatment for alcohol and drug addiction. J Subst Abuse Treat. 2015;49:21-6.
28 Contractor AA, Elhai JD, Fine TH, Tamburrino MB, Cohen G, Shirley E, et al. Latent profile analyses of posttraumatic stress disorder, depression and generalized anxiety disorder symptoms in trauma-exposed soldiers. J Psychiatr Res. 2015;68:19-26.
29 Au TM, Dickstein BD, Comer JS, Salters-Pedneault K, Litz BT. Co-occurring posttraumatic stress and depression symptoms after sex-ual assault: a latent profile analysis. J Affect Disord. 2013;149:209-16. 30 Watson D. Rethinking the mood and anxiety disorders: a quantitative
hierarchical model for DSM-V. J Abnorm Psychol. 2005;114:522-36. 31 Meier PS, Barrowclough C. Mental health problems: are they or are they not a risk factor for dropout from drug treatment? A systematic review of the evidence. Drugs (Abingdon Engl). 2009;16:7-38. 32 Curran GM, Kirchner JE, Worley M, Rookey C, Booth BM.
Depres-sive symptomatology and early attrition from intenDepres-sive outpatient substance use treatment. J Behav Health Serv Res. 2002;29:138-43. 33 Timko C, Moos RH. Symptom severity, amount of treatment, and 1-year outcomes among dual diagnosis patients. Adm Policy Ment Health. 2002;30:35-54.
34 Doumas DM, Blasey CM, Mitchell S. Adult attachment, emotional distress, and interpersonal problems in alcohol and drug dependency treatment. Alcohol Treat Q. 2006;24:41-54.