Metabolic syndrome and insulin resistance in obese adolescents
Síndrome metabólica e resistência à insulina em adolescentes obesos
Síndrome metabólico y resistencia a la insulina en adolescentes obesos
Amanda Oliva Gobato1, Ana Carolina J. Vasques1, Mariana Porto Zambon1, Antonio de Azevedo Barros Filho1, Gabriel Hessel1
Instituição: Departamento de Pediatria da Faculdade de Ciências Médicas da Universidade Estadual de Campinas (Unicamp), Campinas, SP, Brasil
1Faculdade de Ciências Médicas da Unicamp, Campinas, SP, Brasil ABSTRACT
Objective: To verify the prevalence of metabolic syn-drome and insulin resistance in obese adolescents and its relationship with different body composition indicators.
Methods: A cross-sectional study comprising 79 ado-lescents aged ten to 18 years old. The assessed body com-position indicators were: body mass index (BMI), body fat percentage, abdominal circumference, and subcutaneous fat. The metabolic syndrome was diagnosed according to the criteria proposed by Cook et al. The insulin resistance was determined by the Homeostasis Model Assessment for
In-sulin Resistance (HOMA-IR) index for values above 3.16.
The analysis of ROC curves was used to assess the BMI and the abdominal circumference, aiming to identify the subjects with metabolic syndrome and insulin resistance. The cutoff point corresponded to the percentage above the reference value used to diagnose obesity.
Results: The metabolic syndrome was diagnosed in 45.5% of the patients and insulin resistance, in 29.1%. Insulin resistance showed association with HDL-cholesterol (p=0.032) and with metabolic syndrome (p=0.006). All body composition indicators were correlated with insulin resistance (p<0.01). In relation to the cutoff point evaluation, the values of 23.5 and 36.3% above the BMI reference point allowed the identification of insulin resistance and metabolic syndrome. The best cutoff point for abdominal circumference to identify insulin resistance was 40%.
Conclusions: All body composition indicators, HDL-cholesterol and metabolic syndrome showed
correla-tion with insulin resistance. The BMI was the most effective anthropometric indicator to identify insulin resistance.
Keywords: metabolic syndrome x; insulin resistance; obesity; adolescent; body composition; anthropometry.
RESUMO
Objetivo: Verificar a prevalência da síndrome metabólica e da resistência à insulina em adolescentes obesos e sua relação com diferentes indicadores de composição corporal.
Métodos: Estudo transversal com 79 adolescentes de dez a 18 anos. Os indicadores de composição corporal foram: índice de massa corpórea (IMC), porcentagem de gordura corporal, circunferência abdominal e gordura subcutânea. A síndrome metabólica foi diagnosticada segundo os critérios de Cook et al. A resistência à insulina foi determinada pelo índice de
Homeos-tasis Model Assessment for Insulin Resistance (HOMA-IR) para
valores acima de 3,16. Utilizou-se a análise de curvas ROC para avaliar o IMC e a circunferência abdominal, identificando-se os indivíduos com resistência à insulina e síndrome metabólica. O ponto de corte correspondeu ao percentual acima do valor de referência para o diagnóstico de obesidade.
Resultados: A síndrome metabólica foi diagnostica-da em 45,5% dos pacientes e a resistência à insulina, em 29,1%. A resistência à insulina apresentou associação com o HDL-colesterol (p=0,032) e com a síndrome metabólica (p=0,006). Todos os indicadores de composição corporal avaliados apresentaram correlação com a resistência à insulina (p<0,01). Na avaliação dos pontos de corte, os valores de 23,5
Endereço para correspondência: Amanda Oliva Gobato
Estrada do Jequitibá, 1.750, casa 117 – Condomínio Moinho de Vento – Veneza CEP 13274-610 – Valinhos/SP
E-mail: [email protected]
Fonte financiadora: Fundo de Apoio ao Ensino, à Pesquisa e à Extensão (Faepex) – processos nº 146365-11, 57256-11 e 57257-11
Conflito de interesse: nada a declarar
e 36,3% acima do valor de referência do IMC permitiram identificar a resistência à insulina e a síndrome metabólica. O melhor ponto de corte da circunferência abdominal para identificar a resistência à insulina foi de 40%.
Conclusões: Todos os indicadores de composição corporal, o HDL-colesterol e a síndrome metabólica apresentaram correlação com a resistência à insulina. O IMC mostrou-se o indicador antropométrico mais eficaz para identificar a resistência à insulina.
Palavras-chave: síndrome x metabólica; resistência à insulina; obesidade; adolescente; composição corporal; antropometria.
RESUMEN
Objetivo: Verificar la prevalencia del síndrome metabóli-co y de la resistencia a la insulina en adolescentes obesos y su relación con distintos indicadores de composición corporal. Métodos: Estudio transversal con 79 adolescentes de 10 a 18 años. Los indicadores de composición corporal fueron: índice de masa corporal (IMC), porcentaje de grasa corporal, circunferencia abdominal y grasa subcutánea. El síndrome metabólico fue diagnosticado conforme a los criterios de Cook et al. La resistencia a la insulina fue determinada por el índice de Homeostasis Model Assessment for Insulin Resistence
(HOMA-IR) para valores superiores a 3,16. Se utilizó el aná-lisis de curvas ROC para evaluar el IMC y la circunferencia abdominal, identificándose los individuos con resistencia a la insulina y síndrome metabólico. El punto de corte corres-pondió al porcentaje superior al valor de referencia para el diagnóstico de obesidad.
Resultados: El síndrome metabólico fue diagnosticado en 45,5% de los pacientes y la resistencia a la insulina, en 29,1%. La resistencia a la insulina presentó asociación con el HDL-colesterol (p=0,032) y con el síndrome metabólico (p=0,006). Todos los indicadores de composición corporal evaluados presentaron correlación con la resistencia a la in-sulina (p<0,01). En la evaluación de los puntos de corte, los valores de 23,5 y 36,3% por encima del valor de referencia del IMC permitieron identificar la resistencia a la insulina y el síndrome metabólico. El mejor punto de corte de la circunferencia abdominal para identificar la resistencia a la insulina fue de 40%.
Conclusiones: Todos los indicadores de composición corporal, el HDL-colesterol y el síndrome metabólico presentaron correlación con la resistencia a la insulina.
El IMC se mostró el indicador antropométrico más eficaz para identificar la resistencia a la insulina.
Palabras clave: síndrome x metabólico; resistencia a la insulina; obesidad; adolescente; composición corporal; antropometría.
Introduction
Recent data obtained from the Household Budget Survey (HBS) from 2008 to 2009, conirmed the sharp increase in obesity in adolescents over the last 34 years in Brazil. The prevalence increased from 0.4% (1974–1975) to 5.9% (2008–2009) in boys and from 0.7 to 4.0% in girls(1).
The concern with the occurrence of obesity is related to the development of comorbidities and complications caused by excess weight. The fat accumulation is associated with the presence of hypertension and metabolic changes, such as increased triglyceride and blood glucose levels and low HDL-cholesterol(2). Metabolic syndrome (MS) is a disorder represented by a set of risk factors for cardiovascular disease and, in children and adolescents, the initial changes of each of the factors of MS may occur in varied associations, which, even with little expression, determine an unfavorable car-diovascular proile for these young people(3).
The level of risk for cardiovascular disease in children rises with increasing obesity(2). The result is early deposition of fatty plaques in the coronary arteries of adolescents(4); and the outcome in adulthood is the high incidence of premature mortality from cardiovascular disease in individuals who were obese adolescents(5).
Insulin resistance means a reduced ability of insulin to stimulate glucose utilization. Pancreatic β-cells increase the production and secretion of insulin as a compensatory mechanism (hyperinsulinemia), while glucose tolerance remains normal(6). Insulin resistance has been identiied as a problem of collective health and affects even children and adolescents.
Indicators of body composition are strongly associated with metabolic changes, and it is important to verify their relationship with components of metabolic syndrome(7,8) and with insulin resistance(2,9,10).
that are associated to cardiovascular risk factors in adolescents may be useful for preventing cardiovascular diseases in the future. Thus, this study examined the prevalence of meta-bolic syndrome and insulin resistance in obese adolescents, correlating them to different indicators of body composition.
Method
Cross-sectional study with adolescents in the Child and Adolescent Obesity Outpatient Clinic at Hospital de Clínicas da Faculdade de Ciências Médicas (School of Medical Sciences), Universidade Estadual de Campinas (Unicamp). All adoles-cents treated from April 2011 to May 2012 who presented body mass index (BMI) ≥P97 for age and sex, according to the charts of the World Health Organization(11) were invited to participate. We analyzed the clinical, laboratory, and ul-trasonographic characteristics of 79 patients of both sexes, aged from 10 to 18 years, diagnosed with obesity and whose parents/guardians signed an informed consent form.
The anthropometric techniques used to measure weight and height were recommended by Lohman et al(12). BMI was calculated by the Quetelet index (BMI=weight/height2). Waist circumference was measured with tape measure (Sanny®), at the midpoint between the last rib and the upper border of the iliac crest. The values obtained were evaluated using the data proposed by Fernández et al(13), which con-sider risk measures of waist circumference ≥P75, according to gender and age.
The percentage of body fat was measured by dual energy X-ray absorptiometry (DXA), with Hologic® appliance, model Discovery QDR series n. 1005-75. The reference criterion for increased fat percentage suggested by Williams
et al(14) is >25% for boys and >30% for girls, being used as a cutoff point for classiication.
Subcutaneous fat was measured by abdominal ultrasound, with a Toshiba® appliance, Model Power Vision 6000 and 7.5MHz linear transducer. All examinations were performed by the same examiner, with the patient in supine position after fasting for 12 hours. The transducer was positioned on the midline 1cm above the umbilicus, without exerting any pressure on the abdomen, in order not to underestimate the measurement. Subcutaneous fat was measured as the distance (cm) between the skin and the outer face of the fascia of the rectus abdominis muscle.
Blood pressure was evaluated with mercury sphygmo-manometer (Unitec®), using cuff sizes appropriate to the patient’s arm circumference, according to the procedures
recommended by The Brazilian Society of Hypertension. Hypertension was deined from blood pressure values ≥P95 for age, sex, and height percentile.
For laboratory analysis of biochemical tests, blood samples were collected by venipuncture in the morning after fasting for 12 hours. Analysis of fasting blood glucose and lipid proile was performed by enzymatic colorimetric with reagent kit from Roche Diagnostics Lab®. To quantitate basal insulin, we used reagent kit by Lab Siemens Healthcare Diagnostics® and chemiluminescence method. Diagnosis of diabetes mellitus was established in patients with fasting glucose ≥126mg/dL. We considered an abnormal lipid proile when the follow-ing values were obtained: total cholesterol ≥150mg/dL, LDL-cholesterol ≥100mg/dL, HDL-cholesterol <45mg/dL, and triglycerides ≥100mg/dL. The diagnosis of insulin resistance was determined by Homeostasis Model Assessment index for Insulin Resistance (HOMA-IR), which is the product of fasting insulin (mIU/mL) and fasting glucose (mmol/L) divided by 22.5. Insulin resistance was deined when values were above 3.16(15).
MS was diagnosed according to data from Cook et al(3), considering the presence of three or more of the following cri-teria: triglycerides ≥100mg/dL, fasting glucose ≥110mg/dL, HDL-cholesterol ≤40mg/dL, systolic or diastolic blood pressure ≥P90 for age, sex, and height percentile, and waist circumference ≥P90 for age and sex.
Data were analyzed in the IBM Statistical Package for the Social Sciences (SPSS), version 20.0. A descriptive analysis of continuous variables included the calculation of means and their respective standard deviations, whereas categorical variables had their percentages calculated. The Kolmogorov-Smirnov test was used to assess normality of distribution of variables. For variables with normal distribu-tion, Pearson’s correlation test was used and, for those who did not present normal distribution, Spearman’s correlation test was used. The comparison between two independent groups was performed by Student’s t test for variables that passed the normality test; for variables with n<30 or with-out normal distribution, we used the Mann-Whitney’s test. The Kruskall-Wallis test was used to compare the distribu-tion of variables by tertiles of the HOMA-IR. We used the Bonferroni’s post-hoc test for comparison between groups.
The analysis of the ROC (receiver operating characteristic curve) curves, performed with MedCalc 9.3., was used to evalu-ate the performance of BMI and waist circumference, identify-ing, among obese individuals, those with insulin resistance and metabolic syndrome. As this is a population of adolescents with cutoffs for classiication of BMI and waist circumference that vary according to sex and age, we used the increased percentage of BMI and waist circumference regarding the reference value for the diagnosis of obesity (P75 for waist circumference and P97 for BMI) in determined age and sex. The areas under the ROC curves were calculated to evaluate the discriminating power of the variables (BMI to identify MS and insulin resistance, and waist circumference to identify insulin resistance). We used 95%CI. We calculated the sensitivity and speciicity values for all percentages of increased BMI and waist circumference in the sample. The cutoff point with the highest sum of sensi-tivity and speciicity was chosen to optimize the relationship between these two parameters, relecting greater accuracy in the diagnosis. The level of signiicance established was less than 5% (p<0.05) for all tests.
This study was approved by the Research Ethics Committee of the School of Medical Sciences at Unicamp, in December 2010, under number 872/2010.
Results
In the present study 79 patients were evaluated, among which 39 (49.3%) were female, aged from 10 to 18 years
(mean 12.8 years), treated at the Child and Adolescent Obesity Outpatient Clinic at Hospital de Clínicas da Faculdade de Ciências Médicas, Unicamp.
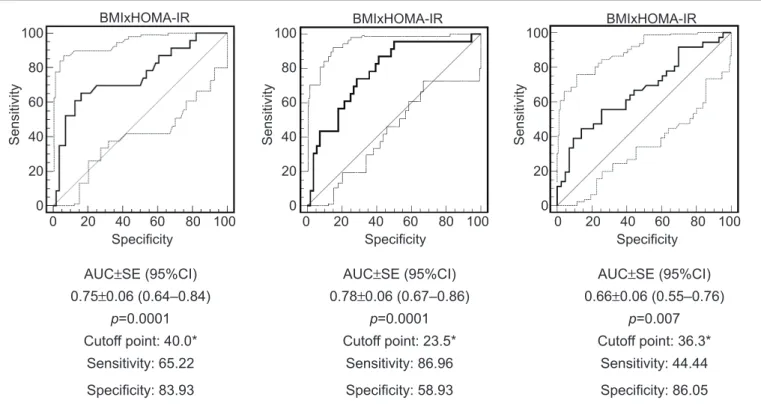
The percentage of body fat differed signiicantly between males and females being higher in girls. Insulin resistance measured by HOMA-IR, as well as serum insulin, also differed signiicantly; likewise, the values were higher in girls (Table 1).
MS was diagnosed in 36 patients (45.5%), 19 (52.8%) females and 17 (47.2%) females. The mean HOMA-IR was signiicantly higher in patients with SM, as well as BMI and LDL-cholesterol.
Among the analyzed patients, 23 (29.1%) presented in-sulin resistance, with 13 (56.5%) females and 10 (43.5%) males. The means for waist circumference, BMI, subcutane-ous fat, and percentage of body fat were greater for patients with insulin resistance. Mean HDL-cholesterol was signii-cantly lower in the patients with insulin resistance(Table 2). When the association test was applied, insulin resistance was significantly associated with HDL-cholesterol — that was below the amount considered appropriate by the Brazilian Society of Cardiology in 19 (82.6%) patients (p=0.032; OR=3.56; 95%CI 1.07–11.84) — and with MS (p=0.006; OR=4.11; 95%CI 1.45–11.67).
All indicators of body composition were positively cor-related with insulin resistance. Regarding the components of MS, only the systolic and diastolic pressures were sig-niicantly correlated with BMI, waist circumference, and
*Mann-Whitney’s test for all variables; HOMA-IR:Homeostasis Model Assessment for Insulin Resistance Table 1 - Clinical and biochemical characteristics of the analyzed adolescents, according to sex
Sex
Total
(n=79) p-value*
Female
(n=39)
Male
(n=40)
Age (years) 12.9±2.7 12.7±1.9 12.8 ±2.3 0.750
Systolic blood pressure (mmHg) 111.0±12.0 116.0±17.0 114.0±15.0 0.194 Diastolic blood pressure (mmHg) 73.0±10.0 75.0±11.0 74.0±11.0 0.393
Waist circumference (cm) 100.6±10.7 102.8±14.3 101.7±12.6 0.372
Body mass index (kg/m2) 32.2±4.9 31.8±5.6 32.0±5.2 0.610
Body fat (%) 43.3±3.8 39.9±5.7 41.6±5.1 0.003
Subcutaneous fat (cm) 4.2±0.8 4.2±1.2 4.2±1.0 0.600
Fasting glucose (mg/dL) 81.8±7.6 84.6±5.9 83.2±6.9 0.037
Fasting insulin (uUI/mL) 14.3±8.4 9.9±8.1 12.1±8.5 0.009
HOMA-IR 2.9±2.0 2.0±1.6 2.5±1.9 0.020
Total cholesterol (mg/dL) 162.0±46.0 163.0±34.0 163.0±40.0 0.750
LDL-cholesterol (mg/dL) 101.0±42.0 101.0±30.0 101.0±36.0 0.638
HDL-cholesterol (mg/dL) 42.0±9.0 42.0±9.0 42.0±9.0 0.795
subcutaneous fat. By correlating the number of factors for MS, only BMI was signiicant. The lipid proile and the glucose levels were not signiicantly correlated with any of the indicators of body composition (Table 3).
Table 4 shows that the distribution of the indicators of body composition showed signiicant differences with the progressive increase in insulin resistance. It is noteworthy that, for BMI, the differences between the tertiles were even more pronounced.
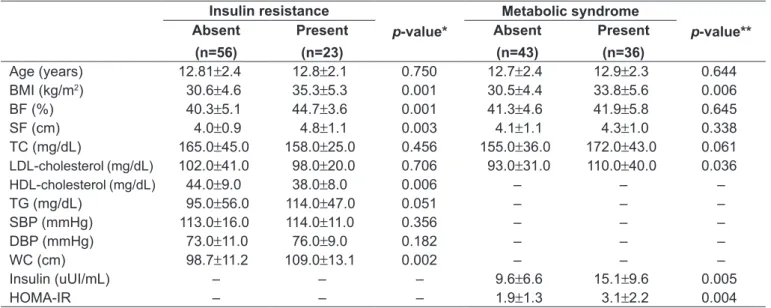
In the evaluation of cutoffs, the percentage values of 23.5 and 36.3 above the reference value of BMI enabled the iden-tiication of insulin resistance and MS, respectively, as they reached the largest sum between the values of sensitivity and speciicity. The best cutoff point for waist circumference to identify insulin resistance was 40% higher than P75.
The sensitivity and speciicity obtained for the cutoff points of BMI and waist circumference, using as an outcome the presence of metabolic syndrome and insulin resistance, are shown in Figure 1.
Discussion
There was a high percentage of MS in the studied popula-tion (45.5%). Published data reported prevalence rates of MS among 28.7 and 44% in obese adolescents(3,16-18). Possibly, the high frequency found in this study results from the sample coming from a University service that treats the most severe cases of obesity. The diversity of prevalence rates can be explained by the fact that there is no universal criterion available to diagnose metabolic syndrome in children and adolescents regarding its components and cutoff points(3,19,20). Chen and Berenson(21) highlighted the limited criteria to characterize MS in children and adolescents and reinforced the importance of a universal deinition. However, it remains worrisome that almost 50% of patients, still quite young
*Mann-Whitney’s test for variables related to insulin resistance; **t test for variables related to metabolic syndrome
BMI: body mass index; BF: body fat; SF: subcutaneous fat; TC: total cholesterol; TG: triglycerides; SBP: systolic blood pressure; DBP: diastolic blood pressure; WC: waist circumference; HOMA-IR:Homeostasis Model Assessment for Insulin Resistance
Table 2 - Characteristics of the subjects according to insulin resistance and metabolic syndrome Insulin resistance
p-value*
Metabolic syndrome
p-value** Absent
(n=56)
Present
(n=23)
Absent
(n=43)
Present
(n=36)
Age (years) 12.81±2.4 12.8±2.1 0.750 12.7±2.4 12.9±2.3 0.644
BMI (kg/m2) 30.6±4.6 35.3±5.3 0.001 30.5±4.4 33.8±5.6 0.006
BF (%) 40.3±5.1 44.7±3.6 0.001 41.3±4.6 41.9±5.8 0.645
SF (cm) 4.0±0.9 4.8±1.1 0.003 4.1±1.1 4.3±1.0 0.338
TC (mg/dL) 165.0±45.0 158.0±25.0 0.456 155.0±36.0 172.0±43.0 0.061
LDL-cholesterol(mg/dL) 102.0±41.0 98.0±20.0 0.706 93.0±31.0 110.0±40.0 0.036
HDL-cholesterol(mg/dL) 44.0±9.0 38.0±8.0 0.006 – – –
TG (mg/dL) 95.0±56.0 114.0±47.0 0.051 – – –
SBP (mmHg) 113.0±16.0 114.0±11.0 0.356 – – –
DBP (mmHg) 73.0±11.0 76.0±9.0 0.182 – – –
WC (cm) 98.7±11.2 109.0±13.1 0.002 – – –
Insulin (uUI/mL) – – – 9.6±6.6 15.1±9.6 0.005
HOMA-IR – – – 1.9±1.3 3.1±2.2 0.004
%BF: percentage of body fat; BMI: body mass index; WC: waist circumference; SF: subcutaneous fat; HOMA-IR:Homeostasis Model Assessment for Insulin Resistance; MS: metabolic syndrome. *p<0.01 Table 3 - Correlations between anthropometric and body composition indicators with components of metabolic syndrome and insulin resistance
%BF BMI WC SF
r r r r
Systolic blood
pressure 0.099 0.501* 0.564* 0.319*
Diastolic blood
pressure 0.053 0.471* 0.534* 0.329*
Fasting glucose -0.025 0.151 0.125 0.165 HDL-cholesterol 0.025 -0.134 -0.071 -0.028 Triglycerides 0.003 0.003 0.162 -0.069
HOMA-IR 0.347* 0.469* 0.428* 0.388*
Number of factors
(mean age 12.8 years), are referred to the Obesity Clinic with a number of associated comorbidities.
Studies sought to determine the features associated with MS in different age groups. In the present study, there was a higher correlation coeficient between the number of fac-tors for MS and BMI, when compared to other measures of body composition(8). The presence of risk factors for MS seems to be more frequent in obese children compared to those with normal weight or overweight, demonstrating
that increased values of BMI increase the occurrence of other risk factors for MS(2,8).
Insulin resistance as assessed by HOMA-IR was observed in 29.1% of the population studied. Higher prevalences were published by other authors(17,22). This variation in the prevalence of insulin resistance in the studies can be explained by the lack of a reference cutoff point to rate the results of the patients(15,23).
It was observed an association between insulin re-sistance and decreased HDL-cholesterol in the present
Specificity BMIxHOMA-IR
Sensitivity
100
80
60
40
20
0
0 20 40 60 80 100
Specificity BMIxHOMA-IR
Sensitivity
100
80
60
40
20
0
0 20 40 60 80 100
Specificity BMIxHOMA-IR
Sensitivity
100
80
60
40
20
0
0 20 40 60 80 100
AUC±SE (95%CI)
0.75±0.06 (0.64–0.84)
AUC±SE (95%CI)
0.78±0.06 (0.67–0.86)
AUC±SE (95%CI)
0.66±0.06 (0.55–0.76)
p=0.0001 p=0.0001 p=0.007
Cutoff point: 40.0* Cutoff point: 23.5* Cutoff point: 36.3*
Sensitivity: 65.22 Sensitivity: 86.96 Sensitivity: 44.44
Speciicity: 83.93 Speciicity: 58.93 Speciicity: 86.05
*the cutoff corresponds to the percentage above the value considered for the diagnosis
WC: waist circumference; HOMA-IR: Homeostasis Model Assessment for Insulin Resistance; BMI: body mass index; MS: metabolic syndrome; AUC: area under the curve; SE: standard error; 95%CI: 95% conidence interval
Figure 1 - Area under the curve, cutoff, sensitivity and speciicity for anthropometric indicators in the identiication of insulin resistance and metabolic syndrome
*Kruskal-Wallis test:difference between the 1st and the 3rd tertile
Table 4 - Distribution of components of metabolic syndrome and indicators of body composition according to tertiles of insulin resistance in subjects evaluated
Insulin resistance 1st tertile
0.37–1.56
n=27
2nd tertile
1.57–3.05
n=26
3rd tertile
3.06–10.44
n=26
p-value
Waist circumference (cm)* 95.7±10.7 101.9±11.6 107.7±13.0 0.007
Body mass index (kg/m2)* 29.3±3.7 32.1±5.1 34.7±5.5 0.001
Body fat (%)* 39.9±6.0 40.9±4.4 44.0±3.9 0.008
study. This relationship was also noted by other authors in adolescents(9). This inding agrees with the hypothesis that the production of HDL-cholesterol is linked to the degradation of LDL-cholesterol particles, which are im-paired by insulin resistance(24).
Insulin resistance was signiicantly correlated with all indicators of body composition and is consistent with other studies(2,9,10). When adolescences were grouped into tertiles, according to the HOMA-IR to check if the indi-cators of body composition increase according to insulin resistance, it was observed that all indicators of body com-position (BMI, body fat percentage, waist circumference, and subcutaneous fat) raised their means as the values of HOMA- IR increased.
For Sinaiko et al(25), insulin resistance correlates signii-cantly with body fat. We found similar data in a study con-ducted in the United States, in which obese, overweight, and normal weight children and adolescents were evaluated, not-ing that the values of insulin resistance differed accordnot-ing to the degree of obesity, which shows that the interaction of the factors obesity duration and amount of body fat can be the cause of an increased insulin resistance(2).
Among girls, the mean percentage of body fat and insu-lin resistance were signiicantly higher(7). The difference in body fat distribution between the sexes may explain this increase in the percentage of body fat in girls, as there is a redistribution of fat from the extremities to the trunk. This distribution differs between the sexes, because these changes are associated with the levels of estrogen and testosterone. The increase in the percentage of body fat in girls may be associated with the signiicantly higher means of insulin resistance.
Given their peculiarities, prepubertal children have been studied separately from those already in puberty, in which the effects of hormonal changes are already pres-ent, possibly contributing to the exacerbation of insulin resistance(26). In this regard, it is known that insulin and HOMA-IR increase with the progress of puberty. There is evidence that insulin resistance varies according to pubertal development: it increases signiicantly between Tanner stages 1 and 2, remains stable in stages 2, 3, and 4, and drops signiicantly in stage 5(27). In the present study, there were no differences in HOMA- IR regarding age group in the groups with and without insulin resistance. This resistance, physiologically induced by puberty, should not be interpreted as a bias in the estimated frequency of its
presence. The fact that puberty may have an effect on the prevalence of insulin resistance can be viewed as a major factor in the development of adiposity and in the metabolic complications that can be generated(28).
As for the association of MS with insulin resistance, it was observed that in the presence of MS, patients presented a 4.1-fold increased chance of developing insulin resistance. The mean insulin resistance also differed positively when patients with and without MS were compared. Thus, it was demonstrated that the prevalence of risk factors for MS rises with the increase of insulin resistance. In other studies with humans, there was also association between insulin resistance and MS(2,22).
When MS components were correlated with indicators of body composition, it was found that systolic and diastolic blood pressures were positively correlated with BMI(2,9,10), waist circumference(9,10), and subcutaneous fat. Casonatto
et al(29) observed that adolescents from 10 to 13 years with
high waist circumference had mean values of blood pressure signiicantly higher than those with normal waist circumfer-ence, concluding that abdominal obesity is associated with increased blood pressure in adolescents.
In the present study, there was no positive correlation between indicators of body composition with HDL-cholesterol, triglycerides, and fasting glucose. These data seem controversial when compared to other studies. Similarly, Weiss et al(2) found no correlation between BMI and triglycerides, unlike Nasreddine et al(9), who observed a positive correlation of BMI and waist circumference with HDL-cholesterol and triglycerides, but found no correlation between BMI and waist circumference with fasting glucose either.
Anthropometric variables, BMI, and waist circumfer-ence were signiicant predictors of insulin resistance, and BMI presented predictive power for MS. However, BMI appears to be more effective in predicting insulin resistance when compared to waist circumference. It is believed that the use of anthropometric indexes is relevant when it has advantages, such as speed of execution and no need of additional tests.
References
1. Brasil - Instituto Brasileiro de Geograia e Estatística. Pesquisa de Orçamentos Familiares 2008-2009: antropometria e estado nutricional de crianças,
adolescentes e adultos no Brasil. Rio de Janeiro: IBGE; 2010.
2. Weiss R, Dziura J, Burgert TS, Tamborlane WV, Taksali SE, Yeckel CW et al.
Obesity and the metabolic syndrome in children and adolescents. N Engl J Med 2004;350;2362-74.
3. Cook S, Weitzman M, Auinger P, Nguyen M, Dietz WH. Prevalence of a
metabolic syndrome phenotype in adolescents: indings from the third National
Health and Nutrition Examination Survey, 1988-1994. Arch Pediatr Adolesc Med 2003;157:821-7.
4. Berenson GS, Srinivasan SR, Bao W, Newman WP 3rd, Tracy RE, Wattigney WE. Association between multiple cardiovascular risk factors and atherosclerosis in children and young adults: the Bogalusa Heart Study. N Engl J Med 1998;338:1650-6.
5. Must A, Jacques PF, Dallal GE, Bajema CJ, Dietz WH. Long-term morbidity
and mortality of overweight adolescents. A follow-up of the Harvard Growth Study of 1922 to 1935. N Engl J Med 1992;327:1350-5.
6. Oliveira CL, Mello MT, Cintra IP, Fisberg M. Obesity and metabolic syndrome
in infancy and adolescence. Rev Nutr 2004;17:237-45.
7. Alvarez MM, Vieira AC, Sichieri R, Veiga GV. Association between central body anthropometric measures and metabolic syndrome components in a
probabilistic sample of adolescents from public schools. Arq Bras Endrocrinol
Metab 2008;52:649-57.
8. Ferreira AP, Nóbrega OT, França NM. Association of body mass index and insulin resistance with metabolic syndrome in Brazilian children. Arq Bras
Cardiol 2009;93:147-53.
9. Nasreddine L, Naja F, Tabet M, Habbal MZ, El-Aily A, Haikal C et al. Obesity is
associated with insulin resistance and components of the metabolic syndrome in Lebanese adolescents. Ann Hum Biol 2012;39:122-8.
10. Reinehr T, Wunsch R. Relationships between cardiovascular risk proile,
ultrasonographic measurement of intra-abdominal adipose tissue, and waist circumference in obese children. Clin Nutr 2010;29:24-30.
11. World Health Organization [homepage on the Internet]. Growth reference 5-19 years [cited 2013 Jan 10]. Available from: http://www.who.int/growthref/en/ 12. Lohman TG, Roche AF, Martorell R. Anthropometric standardization reference
manual. Champaign: Human Kinetics; 1988.
13. Fernández JR, Redden DT, Pietrobelli A, Allison DB. Waist circumference percentiles in nationally representative samples of African-American, European-American, and Mexican-American children and adolescents. J Pediatr 2004;145:439-44.
14. Williams DP, Going SB, Lohman TG, Harsha DW, Srinivasan SR, Webber LS et al. Body fatness and risk for elevated blood pressure, total cholesterol, and serum lipoprotein ratios in children and adolescents. Am J Public Health 1992;82:358-63.
15. Keskin M, Kurtoglu S, Kendirci M, Atabek ME, Yazici C. Homeostasis model assessment is more reliable than the fasting glucose/insulin ratio and
quantitative insulin sensitivity check index for assessing insulin resistance
among obese children and adolescents. Pediatrics 2005;115:e500-3.
16. Cook S, Auinger P, Li C, Ford ES. Metabolic syndrome rates in United States adolescents, from the National Health and Nutrition Examination Survey, 1999-2002. J Pediatr 2008;152:165-70.
17. Souza MS, Leme RB, Franco RR, Romaldini CC, Tumas R, Cardoso AL et al.
Metabolic syndrome in obese and overweight adolescents. Rev Paul Pediatr 2007;25:214-20.
18. Stabelini Neto A, Bozza R, Ulbrich A, Mascarenhas LP, Boguszewski MC, Campos W. Metabolic syndrome in adolescents of diferrent nutritional status.
Arq Bras Endocrinol Metab 2012;56:104-9.
19. De Ferranti SD, Gauvreau K, Ludwig DS, Newfeld EJ, Newburger JW, Rifai
N. Prevalence of the metabolic syndrome in American adolescents: indings
from the Third National Health and Nutrition Examination Survey. Circulation 2004;110:2494-7.
20. Zimmet P, Alberti KG, Kaufman F, Tajima N, Silink M, Arslanian S et al. The
metabolic syndrome in children and adolescents – an IDF consensus report. Pediatr Diabetes 2007;8:299-306.
21. Chen W, Berenson GS. Metabolic syndrome: deinition and prevalence in
children. J Pediatr(Rio J) 2007;83:1-3.
22. Juárez-López C, Klünder-Klünder M, Medina-Bravo P, Madrigal-Azcárate
A, Mass-Díaz E, Flores-Huerta S. Insulin resistance and its association
with the components of the metabolic syndrome among obese children and adolescents. BMC Public Health 2010;10:318.
23. Matthews DR, Hosker JP, Rudenski AS, Naylor BA, Treacher DF, Turner RC. Homeostasis model assessment: insulin resistance and beta-cell function
from fasting plasma glucose and insulin concentrations in man. Diabetologia
1985;28:412-9.
24. Reinehr T, de Sousa G, Andler W. Longitudinal analyses among overweight, insulin resistance, and cardiovascular risk factors in children. Obes Res 2005;13:1824-33.
25. Sinaiko AR, Steinberger J, Moran A, Prineas RJ, Vessby B, Basu S et al.
Relation of body mass index and insulin resistance to cardiovascular risk
factors, inlammatory factors, and oxidative stress during adolescence.
Circulation 2005;111:1985-91.
26. Madeira IR, Carvalho CN, Gazolla FM, de Matos HJ, Borges MA, Bordallo MA. Cut-off point for Homeostatic Model Assessment for Insulin Resistance (HOMA-IR) index established from Receiver Operating Characteristic (ROC) curve in the detection of metabolic syndrome in overweight pre-pubertal
children. Arq Bras Endocrinol Metabol 2008;52:1466-73.
27. Pankow JS, Jacobs DR Jr, Steinberger J, Moran A, Sinaiko AR. Insulin resistance and cardiovascular disease risk factors in children of parents with the insulin resistance (metabolic) syndrome. Diabetes Care 2004; 27:775-80.
28. Druet C, Dabbas M, Baltakse V, Payen C, Jouret B, Baud C et al. Insulin
resistance and the metabolic syndrome in obese French children. Clin Endocrinol (Oxf) 2006;64:672-8.
29. Casonatto J, Ohara D, Christofaro DG, Fernandes RA, Milanez V, Dias DF
et al. High blood pressure and abdominal obesity in adolescents. Rev Paul
Pediatr 2011;29:567-71.
and MS can be useful to identify children at increased cardiovascular risk.
A possible limitation of this study relates to the use of the measure of subcutaneous fat, because there are no studies in the literature involving obese adolescents and comparing insulin resistance and components of MS with subcutaneous fat, since the measurement of visceral fat is more commonly used due to its higher correlation with cardiovascular diseases.