Sleep Apnea Syndrome in a Large Epidemiological
Sample
Camila Hirotsu, Sergio Tufik, Camila Guindalini, Diego R. Mazzotti, Lia R. Bittencourt, Monica L. Andersen*
Departamento de Psicobiologia, Universidade Federal de Sao Paulo, Sao Paulo, Brazil
Abstract
Introduction:Recurrent hypoxia, which is associated with obstructive sleep apnea syndrome (OSAS), leads to an increase in the degradation of adenosine triphosphatase into xanthine, which in turn increases uric acid concentrations.
Objective:The current study aimed to determine whether an association exists between OSAS and uric acid levels in the peripheral blood from a representative population of Sao Paulo (Brazil).
Methods:A population-based survey adopting a probabilistic 3-stage cluster sample of Sao Paulo was used to represent the population according to gender, age, and socioeconomic class. A total of 1,042 volunteers underwent polysomnography recordings for OSAS diagnosis, blood pressure assessment, and biochemical blood analysis, and answered questionnaires.
Results:Uric acid levels were correlated with most important risk factors for OSAS, such as AHI, desaturation time and index, minimum oxyhemoglobin saturation (SpO2), blood pressure, cholesterol, BMI, triglycerides and arousal, and with OSAS itself. Also, uric acid was increased in OSAS volunteers even after controlling for all confounders. Hyperuricemic volunteers presented lower mean and minimum SpO2and increased desaturation index. Importantly, minimum SpO2was a significant predictor of uric acid levels, which in turn was considered an independent predictor for OSAS in the binary logistic model. However, a ROC curve analysis for establishing cut-off points for uric acid levels as a biomarker of OSAS revealed moderate sensitivity and specificity.
Conclusion:A strong association was found between uric acid levels and OSAS in a representative sample of the population of Sao Paulo. Although they do not qualify for a biomarker alone, uric acid levels may be involved in OSAS severity and should be considered in sleep apnea management in the future.
Citation:Hirotsu C, Tufik S, Guindalini C, Mazzotti DR, Bittencourt LR, et al. (2013) Association Between Uric Acid Levels and Obstructive Sleep Apnea Syndrome in a Large Epidemiological Sample. PLoS ONE 8(6): e66891. doi:10.1371/journal.pone.0066891
Editor:Sudhiranjan Gupta, Texas A & M, Division of Cardiology, United States of America
ReceivedFebruary 14, 2013;AcceptedMay 10, 2013;PublishedJune 24, 2013
Copyright:ß2013 Hirotsu et al. This is an open-access article distributed under the terms of the Creative Commons Attribution License, which permits unrestricted use, distribution, and reproduction in any medium, provided the original author and source are credited.
Funding:This work was supported by grants from Associac¸a˜o Fundo de Incentivo a` Pesquisa (AFIP) and Fundac¸a˜o de Amparo a` Pesquisa do Estado de Sa˜o Paulo (FAPESP) (CEPID 98/14303-3 to ST; 10/50129-1 to CH). LRB, MLA and ST are recipients of CNPq fellowships. The funders had no role in study design, data collection and analysis, decision to publish, or preparation of the manuscript.
Competing Interests:The authors have declared that no competing interests exist.
* E-mail: [email protected]
Introduction
Obstructive sleep apnea syndrome (OSAS) is a highly prevalent disorder affecting 2 to 33% of the population [1,2] (depending on study methodology) and is associated with sympathetic activation, metabolic dysregulation, and neurocognitive changes [3,4]. OSAS is characterized by recurrent apneas associated with cyclic changes in oxyhemoglobin saturation (SpO2) and alterations in heart rate
as well as in blood pressure during sleep [5,6,7]. Epidemiologic evidence has confirmed that OSAS drastically promotes cardio-vascular risks independent of age, sex, race, and other common risk factors for cardiovascular diseases such as smoking, drinking, diabetes mellitus, obesity, dyslipidemia, and hypertension (for review, see [8]). Indeed, patients with severe OSAS display a higher prevalence of coronary artery disease, heart failure, and stroke (for review, see [9]).
infant respiratory distress syndrome [13,14], ill patients [15,16], exercising individuals [17,18] and pulmonary hypertension patients [19].
Hyperuricemia has also been associated with heart failure, multiple proaterogenic processes, and hypertension [20,21], and is considered an independent predictor of death in patients at high risk of cardiovascular disease [22]. In addition, Sahebjami [11] has shown that uric acid excretion is increased in OSAS patients and normalized after continuous positive airway pressure (CPAP) treatment, most likely reflecting an association between hyperuri-cemia and OSAS. Additional studies have also contributed to the hypothesis that uric acid levels and sleep-disordered breathing are related, although none have evaluated these parameters in a large and representative population [23,24,25]. Uric acid formation is a result of the activity of xanthine oxidase, an enzyme that plays a mechanistic role in oxidative stress and cardiovascular diseases. Its production is accompanied by the enhanced synthesis of ROS, which play a significant role in hypoxia-related tissue damage [26].
Considering that the responses to the nocturnal hypoxemia accompanying OSAS may vary among different populations, the aim of this study was to elucidate the possible association between uric acid levels and OSAS through hypoxia-related parameters such as apnea-hypopnea index (AHI), SpO2 and desaturation
index during sleep in an epidemiological sample of Sao Paulo. Moreover, we aimed to understand the possible role of uric acid as a biomarker of OSAS, since inexpensive methods of excluding significant sleep-disordered breathing such as sleep apnea are desirable.
Materials and Methods
Ethics Statement
The study was approved by the local ethical committee (CEP 0593/06) and registered with ClinicalTrials.gov (Identifier NCT00596713), following the principles of the Declaration of Helsinki [27].
The Population Investigated
The Epidemiologic Sleep Study (EPISONO) is a large epidemiological study examining sleep disturbances and their risk factors. The investigation was performed in the city of Sa˜o Paulo, Brazil. When the EPISONO was conducted (2007), Sa˜o Paulo had more than 10 million inhabitants. Complete rational design, sampling, and procedures have been described previously [28].
Figure 1. Serum uric acid levels in control (CTRL) and obstructive sleep apnea syndrome (OSAS) groups stratified by gender.Data are shown as mean6SEM. *p,0.0001 compared to respective CTRL group;#p,0.0001 compared to women gender. doi:10.1371/journal.pone.0066891.g001
Figure 2. Adjusted mean±SEM of uric acid levels (mg/dL) covariated by body mass index (BMI)-categorical, age-categor-ical, gender, race-ethnicity, social class and other cardiovas-cular risk factors (SBP, cholesterol, LDL, HDL, triglycerides and glicemia) in control (CTRL) and obstructive sleep apnea syndrome (OSAS) groups.*p,0.05 compared to CTRL group. doi:10.1371/journal.pone.0066891.g002
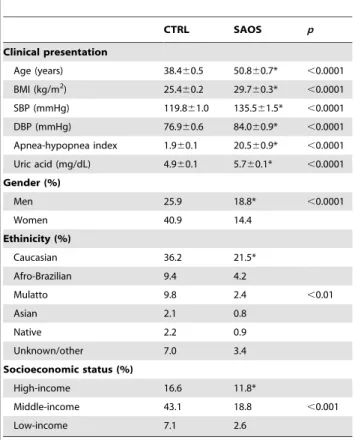
Table 1.Clinical presentation and demographic parameters in the epidemiological sample of Sao Paulo according to OSAS and CTRL groups (N = 1021).
CTRL SAOS p
Clinical presentation
Age (years) 38.460.5 50.860.7* ,0.0001
BMI (kg/m2) 25.4
60.2 29.760.3* ,0.0001
SBP (mmHg) 119.861.0 135.561.5* ,0.0001
DBP (mmHg) 76.960.6 84.060.9* ,0.0001
Apnea-hypopnea index 1.960.1 20.560.9* ,0.0001
Uric acid (mg/dL) 4.960.1 5.760.1* ,0.0001
Gender (%)
Men 25.9 18.8* ,0.0001
Women 40.9 14.4
Ethinicity (%)
Caucasian 36.2 21.5*
Afro-Brazilian 9.4 4.2
Mulatto 9.8 2.4 ,0.01
Asian 2.1 0.8
Native 2.2 0.9
Unknown/other 7.0 3.4
Socioeconomic status (%)
High-income 16.6 11.8*
Middle-income 43.1 18.8 ,0.001
Low-income 7.1 2.6
SBP = systolic blood pressure; DBP = diastolic blood pressure; BMI = body mass index.
*mean or frequency significantly increased when compared to respective CTRL group.
Briefly, this single center study included a total of 1,101 volunteers (men and women) from Sa˜o Paulo. The selection of subjects was performed according to the 3-stage cluster sampling technique to obtain a representative sample from Sa˜o Paulo as previously described [28].
At the time of selection, the volunteers signed the informed consent form and answered the home questionnaires. Of these, 1,042 agreed to undergo polysomnography (PSG); a small amount of volunteers (5.4%) refused the PSG test. Age, gender, and socio-economic status distributions did not significantly differ between the volunteers who accepted PSG recording and those who refused. The subjects arrived 2 hours before bedtime at the Sleep Institute and answered institutional questionnaires. Volunteers underwent a complete overnight PSG and blood samples were collected for biochemical analysis the following day. Those who were receiving uric acid-lowering medications (such as allopurinol
or probenecid), which may impact uric acid levels, were excluded from the present analysis, totaling 1,021 volunteers.
Physical Measurements
General physical measurements were taken immediately before the subjects were prepared for the PSG hook-up, following recommended procedures and utilizing precise instruments. Measurements were taken by 2 trained physical education teachers and included systolic blood pressure (SBP, mmHg), diastolic blood pressure (DBP, mmHg), body weight (kg), height (m) and calculation of body mass index (BMI) using the formula (weight/ height2).
Polysomnography
A full-night PSG was performed using a digital system (EMBLAH S7000, Embla Systems, Inc., Broomfield, CO., USA) at the sleep laboratory during the subject’s habitual sleep time according to previously described [1]. The following physiological variables were monitored simultaneously and continuously: 4 channels for the electroencephalogram (EEG); 2 channels for the electrooculogram; 4 channels for the surface electromyogram (submentonian region, anterior tibialis muscle, masseter region, and seventh intercostal space); 1 channel for an electrocardiogram; airflow detection via 2 channels through a thermocouple (one channel) and nasal pressure (one channel); respiratory effort of the thorax (one channel) and of the abdomen (one channel) using inductance plethysmography; snoring (one channel) and body position (one channel); oxyhemoglobin saturation (SpO2,
percent-age of available hemoglobin that is saturated with oxygen estimated by pulse oximetry); and pulse rate. Desaturation time was calculated through the cumulative percentage sleep time with SpO2#90%. Oxygen desaturation index was calculated by
dividing the total number of oxygen desaturations by the total sleep time, with desaturation defined as a$10s reduction in SpO2
($4% of baseline at the nadir), independent of airflow or thoracoabdominal movement.
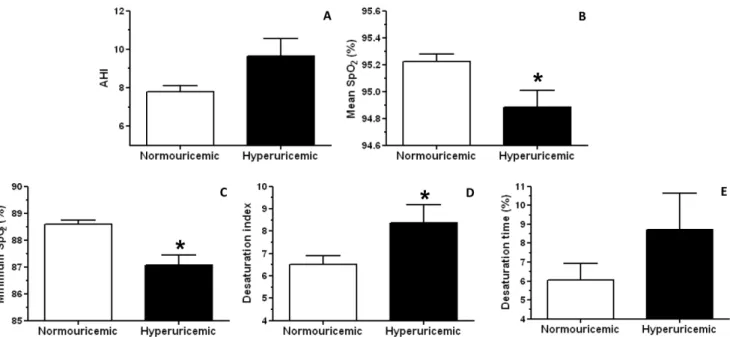
Figure 3. Adjusted mean±SEM of apnea-hypopnea Index (AHI, n = 1020, A), mean oxyhemoglobin saturation (SpO2, n = 1020, B), minimum SpO2(n = 1020, C), desaturation index (n = 843, D) and desaturation time (n = 996, E) covariated by gender, body mass index (BMI)-categorical and age-categorical in normouricemic and hyperuricemic groups.Data are shown as Mean6SEM. *p,0.05 compared to normouricemic group.
doi:10.1371/journal.pone.0066891.g003
Figure 4. Frequency of normouricemia (n = 849) and hyperuri-cemia (n = 172) in control (CTRL, n = 682) and obstructive sleep apnea syndrome (OSAS, n = 339) volunteers.Significant associa-tion between OSAS and hyperuricemia.
Four trained technicians visually scored all PSGs according to standardized criteria for investigating sleep [29]. EEG arousals and leg movements were scored according to the criteria established by the AASM Manual for Scoring Sleep and Associated Events [30]. Apneas were scored and classified following the recommended respiratory rules for adults suggested by the AASM Manual, and hypopneas were scored according to the alternative rules [30]. A registered PSG technologist randomly selected and rescored the sleep stages of 4% of the PSGs in order
to verify their accuracy (agreement rate of 93.365.1%,
k= 0.9160.03).
Clinical Assessment
OSAS was diagnosed according to the criteria of the International Classification of Sleep Disorders (ICSD-2) proposed by American Academy of Sleep Medicine (AASM) [31]. Subjects were diagnosed with OSAS if they had 5#AHI#14.9 and presented at least one of the following complaints: loud snoring, daytime sleepiness, fatigue, and breathing interruptions during
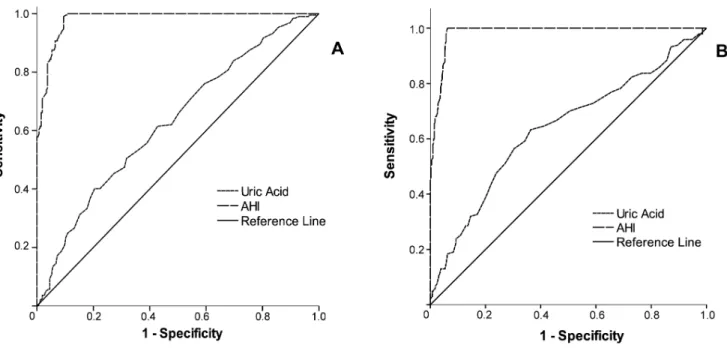
Figure 5. Receiver-operating characteristics (ROC) curve analysis comparing serum uric acid levels and apnea-hypopnea index (AHI) as classifiers for obstructive sleep apnea syndrome (OSAS) diagnostic.
doi:10.1371/journal.pone.0066891.g005
Table 2.Pearson’s correlation coefficients between serum uric acid and risk factors distributed by gender.
Men Women Total population
R p N R P N R P N
Age 0.17 ,0.0001 456 0.27 ,0.0001 565 0.13 ,0.0001 1021
AHI 0.16 ,0.0001 456 0.22 ,0.0001 565 0.25 ,0.0001 1021
Arousal index 0.11 ,0.05 456 0.13 ,0.01 565 0.19 ,0.0001 1021
BMI 0.35 ,0.0001 455 0.45 ,0.0001 565 0.31 ,0.0001 1021
Cholesterol 0.21 ,0.0001 456 0.18 ,0.0001 565 0.14 ,0.0001 1021
Creatinine 0.23 ,0.0001 456 0.26 ,0.0001 565 0.49 ,0.0001 1021
Desaturation index 0.15 ,0.0001 416 0.24 ,0.0001 428 0.21 ,0.0001 844
Desaturation time 0.10 ,0.05 445 0.14 ,0.001 552 0.11 ,0.0001 997
Glucose 0.14 ,0.0001 455 0.16 ,0.0001 565 0.15 ,0.0001 1020
HDL 20.17 ,0.0001 456 20.16 ,0.0001 565 20.34 ,0.0001 1021
LDL 0.10 ,0.05 444 0.16 ,0.0001 563 0.11 ,0.0001 1007
Minimum SpO2 20.20 ,0.0001 456 20.33 ,0.0001 565 20.28 ,0.0001 1021
SBP 0.27 ,0.0001 441 0.29 ,0.0001 551 0.28 ,0.0001 992
Sodium 0.07 .0.05 454 0.11 ,0.01 559 0.11 ,0.001 1013
Triglycerides 0.33 ,0.0001 456 0.29 ,0.0001 565 0.37 ,0.0001 1021
sleep. Subjects with an AHI$15 were diagnosed with OSAS regardless of whether they had any additional complaints. Loud snoring was assessed using the second question of the Berlin Questionnaire for sleep apnea [32]: a positive response included snoring that was ‘‘louder than talking’’ or ‘‘very loud – can be heard in adjacent rooms.’’ Daytime sleepiness was assessed using the Epworth Sleepiness Scale [33] and the 8 questions of the Pittsburgh Sleep Quality Index [34]; Epworth scores higher than 9 and/or frequencies greater than once a week according to the Pittsburgh Index were considered to be positive. Fatigue was assessed with the Chalder Fatigue Scale [35], and scores higher than 4 were considered to be positive. Breathing interruptions were assessed using the fifth question of the Berlin Questionnaire [32] and were considered to be positive when the frequency was ‘‘higher than once a month.’’
Ethnicity and Social Class
Individuals self-reported their ethnic origin according to the following classifications used by the Brazilian Institute of Geography and Statistics (IBGE): Caucasian, Afro-Brazilian, Mixed Race (mulattos), Asian, Native (indigenous), and un-known/other. Social class was defined as high, middle, or low according to the Brazilian Economic Classification Criteria (www. abep.org), as household incomes greater than$15,961 (US dollars), between $4561 and $15,960, and lower than $4560 per year, respectively.
Sample Collection and Biochemical Analysis
Approximately 45 mL of venous blood was collected from subjects’ forearms after 12 hours of overnight fasting. After collection, the tubes were centrifuged at 3,500 rpm for 10 minutes. Serum was kept at room temperature and plasma was stored at 4uC. The blood analysis included the following blood exams: uric acid, creatinine, glucose, total cholesterol and its fractions (LDL and HDL), triglyceride, sodium (Na+) and potassium (K+) levels. All were obtained through automated dosages with an AdviaH
1650 chemistry system (Siemens Healthcare Diagnostics Inc., USA).
Statistical Analysis
All data that did not met the assumptions of normality and homogeneity were Z-score transformed for suitable parametric evaluation. Analyses of covariance (ANCOVA) were used to investigate the effects of OSAS on uric acid levels with control for the confounding variables: BMI, age, gender, social class, ethnicity, and cardiovascular risk factors (SBP, DBP, cholesterol and fractions, triglycerides and glucose levels). To evaluate the
relationship between uric acid levels and OSAS-related risk factors, a Pearson correlation test was performed. To determine the possible predictors of uric acid levels in men, women and the total population, all the variables which presented a significant correlation with uric acid were included in a multiple linear regression model using the stepwise procedure. A Chi-square test was performed to determine the association between uricemia (normouricemic or hyperuricemic) and OSAS. Hyperuricemia was defined by the concentration $95th percentile of the normal distribution curve by gender. Then, binary logistic regression was used to reveal the predictors of OSAS using the backward-conditional method and Hosmer-Lemeshow goodness-of-fit. The categorical variables chosen for the logistic regression were: gender, age (#43 or.43 years), and BMI (#26.8 or.26.8 kg/ m2). The continuous variables chosen for the logistic regression were: SBP, uric acid, total cholesterol, LDL, HDL, triglycerides and glucose. In addition, a receiver-operating characteristics (ROC) curve was used to determine the optimal cut-off point for uric acid as a classifier of OSAS (according to the highest sensitivity and specificity). Significance level was set at 5%. Data are reported as means6standard error of the mean (SEM). All analyses were performed using SPSS 17 (SPSS Inc., Chicago, IL, USA).
Results
Of the 1,042 volunteers enrolled in the study, 21 were excluded for taking medication that could affect uric acid levels. Thus, 1,021
Table 3.Multiple linear regression for uric acid levels predictors in men (n = 437). SBP = systolic blood pressure; SpO2= oxyhemoglobin saturation.
b t p
Constant 8.08 ,0.0001
Triglycerides 0.28 6.55 ,0.0001
Creatinine 0.20 4.49 ,0.0001
SBP 0.16 3.44 ,0.001
Potassium 20.13 22.93 ,0.01
Minimum SpO2 20.13 22.84 ,0.01
doi:10.1371/journal.pone.0066891.t003
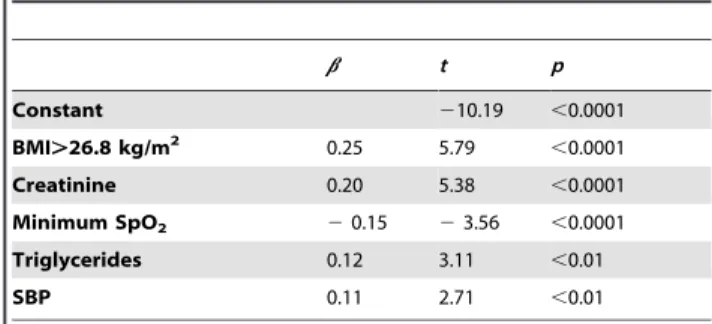
Table 4.Multiple linear regression for uric acid levels predictors in women (n = 550).
b t p
Constant 210.19 ,0.0001
BMI.26.8 kg/m2 0.25 5.79 ,0.0001
Creatinine 0.20 5.38 ,0.0001
Minimum SpO2 20.15 23.56 ,0.0001
Triglycerides 0.12 3.11 ,0.01
SBP 0.11 2.71 ,0.01
SBP = systolic blood pressure; SpO2= oxyhemoglobin saturation; BMI = body mass index.
doi:10.1371/journal.pone.0066891.t004
Table 5.Multiple linear regression for uric acid levels predictors the total sample population (n = 992).
b t p
Constant 10.10 ,0.0001
Gender (men) 0.36 12.23 ,0.0001
Creatinine 0.21 7.04 ,0.0001
Triglycerides 0.18 7.18 ,0.0001
BMI.26.8 kg/m2 0.13 5.03 ,0.0001
SBP 0.11 4.30 ,0.0001
Minimum SpO2 20.10 23.82 ,0.0001
Potassium 20.06 22.61 ,0.01
SBP = systolic blood pressure; SpO2= oxyhemoglobin saturation; BMI = body mass index.
were included in the current study. From these, 177 were missing desaturation index; 29 were missing SBP and DBP; 24 were missing desaturation time; 14 were missing triglycerides and LDL; 8 were missing Na+and K+levels; and 1 was missing glucose and BMI data. Of the 1,021 participants, 456 (44.7%) were men and 565 (55.3%) were women. Mean6SEM age was 42.560.5 years and mean BMI was 26.860.2 kg/m2. Of the 1021 volunteers, 321 were hypertensive (defined as systolic blood pressure equal to and greater than 140 mmHg and/or diastolic blood pressure equal to and greater than 90 mmHg) and 68 reported using an antihyper-tensive. However, there was no significant effect on uric acid levels between hypertensive and non-hypertensive as well as antihyper-tensive users and non-users.
Table 1 illustrates the most important clinical and demographic data in CTRL and OSAS groups (not controlled for confounder variables). Figure 1 shows that the ANOVA revealed group (F1,1017= 47.06; p,0.0001) and gender (F1,1017= 356.83;
p,0.0001) effects, showing that uric acid levels were higher in the OSAS group compared to the control (CTRL) group independent from gender. Also, the levels of uric acid were always higher in men than in women. However, after controlling for BMI and age, the group effect was no longer significant. As the groups were not BMI- and age-matched, we determined the cut-offs for these covariates, i.e., the values from which they statistically affected the analysis as a confounding variable. Thus, these values were used to stratify the population sample into binary groups and
reduce or eliminate the influence of BMI and age in the analysis to better describe the results. Thus, using ANCOVA, the values of the covariates appearing in the model were 26.8 kg/m2for BMI and 43 years old for age. Next, we categorized these variables in 2 bands (15.1–26.8 kg/m2and 26.9–55.0 for BMI-categorical; 20– 43 years old and 44–80 years old for age-categorical). Then, following the same rationale, we proceeded to perform another ANCOVA test controlling for BMI-categorical, age-categorical, gender, ethnicity, social class and other cardiovascular risk factors (SBP, cholesterol, LDL, HDL, triglycerides and glucose). The results still revealed a significant group effect (F1,956= 3.65;
p,0.05), confirming that the OSAS group presented higher levels of uric acid compared to the CTRL group even after control for all confounding factors (Figure 2).
To further evaluate the relationship between uric acid levels and OSAS, we first categorized the uric acid variable into high or low levels. In this sense, hyperuricemia was defined by the concentra-tion$95th percentile of the normal distribution curve by gender. The 95% uric acid values were 7.0 mg/dL in men and 5.7 mg/dL in women. Overall, the prevalence of hyperuricemia was 16.8%, higher in men (9.8%) than in women (7.0%,x2= 15.20, df = 1,
p,0.0001). Figure 3 shows the effects of uricemia, controlled for BMI-categorical, age-categorical, and gender on 5 variables strongly associated with OSAS: AHI (A), mean SpO2 (B),
minimum SpO2(C), desaturation index (D) and desaturation time
(E). Despite the trend for increased AHI in the hyperuricemic compared to normouricemic group, no significant differences were observed (F1,1015= 3.45, p = 0.06) (Figure 3A). Importantly,
ANCOVA analysis revealed an effect of uricemia on the mean SpO2(F1,1015= 6.14, p,0.05), demonstrated by a reduction in the
hyperuricemic compared to the normouricemic group (Figure 3B). Similarly, a significant uricemia effect was found on the minimum SpO2 (F1,1015= 13.32, p,0.0001), showing a decrease in
hyper-uricemic compared to normohyper-uricemic group (Figure 3C). Regard-ing the desaturation index, ANCOVA analysis also demonstrated an uricemia effect (F1,838= 4.13, p,0.05) with increased
desatu-ration index in the hyperuricemic group when compared to the normouricemic (Figure 3D). No differences were found in the desaturation time (F1,991= 1.54, p.0.05) (Figure 3E).
In addition, we found a significant association between hyperuricemia and the presence of OSAS (x2= 40.6, df = 1, p,0.0001, N = 1021). Figure 4 shows that 54% of hyperuricemic volunteers also had OSAS compared to 29% of normouricemic volunteers. To establish the possible predictors of uric acid levels that could be contributing to the association of hyperuricemia and OSAS, we calculated a correlation matrix between uric acid and all sleep, physical and circulating parameters collected (data not shown). Table 2 shows the correlation coefficients of uric acid levels with the most relevant risk factors after the analysis, which were: age, AHI, arousal index, BMI, total cholesterol and fractions, creatinine, desaturation index and time, glucose,
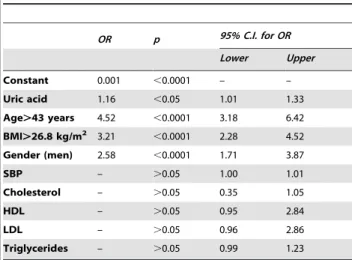
Table 6.Binary logistic regression model for calculation of the odds ratio (OR) related to the obstructive sleep apnea syndrome (OSAS) condition.
OR p 95% C.I. for OR
Lower Upper
Constant 0.001 ,0.0001 – –
Uric acid 1.16 ,0.05 1.01 1.33
Age.43 years 4.52 ,0.0001 3.18 6.42
BMI.26.8 kg/m2 3.21 ,0.0001 2.28 4.52
Gender (men) 2.58 ,0.0001 1.71 3.87
SBP – .0.05 1.00 1.01
Cholesterol – .0.05 0.35 1.05
HDL – .0.05 0.95 2.84
LDL – .0.05 0.96 2.86
Triglycerides – .0.05 0.99 1.23
Adjusted model for the confounding factors: age.43 years, body mass index (BMI).26.8 kg/m2, gender (reference for men), systolic blood pressure (SBP), cholesterol, LDL, HDL and triglycerides (N = 977).
doi:10.1371/journal.pone.0066891.t006
Table 7.Areas under the ROC curves (AURC), cut-offs, sensitivity and specificity of serum uric acid levels in relation to the ability to identify obstructive sleep apnea syndrome (OSAS).
Variable AURC SEM p 95% C.I. Cut off Sensitivity Especificity
Men Uric acid 0.63 0.026 ,0.0001 0.58–0.68 5.95 0.62 0.57
AHI 0.98 0.005 ,0.0001 0.97–0.99
Women Uric acid 0.64 0.028 ,0.0001 0.58–0.69 4.45 0.63 0.64
AHI 0.98 0.004 ,0.0001 0.98–0.99
minimum SpO2, SBP, Na+and triglycerides. Overall, we observed
a slight positive correlation of uric acid levels with age, arousal index, total cholesterol, desaturation index, glucose, LDL and Na+ in the total population. Moreover, a mild positive correlation was observed between uric acid and AHI, BMI, SBP and triglycerides. On the other hand, a mild negative correlation was found between uric acid and HDL and minimum SpO2. A moderate positive
correlation was only observed between uric acid levels and creatinine in the total population sample (R = 0.49, p,0.0001). Next, a multiple linear regression model was performed to identify the possible predictors of uric acid levels in men, women and the total population sample. Importantly, Table 3 shows that in men triglycerides, creatinine, SBP, K+ and minimum SpO
2 entered
into the model explaining 22% of uric acid variability (R = 0.47, R2= 0.22, F5,437= 24.63, p,0.0001, Table 3). In women, the
BMI.26.8 kg/m2, creatinine, minimum SpO2, triglycerides and
SBP entered into the model explaining 27% of uric acid variability (R = 0.52, R2= 0.27, F5,544= 39.32, p,0.0001, Table 4).
Consid-ering the total population, the significant predictors of uric acid levels were gender (men), creatinine, triglycerides, BMI.26.8 kg/ m2, SBP, minimum SpO2, and K+ level (R = 0.68, R2= 0.46,
F7,982= 120.63, p,0.0001, Table 5).
Finally, to verify whether uric acid levels could be, in turn, a risk factor for OSAS in our sample population, a binary logistic regression analysis was performed. Table 6 depicts the model with the most favorable Hosmer-Lemeshow goodness-of-fit (x2= 4.48, df = 8, p.0.05) and the corresponding odds ratio (OR) of each independent predictor of OSAS (22LL = 961.50; x2= 274.24, df = 9, p,0.0001; Cox-Snell R = 0.25; Nagelkerke R = 0.34): age.43 years, BMI.26.8 kg/m2, gender (men) and uric acid levels. Importantly, the results show that an increase in 1 mg/dL in uric acid level was associated with 16% increased risk of OSAS (95% C.I. = 1.01–1.33). The other variables, SBP, cholesterol, HDL, LDL and triglycerides, did not enter the model. Figure 5 and Table 7 show the areas under the ROC curves (AURC) and the optimal cut-off points (according to the highest sensitivity and specificity) of uric acid levels associated with OSAS diagnosis. The best cut-offs were 5.95 mg/dL for men and 4.45 mg/dL for women, which were in the 50th percentile of the uric acid distribution curve and corresponded respectively to a positive predictive value (PPV) and negative positive value (NPV) of 61.0% and 55.7% in men and 37.8% and 82.1% in women.
Discussion
This is the first study showing the influence of OSAS on uric acid levels in an epidemiological sample. Interestingly, the results indicate that individuals diagnosed with OSAS had higher levels of serum uric acid than those without OSAS. Additionally, this effect remained significant after adjustment for confounding factors such as gender, age, BMI, social class, ethnicity, cholesterol, triglycer-ides, blood pressure and glucose, unlike the data published by Garcı´a et al. [25]. Moreover, a higher prevalence of hyperurice-mia was found in men, which is also the gender with more prevalence of OSAS [1,2].
We also demonstrated important associations between uric acid levels and common OSAS-related risk factors such as SpO2, AHI,
arousal index, desaturation, cholesterol and fractions, triglycerides, SBP and BMI in this large sample. Similarly, our data showed that hyperuricemic volunteers, regardless of OSAS diagnosis, presented lower mean and minimum SpO2, and higher desaturation index
during sleep, explaining the strong association found between hyperuricemia and OSAS. Additionally, uric acid was considered an independent predictor of OSAS, being associated with 16%
increased risk of OSAS with each increase of 1 mg/dL in its concentration. Conversely, minimum SpO2entered the multiple
linear regression model as an independent predictor of uric acid levels explaining 10% of its variability, along with other factors such as gender (men), creatinine, triglycerides, BMI.26.8 kg/m2, SBP and serum K+levels. On the other hand, ROC curve analysis revealed that, in both men and women, uric acid levels cut-off points determined through its highest sensitivity and specificity did not qualify for a good biomarker of OSAS, presenting poor PPV and NPV.
A large body of evidence has identified OSAS as an independent risk factor for cardiovascular morbidity and mortality with multiple associated mechanisms [8]. One of them is the oxidative stress [36], which is also a common pathway linked to uric acid production, a process catalyzed by xanthine oxidase [37]. During the production of uric acid, ROS are generated as byproduct and have an important role in the increased vascular oxidative stress. Importantly, xanthine oxidase mediates intermit-tent hypoxia-induced vascular dysfunction and administration of allopurinol can prevent it by increasing intermediates, hypoxan-thine and xanhypoxan-thine, and decreasing the final product uric acid [38,39]. In fact, oxidative stress is reflected by uric acid levels, and its concentration decreases after treatment of sleep disordered breathing according to improvement of respiratory disturbance index and oxygen desaturation index [40]. Elevated serum uric acid levels are also associated with increased risk for cardiovascular mortality [21,41,42]. In fact, most of the cardiovascular risk factors potential overlaps with serum uric acid levels concentrations [43,44,45]. In this sense, a positive association of hyperuricemia with obesity, impaired glucose tolerance, hypertension, history of heart disease and mortality was observed in a large Finland cohort population (aged 40–69) [43]. Moreover, some studies have reported that elevated levels of uric acid are associated not only with the presence of cardiovascular disease but also with poor prognosis of stable coronary artery disease [46], acute myocardial infarction [47,48,49], heart failure [50], stroke [51], and metabolic syndrome [52].
Corroborating Jubber and colleagues [53], we also found an association between BMI and elevated blood concentrations of uric acid. Both hyperuricemia and excessive accumulation of body fat are known to be associated with greater cardiovascular risk and oxidative stress [25,26,54], suggesting that uric acid may have an important role in mediating OSAS in obese patients. Similarly, Verhulst et al. [54] have demonstrated a relationship between the severity of sleep apnea and increased levels of serum uric acid in overweight children and adolescents, independent of abdominal adiposity. In fact, obese individuals present a higher incidence of respiratory diseases, including OSAS, which contributes to increased morbidity and mortality among this population [55,56]. Confirming our hypothesis, the linear regression model presented in the current study showed important participation of the minimum SpO2in the uric acid levels even after control for
supply depends on other factors besides oxyhemoglobin saturation, including hemoglobin concentration, the oxygen-hemoglobin dissociation curve and cardiac output.
Similar to our data, some studies found increased uric acid levels in OSAS patients compared to controls in addition to higher levels of blood pressure, glucose, triglycerides, cholesterol and LDL [60,61]. Drager et al. [61] showed that OSAS was also independently associated with increased uric acid, but with a OR of 4.19 (1.70–10.35), much higher than we found in the current study, likely due to the different populations studied (all patients selected by Drager et al. presented metabolic syndrome). More-over, similar to our findings, Kaditis et al. [62] found that AHI and SpO2 were related to uric acid excretion in Greek (but not
US) children even after adjustments for age, gender, and BMI Z-score. Another study also found a significant correlation between uric acid levels and some sleep,parameters (number of respiratory events, number of desaturations, or the cumulative percentage of time with oxygen saturation less than 90%) [25]. Additionally, they showed that those patients with severe OSAS (AHI$30) had higher uric acid levels than those with mild or no OSAS. However, this difference was not persistent after control for the confounding factors BMI, cholesterol and triglyceride levels [25]. Likewise, Hira et al. [63] found a significant linear relationships of AHI with uric acid while Steiropoulos and colleagues [64] showed that OSAS patients with good compliance to CPAP presented a decrease in uric acid levels after CPAP treatment when compared to those with bad compliance.
Uric acid has been studied in several cardiorespiratory processes that produce hypoxia since this condition leads to increased catabolism of purines. In this sense, uric acid has shown useful as a prognostic marker of heart failure [65], pulmonary thromboem-bolism [66], and primary pulmonary hypertension [19]. A recent study in chronic obstructive pulmonary disease patients using the ratio between uric acid and creatinine has been shown to be more useful than the use of serum uric acid levels alone [67]. However, in our study we did not find the same result, since no significant differences were found using the uric acid/creatinine ratio (data not shown). Moreover, two studies using this method in OSAS patients presented different results. Braghiroli et al. [68] concluded that uric acid/creatinine ratio could be a promising index of significant nocturnal tissue hypoxia, since their OSAS patients had a marked reduction in the uric acid/creatinine ratio after
treatment with CPAP. On the other hand, McKeon et al. [69], studying hypoxemic patients with OSAS before and after CPAP treatment, did not find significant differences in the uric acid/ creatinine ratio. In addition, another study showed that the index of uric acid/creatinine from OSAS patients did not parallel the severity of the AHI or arterial oxygen desaturation, but it was significantly linked to the plasma level of adenosine, which is another marker of tissue hypoxia [12].
Our data indicate that increased uric acid may be an important risk factor for the severity of OSAS, possibly by favoring oxidative stress and endothelial dysfunction. Conversely, minimum SpO2
decrease, resultant from OSAS-hypoxia/reoxygenation cycles, is an important predictor of uric acid levels and may be responsible for the association found between hyperuricemia and OSAS in our epidemiological sample of Sao Paulo. Nevertheless, the best cut-offs for uric acid level as a classifier of OSAS presented around 60% sensibility and 60% specificity, indicating that it fails to be a good biomarker by itself. Probably, a combination of OSAS-related biological analytes rather than only one would be more applicable as a potential biomarker.
Finally, the current study suggests that uric acid measurement may be important in the management of OSAS and its comorbidities, mainly where people do not have access to health-care facilities and sleep laboratories. Since uric acid overproduction is accompanied by an enhanced synthesis of ROS, the current study may contribute to the mechanisms linking sleep-disordered breathing and cardiovascular risk. However, long-term epidemiological studies to verify the consequences of decreasing uric acid concentration in OSAS patients and also to evaluate uric acid levels changes after CPAP treatment are needed.
Acknowledgments
All the efforts of AFIP’s staff, in particular Roberta Siuffi, are deeply appreciated.
Author Contributions
Conceived and designed the experiments: CH MLA ST. Performed the experiments: LRB MLA ST. Analyzed the data: CH CG DRM. Contributed reagents/materials/analysis tools: ST MLA. Wrote the paper: CH MLA.
References
1. Tufik S, Santos-Silva R, Taddei JA, Bittencourt LR (2010) Obstructive sleep apnea syndrome in the Sao Paulo Epidemiologic Sleep Study. Sleep Med 11: 441–446.
2. Young T, Palta M, Dempsey J, Skatrud J, Weber S, et al. (1993) The occurrence of sleep-disordered breathing among middle-aged adults. N Engl J Med 328: 1230–1235.
3. Golbin JM, Somers VK, Caples SM (2008) Obstructive sleep apnea, cardiovascular disease, and pulmonary hypertension. Proc Am Thorac Soc 5: 200–206.
4. Gozal D, Kheirandish-Gozal L (2007) Neurocognitive and behavioral morbidity in children with sleep disorders. Curr Opin Pulm Med 13: 505–509. 5. George CF, Kryger MH (1985) Sleep and control of heart rate. Clin Chest Med
6: 595–601.
6. Guilleminault C, Connolly S, Winkle R, Melvin K, Tilkian A (1984) Cyclical variation of the heart rate in sleep apnoea syndrome. Mechanisms, and usefulness of 24 h electrocardiography as a screening technique. Lancet 1: 126– 131.
7. Sato F, Nishimura M, Shinano H, Saito H, Miyamoto K, et al. (1997) Heart rate during obstructive sleep apnea depends on individual hypoxic chemosensitivity of the carotid body. Circulation 96: 274–281.
8. Vijayan VK (2012) Morbidities associated with obstructive sleep apnea. Expert Rev Respir Med 6: 557–566.
9. Thomas JJ, Ren J (2012) Obstructive Sleep Apnea and Cardiovascular Complications: Perception versus Knowledge. Clin Exp Pharmacol Physiol.
10. Lavie L (2012) Oxidative stress inflammation and endothelial dysfunction in obstructive sleep apnea. Front Biosci (Elite Ed) 4: 1391–1403.
11. Sahebjani H (1998) Changes in urinary uric acid excretion in obstructive sleep apnea before and after therapy with nasal continuous positive airway pressure. Chest 113: 1604–1608.
12. Saito H, Nishimura M, Shibuya E, Makita H, Tsujino I, et al. (2002) Tissue hypoxia in sleep apnea syndrome assessed by uric acid and adenosine. Chest 122: 1686–1694.
13. Jensen MH, Brinklov MM, Lillquist K (1980) Urinary loss of oxypurines in hypoxic premature neonates. Biol Neonate 38: 40–48.
14. Raivio KO (1976) Neonatal hyperuricemia. J Pediatr 88: 625–630.
15. Christensen EF, Jacobsen J, Anker-Moller E, Schultz P, Spangsberg N (1992) Increased urinary loss of uric acid in adults with acute respiratory failure requiring mechanical ventilation. Chest 102: 556–559.
16. Grum CM, Simon RH, Dantzker DR, Fox IH (1985) Evidence for adenosine triphosphate degradation in critically-ill patients. Chest 88: 763–767. 17. Harkness RA, Simmonds RJ, Coade SB (1983) Purine transport and metabolism
in man: the effect of exercise on concentrations of purine bases, nucleosides and nucleotides in plasma, urine, leucocytes and erythrocytes. Clin Sci (Lond) 64: 333–340.
19. Nagaya N, Uematsu M, Satoh T, Kyotani S, Sakamaki F, et al. (1999) Serum uric acid levels correlate with the severity and the mortality of primary pulmonary hypertension. Am J Respir Crit Care Med 160: 487–492. 20. Patetsios P, Rodino W, Wisselink W, Bryan D, Kirwin JD, et al. (1996)
Identification of uric acid in aortic aneurysms and atherosclerotic artery. Ann N Y Acad Sci 800: 243–245.
21. Fang J, Alderman MH (2000) Serum uric acid and cardiovascular mortality the NHANES I epidemiologic follow-up study, 1971–1992. National Health and Nutrition Examination Survey. Jama 283: 2404–2410.
22. Ioachimescu AG, Brennan DM, Hoar BM, Hazen SL, Hoogwerf BJ (2008) Serum uric acid is an independent predictor of all-cause mortality in patients at high risk of cardiovascular disease: a preventive cardiology information system (PreCIS) database cohort study. Arthritis Rheum 58: 623–630.
23. Plywaczewski R, Bednarek M, Jonczak L, Gorecka D, Sliwiniski P (2005) Hyperuricaemia in males with obstructive sleep apnoea (osa). Pneumonol Alergol Pol 73: 254–259.
24. Plywaczewski R, Bednarek M, Jonczak L, Gorecka D, Sliwinski P (2006) Hyperuricaemia in females with obstructive sleep apnoea. Pneumonol Alergol Pol 74: 159–165.
25. Ruiz Garcia A, Sanchez Armengol A, Luque Crespo E, Garcia Aguilar D, Romero Falcon A, et al. (2006) Blood uric acid levels in patients with sleep-disordered breathing. Arch Bronconeumol 42: 492–500.
26. Puig JG, Ruilope LM (1999) Uric acid as a cardiovascular risk factor in arterial hypertension. J Hypertens 17: 869–872.
27. (2009) Declaration of Helsinki. Ethical principles for medical research involving human subjects. J Indian Med Assoc 107: 403–405.
28. Santos-Silva R, Tufik S, Conway SG, Taddei JA, Bittencourt LR (2009) Sao Paulo Epidemiologic Sleep Study: rationale, design, sampling, and procedures. Sleep Med 10: 679–685.
29. Rechtschaffen A, Kales A (1968) A manual of standardized terminology, techniques and scoring system for sleep stages of human subjects: Brain Information Service/Brain Research Institute, UCLA.
30. Iber C, Ancoli-Israel S, Chesson JA, Quan S (2007) The AASM manual for the scoring of sleep and associated events: rules, terminology and technical specifications: Westchester: American Academy of sleep Medicine.
31. AASM (2005) International classification of sleep disorders. Diagnostic and coding manual (ICSD-2). 2nd ed. Westchester, IL.
32. Netzer NC, Stoohs RA, Netzer CM, Clark K, Strohl KP (1999) Using the Berlin Questionnaire to identify patients at risk for the sleep apnea syndrome. Ann Intern Med 131: 485–491.
33. Johns MW (1991) A new method for measuring daytime sleepiness: the Epworth sleepiness scale. Sleep 14: 540–545.
34. Buysse DJ, Reynolds CF 3rd, Monk TH, Berman SR, Kupfer DJ (1989) The Pittsburgh Sleep Quality Index: a new instrument for psychiatric practice and research. Psychiatry Res 28: 193–213.
35. Chalder T, Berelowitz G, Pawlikowska T, Watts L, Wessely S, et al. (1993) Development of a fatigue scale. J Psychosom Res 37: 147–153.
36. Wysocka E, Cofta S, Piorunek T, Dziegielewska-Gesiak S, Bryl W, et al. (2013) Blood antioxidant status, dysglycemia and obstructive sleep apnea. Adv Exp Med Biol 756: 121–129.
37. Schulz E, Gori T, Munzel T (2011) Oxidative stress and endothelial dysfunction in hypertension. Hypertens Res 34: 665–673.
38. Yamazaki I, Soma T, Ichikawa Y, Iwai Y, Kondo J, et al. (1995) [Usefulness of allopurinol for prevention of myocardial reperfusion injury in open heart surgery]. Nihon Kyobu Geka Gakkai Zasshi 43: 26–31.
39. Dopp JM, Philippi NR, Marcus NJ, Olson EB, Bird CE, et al. (2011) Xanthine oxidase inhibition attenuates endothelial dysfunction caused by chronic intermittent hypoxia in rats. Respiration 82: 458–467.
40. Van Hoorenbeeck K, Franckx H, Debode P, Aerts P, Wouters K, et al. (2012) Weight loss and sleep-disordered breathing in childhood obesity: effects on inflammation and uric acid. Obesity (Silver Spring) 20: 172–177.
41. Bergamini C, Cicoira M, Rossi A, Vassanelli C (2009) Oxidative stress and hyperuricaemia: pathophysiology, clinical relevance, and therapeutic implica-tions in chronic heart failure. Eur J Heart Fail 11: 444–452.
42. Bos MJ, Koudstaal PJ, Hofman A, Witteman JC, Breteler MM (2006) Uric acid is a risk factor for myocardial infarction and stroke: the Rotterdam study. Stroke 37: 1503–1507.
43. Reunanen A, Takkunen H, Knekt P, Aromaa A (1982) Hyperuricemia as a risk factor for cardiovascular mortality. Acta Med Scand Suppl 668: 49–59. 44. Bonora E, Targher G, Zenere MB, Saggiani F, Cacciatori V, et al. (1996)
Relationship of uric acid concentration to cardiovascular risk factors in young men. Role of obesity and central fat distribution. The Verona Young Men Atherosclerosis Risk Factors Study. Int J Obes Relat Metab Disord 20: 975–980. 45. Lippi G (2008) Relationship between uric acid, hyperglycemia and
hypertri-glyceridemia in general population. Biochem Med 18: 37–41.
46. Bickel C, Rupprecht HJ, Blankenberg S, Rippin G, Hafner G, et al. (2002) Serum uric acid as an independent predictor of mortality in patients with angiographically proven coronary artery disease. Am J Cardiol 89: 12–17. 47. Lazzeri C, Valente S, Chiostri M, Sori A, Bernardo P, et al. (2010) Uric acid in
the acute phase of ST elevation myocardial infarction submitted to primary PCI: its prognostic role and relation with inflammatory markers: a single center experience. Int J Cardiol 138: 206–209.
48. Kojima S, Sakamoto T, Ishihara M, Kimura K, Miyazaki S, et al. (2005) Prognostic usefulness of serum uric acid after acute myocardial infarction (the Japanese Acute Coronary Syndrome Study). Am J Cardiol 96: 489–495. 49. Duran M, Kalay N, Akpek M, Orscelik O, Elcik D, et al. (2012) High levels of
serum uric acid predict severity of coronary artery disease in patients with acute coronary syndrome. Angiology 63: 448–452.
50. Jankowska EA, Ponikowska B, Majda J, Zymlinski R, Trzaska M, et al. (2007) Hyperuricaemia predicts poor outcome in patients with mild to moderate chronic heart failure. Int J Cardiol 115: 151–155.
51. Karagiannis A, Mikhailidis DP, Tziomalos K, Sileli M, Savvatianos S, et al. (2007) Serum uric acid as an independent predictor of early death after acute stroke. Circ J 71: 1120–1127.
52. Brodov Y, Behar S, Boyko V, Chouraqui P (2010) Effect of the metabolic syndrome and hyperuricemia on outcome in patients with coronary artery disease (from the Bezafibrate Infarction Prevention Study). Am J Cardiol 106: 1717–1720.
53. Jubber AS (2004) Respiratory complications of obesity. Int J Clin Pract 58: 573– 580.
54. Verhulst SL, Van Hoeck K, Schrauwen N, Haentjens D, Rooman R, et al. (2007) Sleep-disordered breathing and uric acid in overweight and obese children and adolescents. Chest 132: 76–80.
55. Nieto FJ, Young TB, Lind BK, Shahar E, Samet JM, et al. (2000) Association of sleep-disordered breathing, sleep apnea, and hypertension in a large community-based study. Sleep Heart Health Study. Jama 283: 1829–1836.
56. Peppard PE, Young T, Palta M, Skatrud J (2000) Prospective study of the association between sleep-disordered breathing and hypertension. N Engl J Med 342: 1378–1384.
57. Conen D, Wietlisbach V, Bovet P, Shamlaye C, Riesen W, et al. (2004) Prevalence of hyperuricemia and relation of serum uric acid with cardiovascular risk factors in a developing country. BMC Public Health 4: 9.
58. Nagahama K, Iseki K, Inoue T, Touma T, Ikemiya Y, et al. (2004) Hyperuricemia and cardiovascular risk factor clustering in a screened cohort in Okinawa, Japan. Hypertens Res 27: 227–233.
59. Desai MY, Santos RD, Dalal D, Carvalho JA, Martin DR, et al. (2005) Relation of serum uric acid with metabolic risk factors in asymptomatic middle-aged Brazilian men. Am J Cardiol 95: 865–868.
60. Drager LF, Lopes HF, Maki-Nunes C, Trombetta IC, Toschi-Dias E, et al. (2010) The impact of obstructive sleep apnea on metabolic and inflammatory markers in consecutive patients with metabolic syndrome. PLoS One 5: e12065. 61. Liu W, Ge R, Mei X, He T, Zhang Q, et al. (2010) [Effect of obstructive sleep apnea- hypopnea syndrome on hypertension and metabolism disorder]. Lin Chung Er Bi Yan Hou Tou Jing Wai Ke Za Zhi 24: 1074–1076.
62. Kaditis A, Gozal D, Snow AB, Kheirandish-Gozal L, Alexopoulos E, et al. (2010) Uric acid excretion in North American and Southeast European children with obstructive sleep apnea. Sleep Med 11: 489–493.
63. Hira HS, Shukla A, Kaur A, Kapoor S (2012) Serum uric acid and lactate levels among patients with obstructive sleep apnea syndrome: which is a better marker of hypoxemia? Ann Saudi Med 32: 37–42.
64. Steiropoulos P, Kotsianidis I, Nena E, Tsara V, Gounari E, et al. (2009) Long-term effect of continuous positive airway pressure therapy on inflammation markers of patients with obstructive sleep apnea syndrome. Sleep 32: 537–543. 65. Anker SD, Doehner W, Rauchhaus M, Sharma R, Francis D, et al. (2003) Uric acid and survival in chronic heart failure: validation and application in metabolic, functional, and hemodynamic staging. Circulation 107: 1991–1997. 66. Shimizu Y, Nagaya N, Satoh T, Uematsu M, Kyotani S, et al. (2002) Serum uric acid level increases in proportion to the severity of pulmonary thromboembo-lism. Circ J 66: 571–575.
67. Garcia-Pachon E, Padilla-Navas I, Shum C (2007) Serum uric acid to creatinine ratio in patients with chronic obstructive pulmonary disease. Lung 185: 21–24. 68. Braghiroli A, Sacco C, Erbetta M, Ruga V, Donner CF (1993) Overnight urinary uric acid: creatinine ratio for detection of sleep hypoxemia. Validation study in chronic obstructive pulmonary disease and obstructive sleep apnea before and after treatment with nasal continuous positive airway pressure. Am Rev Respir Dis 148: 173–178.