.
O R I G I N A L P A P E R .
r .
Determination of some Nutritional Habits and Healthy Life- Style
Behaviours of Workers
Gülendam Karadağ, PhD RN
Department of Public Health Nursing, Faculty of Health Sciences, University of Gaziantep, Gaziantep, Turkey.
Hatice Serap Koçak, RN
Department of Public Health Nursing, Faculty of Health Sciences, University of Gaziantep, Gaziantep, Turkey.
Neriman Aydın, PhD, RN
Department of Public Health, Faculty of Medicine, University of Gaziantep, Gaziantep, Turkey.
Serap Parlar Kılıç, PhD, RN
Department of Internal Medicine Nursing, Faculty of Health Sciences, University of Gaziantep, Gaziantep, Turkey.
Seval Kul, PhD, RN
Department of Biostatistics, Faculty of Medicine, University of Gaziantep, Gaziantep, Turkey.
Corespondence: Gülendam Karadağ, Department of Public Health Nursing, Faculty of Health Sciences, University of Gaziantep, 27310 Gaziantep, Turkey. Email: karadag@gantep.edu.tr
Abstract
Objective: The lifestyle indicators that traditionally have been associated with a lesser quality of life a diet rich in fat and low in fruit and vegetables.
Methods: This cross-sectional was conducted determining some nutritional habits and healthy life-style behaviours of workers working at a textile factory in the Southeastern Anatolia Region with 276 workers. A questionnaire form and Healthy Life-Style Behaviours Scale were used for collecting data. Analysis of the data was using percentage, arithmetic average, One Way Anova and Independent Sample t test.
Results: It was determined that 81.2% workers worked for 45 hours a week, 92.4% worked during day hours and 47.5% worked in the department of sewing. It was also found that 84.4% of workers ate three meals a day, 50.0% had vegetable and meat-based diet, 43.8% had family members with chronic diseases, 85.5% did not have their blood pressure measured regularly, 67.4% did not weigh regularly, 29.0% did not do regular sports/physical exercise.
Conclusions: It was determined that total HLSB score of workers was at mid-level in general. It was found that there was a significant relation between nutritional habits, number of meals and physical activity levels of workers and their HLSB scores.
Key Words: Healthy life-style behaviour, Worker, Worker’s nutrition, Nutritional habits, Nutritional status
Introduction
Being healthy in physical and mental terms in all phases of life and to maintain health are possible with adequate and balanced nutrition (Tanır et al., 2001). While millions of people fight against the death and diseases brought by hunger and inadequate nutrition in the world, many people die at an early age due to excessive and wrong
diseases, affects their continuance to work and individual initiative, increases on-the-job accidents, thus affecting job efficiency negatively (Tanır et al., 2001; Sözen et al., 2009; Loeppke et al., 2010).
According to World Health Organization data (WHO), 70-80% of deaths in developed countries and 40-50% of deaths in underdeveloped countries result from diseases that occur in association with life-style (Linn et al., 2009). Infectious diseases that caused mass deaths in the past have left their places to chronic diseases originating from life-style of the individual such as hypertension, obesity, diabetes, coronary health diseases, etc (Cürcani et al., 2010; Çelik et al., 2009; Türkol & Güneş, 2012). These chronic illnesses have been decreased substantially owing to changes made in life-style including increasing physical activity and assuming adequate and balanced nutrition habits (Kolbe-Alexander et al., 2008; Jonsdottir et al., 2011).Therefore, current health approach aims at maintaining, protecting and improving the public health (Beyhan, 2008). Starting from 1970s, improvement of health has been an important matter that has drawn attention of the public health profesionals (Huang et al., 2010). In improvement of the health, what matters is using the potential and energy of the individual efficiently, maintain a satisfactory life, being productive and using health-related abilities to the full extent. Healthy life-style behaviours include taking responsibility of health behaviours, doing adequate and regular exercise, avoiding smoking, taking health responsibility, hygienic measures, establishing positive interpersonal relations and stress management. Individuals turning these behaviours into practice may not only maintain the state of being healthy but also may take their health status to a better level (Türkol & Güneş, 2012; Tambağ & Şimşek, 2012; Yalçınkaya et al. 2007; Ünalan et al., 2007).
Although work health nurses exist for a period of more than 100 years, their exact roles have been defined in the last 30 years and efficiency of their practices has been demonstrated (İşçi & Esin, 2009). However, nurses still execute their tasks which are limited solely to infirmary services in many workplaces and factories. In fact, nurses have important roles and responsibilities for maintaining and improving
health of workers and developing healthy life-style behaviours (İşçi & Esin, 2009).
A limited number of studies are available on nutrition levels and healthy life-style behaviours of workers in our country. While one of these studies examined only nutritional habits (Sözen et al., 2008), another study focused on healthy life-style habits (Beşer et al., 2007). However, there is not any study in our country which investigated both nutrition levels and healthy life-style behaviours of workers. This study was conducted with the aim to determine
sociodemographic characteristics,
anthropometric measures and some nutritional habits and healthy life-style behaviours of workers working at a textile factory in the Southeastern Anatolia Region.
Subjects and Methods
Study design and sample
This cross-sectional study was conducted with 276 workers working at a textile factory and who accepted to participate in the research between the dates of 6 April- 23 May 2009. Population of the study included all workers working at the factory (n=430). Workers who were on leave (7), who refused to participate in the study (90) and questionnaires that were not filled or left incomplete (57) were excluded from the study. Thus, study sample comprised of 276 workers in total who accepted to participate in the research.
Data collection
For the study, literature was reviewed and a questionnaire form related to sociodemographic characteristics, work features and nutritional habits of workers generated by researchers (Sözen et al., 2009; Yalçınkaya et al., 2007; Ünalan et al., 2007; Beşer et al., 2007; Al-Kandari et al., 2008)and the Healthy Life-style Behaviours Scale (Walker et al., 1987; Esin, 1997)were used for data collection. Height and body weight measurements of workers were done and recorded in the questionnaire form.
Procedure
Instruments
Questionnaire for sociodemographic and work characteristics
The questionnaire form generated by researchers after reviewing the literature consisted of two parts with a total of 19 questions related to sociodemographic and working characteristics (8 questions) and nutritional habits (11 questions) of workers. In the first part, sociodemographic data including age, gender, marital status, education level, years of working, department of work, weekly working hours and economic status of workers were obtained. In the second part, nutritional habits (daily number of meals, nutrition style, regular weighing, taking care of diet, doing exercise, presence of obesity and chronic illnesses in the worker and his/her family) were evaluated. For assessment of body-mass index of workers (BMI, kg/ m²); limit values of <18,5 kg/m² lean, 18,5- 24,9 kg/m² normal, 25,0-29,9 kg/m² slightly fat, 30,0- 39,9 kg/m² fat and >40,0 kg/m² excessively fat were adopted. Body weight measurement of workers was performed during the change of shift, with light clothes and shoes off using a scale sensitive to 0.5 kg; and height measurement was made after taking shoes off, using a tape measure while standing against the wall, with the feet side by side.
Healthy Life-style Behaviour Scale (HLSB)
HLSB was developed by Walker, Sechrist and Pender in 1987 (Walker et al., 1987). A study for the validity and reliability of the scale was made by Esin in 1997 (Esin, 1997). in Turkey and Cronbach Alpha value was found as 0.91. Questions in the scale are used to measure an individual's health-promoting behaviours in relation to his/her healthy life-style. Consisting of 48 items, the scale has 6 subgroups. Each subgroup may be used on its own independently. Subgroups include self-realization, health responsibility, exercise, nutrition, interpersonal support and stress management. Self-realization
consists of 13 items with the lowest possible score of 13 and highest score of 52. Health responsibility consists of 10 items, with the lowest possible score of 10 and the highest score of 40. Exercise consists of 5 items, with the lowest possible score of 5 and the highest score of 20. Nutrition consists of 6 items, with the lowest possible score of 6 and the highest score of 24. Interpersonal support consists of 7 items, with the lowest possible score of 7 and the highest score of 28. Stress management
consists of 7 items, with the lowest possible
score of 7 and the highest score of 28. The total score of the scale constitutes HLSB total point. All items of the HLSB are positive. Marking is made on a 4- point Likert scale. 1 point is assigned to the answer “never”, 2 points are assigned to the answer “sometimes”, 3 points are assigned to the answer “frequently” and 4 points are assigned to the answer “regularly”. The lowest score for the whole scale is 48 and the highest score is 192. Higher scores obtained in the scale indicate that the individual applies stated health behaviours at a high level (Walker et al., 1987; Esin, 1997).
Ethical considerations
Oral consent was obtained from the managers of the factory in order to conduct the study.
Statistical analyses
Sociodemographic characteristics of workers and features of their nutritional habits were considered as independent variables and scores obtained at Healthy Life-style Behaviour Scale as dependent variables. Statistical analyses for evaluation of the data were performed using a statistics software package, SPSS 14.0 percentages, arithmetical average, One Way Anova and Independent Sample t test analysis were used for data analysis. P values smaller than 0.05 were considered significant.
Results
Sociodemographic and work characteristics
Average age of the workers participating in the study is 27.0±5.29 years (Min: 17-Max: 50). It was found that 69.9% of workers were male, 64.1% were married, 62.0% were primary school graduates and 60.1% stated that their financial status was at middle level. It was also determined that 47.1% of workers had been working for 1-3 years, 81.2% worked for 45 hours a week, 92.4% worked during daytime and 47.5% worked in the department of sewing (Table 1).
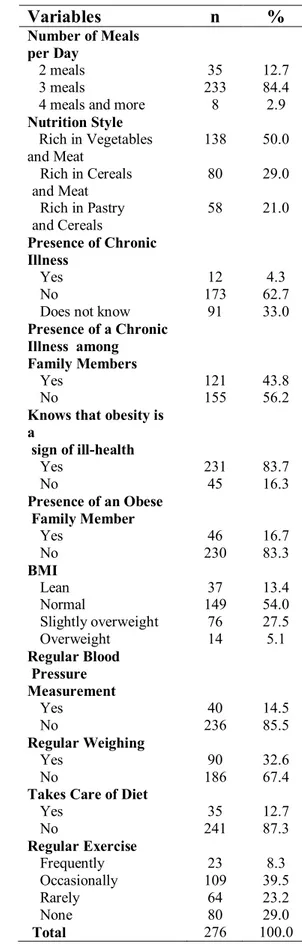
Workers’ diatery habits and BMI
regularly, 87.3% did not take care of their diets and 29.0% did not do regular sports/physical exercise. Body-mass index of workers (BMI) was 23.7±3.47 (Min: 15.4; Max: 35.7) and 54.0% had BMIs within normal BMI range (Table 2).
Table 1.
Sociodemographic and Working
Characteristics of Workers
Variables n %
Gender
Female 83 30.1
Male 193 69.9
Level of Education
Literate 18 6.5
Primary education
(age 7 to 12) 171 62.0 High school /university 87 31.5 Marital status
Married 177 64.1
Unmarried 99 35.8
Economic status
Good 20 7.2
Medium 166 60.1
Poor 90 32.6
Years of working
1-3 years 130 47.1
4-6 years 76 27.5
7-9 years 35 12.7
10 years and ↑ 35 12.7 Working section
Sewing 131 47.5
Manufacturing Line 75 27.2 Ready made garments 32 11.6
Textile 38 13.7
Weekly working hours
45 hours 224 81.2
50 hours and ↑ 52 18.8 Working Style
Daytime 255 92.4
Night 15 5.4
Shift 6 2.2
Total 276 100.0
Healthy Life-style Behaviour Scale by certain characteristics of workers
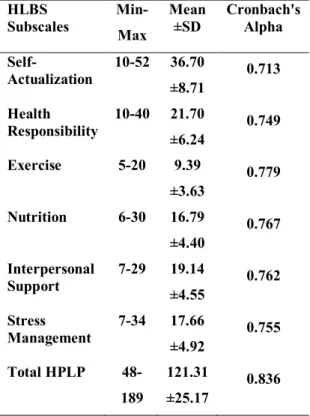
HLSB scores and average subgroup scores of workers are shown in Table 3. Average scores for subgroups were 36.70±8.71 for the self-realization subgroup, 21.70±6.24 for the health responsibility subgroup, 9.39±3.63 for the exercise subgroup, 16.79±4.40 for the nutrition subgroup, 19.14±4.55 for interpersonal support subgroup, 17.66±4.92 for the stress management subgroup and total average score was 121.31±25.17.
Table 2.
Nutritional Habits and
Certain Features of Workers
Variables
n
%
Number of Meals per Day
2 meals 35 12.7
3 meals 233 84.4
4 meals and more 8 2.9
Nutrition Style
Rich in Vegetables
and Meat 138 50.0
Rich in Cereals
and Meat 80 29.0
Rich in Pastry
and Cereals 58 21.0
Presence of Chronic Illness
Yes 12 4.3
No 173 62.7
Does not know 91 33.0
Presence of a Chronic Illness among Family Members
Yes 121 43.8
No 155 56.2
Knows that obesity is a
sign of ill-health
Yes 231 83.7
No 45 16.3
Presence of an Obese Family Member
Yes 46 16.7
No 230 83.3
BMI
Lean 37 13.4
Normal 149 54.0
Slightly overweight 76 27.5
Overweight 14 5.1
Regular Blood Pressure Measurement
Yes 40 14.5
No 236 85.5
Regular Weighing
Yes 90 32.6
No 186 67.4
Takes Care of Diet
Yes 35 12.7
No 241 87.3
Regular Exercise
Frequently 23 8.3
Occasionally 109 39.5
Rarely 64 23.2
None 80 29.0
It was found that total score HLSB of workers was at middle level in general. Cronbach's Alpha coefficient of internal consistency for HLSB sub-scales of workers ranged between 0,71 and 0,75 and sum of HLSB coefficients was found as 0,86. It was observed that there was a statistically significant difference between total average score of health responsibility subgroup of healthy life-style behaviours scale and education level of workers and between total average score of exercise subgroup and economic status (p<0.05). (Table 3).
Table 3. Breakdown of Workers by Average Score of Healthy Life-Style Behaviour Scale
HLBS
Subscales Min- Max Mean ±SD Cronbach's Alpha
Self-
Actualization 10-52 36.70 ±8.71 0.713
Health
Responsibility 10-40 21.70 ±6.24 0.749
Exercise 5-20 9.39
±3.63 0.779 Nutrition 6-30 16.79
±4.40 0.767 Interpersonal
Support 7-29 ±4.55 19.14 0.762
Stress
Management 7-34 ±4.92 17.66 0.755
Total HPLP 48-189
121.31
±25.17 0.836
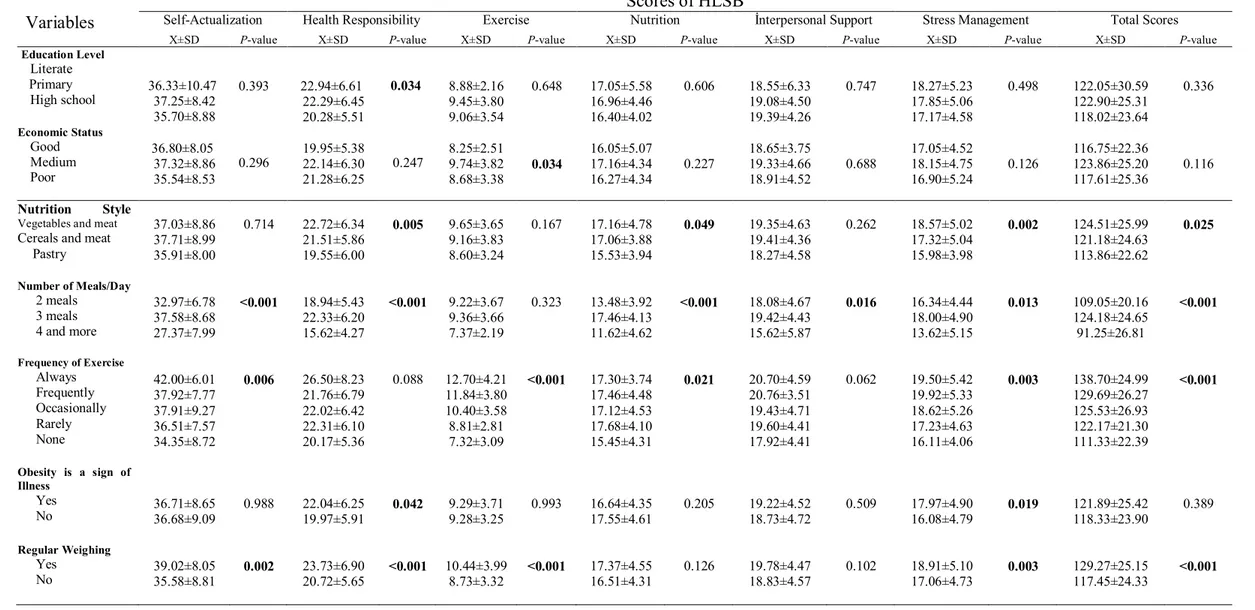
When HLSB total score and average subgroup scores were considered in relation to nutrition style of workers; it was identified that while average scores of self-realization and interpersonal support subgroups were highest among workers consuming cereals and meat products, health responsibility, average and total scores for exercise, nutrition, stress management subgroups were highest among workers consuming vegetables and meat products. A statistical difference was found between health responsibility, nutrition, stress management and total average score in relation to nutrition style (p<0.05) (Table 4).
It was observed that average and total scores for all HLSB subgroups were highest among workers who had three meals a day and there was a statistical difference between average and total scores for all other subgroups excluding exercise subgroup (p<0.05). When difference between HLSB total score and average subgroup scores was examined in relation to the variable of exercise frequency of workers; it was found that self-realization, health responsibility, exercise subgroup scores and total average scores of workers doing regular exercise were the highest, whereas average scores for nutrition subgroup were the highest for workers consuming food rarely and average scores for interpersonal support and stress management subgroups were the highest among workers who nourished frequently. Also, there was a statistical difference between average and total scores of all the other subgroups excluding health responsibility and interpersonal support subgroups in relation to the exercise frequency of worker (p<0.05) (Table 4).
It was determined that average and total scores for all HLSB subgroups were higher among workers who stated that fatness is a sign of illness, except average score of nutrition subgroup and there was a statistical difference only between average scores for health responsibility and stress management subgroups in relation to this variable (p<0.05). HLSB subgroup and total point averages of workers who weighed regularly were higher compared to workers who did not weigh regularly and there was a statistical difference between all subgroup and total point averages and nutrition excluding average score for interpersonal support subgroup in relation to this variable (p<0.05) (Table 4). As result of the research, it was determined that there was not a significant difference between gender, education level, economic status, regular blood pressure measurement, BMI, having a chronic illness and HLSB subgroup and total point averages among workers (p>0,05).
Discussion
wrong nutrition practices and lack of physical activity (Rao et al., 2012, Segar et al., 2012; Van Domelen et al. 2011). As an important public health problem, obesity has been increasingly seen all over the world and in our country in recent years. Obesity predisposes the individuals to several many chronic diseases including arthritis, hypertension, hypercholesterolemia, some cancer types and diabetes (Escoffery et al., 2011). In our study, it was determined that BMI values of the majority of workers were within normal limits and they did not have obese individuals in their families. Additionally, the fact that the majority of workers stated obesity as a sign of ill-health in our study signifies that individuals in the community are aware of obesity. In addition, scores for HLSB sub-scales of health responsibilit and stress management were significantly higher among workers who were aware of the fact that obesity is an indicator of illness compared to workers who lacked such awareness (p<0.05). However, several sources have reported that as in the case of the workers in our study who did not weigh and exercise regularly, did not take care of their diets and consumed a pastry and cereal-based diet, these unhealthy life-style practices pose a risk for developing obesity and certain chronic illness in the future Nigg et al., 2010; Previdelli et al., 2010).
In our study, it was determined that majority of workers did not have any chronic diseases and a substantial percentage of workers (33.3%) did not know whether they had a chronic condition or not. Also, about half of the workers actually had a chronic disease in their families. Although having a family member with a chronic disease constitutes a risk factor for the workers themselves, the majority of workers do not have their blood pressures checked and do not exercise regularly, which leads us to think that they did not attach adequate importance to their health.
It was shown that physical activity increases the quality of life for all individuals in the community (Rao et. al., 2012; Segar et al., 2012; Van Domelen et al., 2011). Therefore, promoting an active life-style constitutes an important component of national and international public health guidelines. Considering benefits of physical activity, it is necessary to encourage people for adopting the most appropriate level of physical activity for healthier individuals and healthier societies
For individuals to have an adequate and balanced diet, it is necessary to consume 3 main meals regularly (Sözen et al., 2009; Ulaş & Genç, 2010; Aksoydan & Çakır, 2011). In the present study, it was found that HLSB total average scores were highest among workers who had three meals a day. This shows that workers take care of their meals for a healthy life. Additionally, this finding makes us think that this may be associated with the fact that meals at the factory are served regularly three times a day. Similarly, nurses who were nourished regularly were found to have significantly high HLSB scores in the study of Özkan and Yılmaz (Özkan & Yılmaz, 2008), and a significant difference was found between the nutrition style and HLSB in the study by Beşer et al (Beşer et al., 2007).
As a result of the research, it was determined that healthy life-style behaviours of workers were at mid-level and they obtained the lowest score of HLSB from the exercise subgroup and the highest score from the self-realization subgroup. In addition, it was observed that workers who had a diet rich in vegetables and meat, consumed three meals a day, weighed regularly and exercised at all times had high HLSB scores. A significant difference was not found between duration and type of work, BMI, frequency of eating outside, regular weighing and habit of having their blood pressure checked regularly and HLSB. Based on these results, planning of educational activities may be recommended, directed at contributing to improvement of healthy life-style behaviours of workers both in their workplace and social environments and increasing awareness on this issue. In addition, social and political targets should be set in order to turn healthy nutrition into life-style by increasing nutritional consciousness to ensure workers achieve at a desired quality of life, and programmes to promote behaviour change should be developed. Particularly, it is important to employ workplace nurses who have an important role in promoting healthy nutrition of workers and development of healthy life-style in factories all over the country.
Acknowledgement
We thanks all the workers and the administrators that participated in the study.
References
Aksoydan, E. & Çakır, N. (2011). Evaluation of nutritional behavior, physical activity level and body mass index of adolescents. Gülhane Medical Journal 53, 264-270.
Al-Kandari, F., Vidal, V.L. & Thomas, D. (2008). Health-promoting lifestyle and body mass index among College of Nursing students in Kuwait: a correlational study. Nurs. Health Sci. 10, 43-50. Allman-Farinelli, M.A., Chey, T., Merom, D. &
Bauman, A.E. (2010). Occupational risk of overweight and obesity: an analysis of the Australian Health Survey. J. Occup. Med. Toxicol. 5, 14
Al Ma'aitah, R., Haddad, L. & Umlauf, M.G. (1999). Health promotion behaviors of Jordanian women. Health Care Women International 20, 533-46. Bandoni, D.H., Sarno, F. & Jaime, P.C. (2011).
Impact of an intervention on the availability and consumption of fruits and vegetables in the workplace. Public Health Nutr. 14, 975-81. Bansal, D., Satija, A., Khandpur, N., Kinra, S.,
Prabhakaran, D., Reddy, K.S., Ebrahim, S. (2010). Effects of migration on food consumption patterns in a sample of Indian factory workers and their families. Public Health Nutr. 13, 1982-9. Beşer, A., Bahar, Z. & Büyükkaya, D. (2007). Health
promoting behaviors and factors related to lifestyle among Turkish workers and occupational health nurses' responsibilities in their health promoting activities. Ind. Health 45, 151-9.
Beyhan, Y. (2008). Occupational
Health-Occupational Safety and Nutrition. Klasmat Printing Office, Ankara.
Bioxados, M., Hernandez, E., Guillamon, N. & Pousada, M. (2010). Working women’s lifestyles and quality of life in the information society. Health Care for Women International 31, 552– 567.
Chen, Y.C., Wu, H.P., Hwang, S.J. & Li, I.C. (2010). Exploring the components of metabolic syndrome with respect to gender difference and its relationship to health-promoting lifestyle behaviour: a study in Taiwanese urban communities. J. Clin. Nurs. 19, 3031-41.
Cürcani, M., Tan, M. & Özdelikara, A. (2010). Healthy life style behaviours of the nurses and the determination of affecting factors. TAF Prev. Med. Bull. 9, 487-492.
Çelik, G.O., Malak, A.T., Bektaş, M., YılmazD., Yümer, A.S., Öztürk, Z., Demir, E. (2009). Examination of factors affecting health school student’s health promotion behavior. Anatol. J. Clin. Investig. 3, 164-169.
Esin, N. (1997). Healthy lifestyle behaviors scale of adopted Turkish. Nursing Bulletin 12, 87-95. Huang, S.L., Li, R.H. & Tang, F.C. (2010).
Comparing disparities in the health-promoting lifestyles of Taiwanese workers in various occupations. Ind. Health 48, 256-64.
İşçi, F. & Esin, N.M. (2009). Evaluation of occupational health nursing interventions using Omaha Scheme in a company. Journal of Dokuz Eylül University Nursing School 2, 39-55. Jonsdottir, I.H., Börjesson, M. & Ahlborg, J.G.
(2011). Healthcare workers’ participation in a ealthy life style-promotion project in Western Sweden. BMC Public Health 11, 448.
Kolbe-Alexander, T.L., Buckmaster, C., Nossel, C., et al. (2008). Chronic disease risk factors, healthy days and medical claims in South African employees presenting for health risk screening. BMC Public Health 8, 228.
Linn, Y.H., Tsai, E.M., Chan, T.F., Chou, F.H., Lin,
Y.L. (2009). Health promoting lifestyles and
related factors in pregnant women. Chang Gung Med. J. 32, 650-61.
Loeppke, R., Edington, D.W. & Bég, S. (2010). Impact of the prevention plan on employee health risk reduction. Popul. Health Manag. 13, 275-84. Nigg, C.R., Albright, C., Williams, R., Nichols, C.,
Renda, G., Stevens, V.J., Vogt, T.M. (2010). Are physical activity and nutrition indicators of the checklist of health promotion environments at worksites (CHEW) associated with employee obesity among hotel workers? J. Occup. Environ. Med. 52, 4-7.
Özkan, S. & Yılmaz, E. (2008) The health-promoting lifestyles of nurses working at hospital. Fırat Journal of Health Services 3, 90-105.
Previdelli, A.N., Lipi, M., Castro, M.A. & Marchioni, D.M. (2010). Dietary quality and associated factors among factory workers in the metropolitan region of São Paulo, Brazil. J. Am. Diet. Assoc. 110, 786-90.
Rao, C.R., Darshan, B., Das, N., Rajan, V., Bhogun, M., Gupta, A. (2012). Practice of physical activity among future doctors: A Cross Sectional Analysis. Int. J. Prev. Med. 3, 365-9.
Segar, M.L., Updegraff, J.A., Zikmund-Fisher, B.J. &
Richardson, C.R. (2012). Physical activity
advertisements that feature daily well-being improve autonomy and body image in overweight women but not men. J. Obes. 2012, 354721.
Sözen, S. Bilir, N., Yıldız, A.N., Yıldız , E. & Sözen, T. (2009). Nutrition habits and related anthropometric measurements of employees working at an institution of metal industry. Public Medicine Bulletin 28, 7-14
Tambağ, H. & Şimşek, Z. (2012). Effects of public health nursing course on the students’ healthy lifestyle behaviors. Journal of Nursing Research and Development 14, 46-55.
Tanır, F., Şaşmaz, T., Beyhan, Y. & Bilici, S. (2001). Nutrition status employees a textile factory in the town of Doğankent. Turkish Journal of Occupational Health and Safety 7, 22-25
Türkol, E. & Güneş, G. (2012). Healthy life style behaviors of resident assistant working at Inonu University Medical Faculty Hospital. Journal of Inonu University Medical Faculty 19, 159-66. Ulaş, B. & Genç, M.F. (2010). The attitude and
behaviours of the personnel on duty at Malatya Military Hospital in 2007 on healthy dieting. Journal of İnönü Üniversity Medical 17, 187-193. Ünalan, D., Şenol, V., Öztürk, A. & Erkorkmaz, Ü.
(2007). A research on the relation between the healthy life style behaviors and self-care levels of the students in health and social programs of vocational collages. Journal of Inonu University Medical Faculty, 14, 101-109.
Van Domelen, D.R., Koster, A., Caserotti, P., Brychta, R.J., Chen, K.Y., McClain, J.J., Troiano, R.P., Berrigan, D., Harris, T.B. (2011). Employment and physical activity in the U.S. Am. J. Prev. Med. 41, 136-45.
Vinholes, D.B., Melo, I.M., Machado, C.A., de Castro, Chaves, H.Jr., Fuchs, F.D., Fuchs,S.C. (2012). The Association between socioeconomic characteristics and consumption of food Items among Brazilian industry workers. Scientific World Journal 2012, 808245.
Walker, S.N., Sechrist, K.R. & Pender, N.J. (1987).
The healthpromoting lifestyle profile:
Development and psychometric characteristics. Nursing Research 36(2): 76-81.
Yalçınkaya, M., Özer, F.G. & Karamanoğlu, A.Y. (2007). Evaluation of healthy lifestyle behaviors in health care workers TAF Prev. Med. Bull. 6, 409-420.
Table 4.
Comparison of Average Scores of Healthy Life-Style Behaviours Scale Scores by Certain Characteristics of Workers
Scores of HLSB
Variables
Self-Actualization Health Responsibility Exercise Nutrition İnterpersonal Support Stress Management Total ScoresX±SD P-value X±SD P-value X±SD P-value X±SD P-value X±SD P-value X±SD P-value X±SD P-value
Education Level Literate Primary
High school 36.33±10.47 37.25±8.42
35.70±8.88
0.393 22.94±6.61
22.29±6.45 20.28±5.51
0.034 8.88±2.16 9.45±3.80 9.06±3.54
0.648 17.05±5.58
16.96±4.46 16.40±4.02
0.606 18.55±6.33
19.08±4.50 19.39±4.26
0.747 18.27±5.23
17.85±5.06 17.17±4.58
0.498 122.05±30.59
122.90±25.31 118.02±23.64
0.336
Economic Status Good Medium Poor
36.80±8.05 37.32±8.86
35.54±8.53 0.296
19.95±5.38 22.14±6.30
21.28±6.25 0.247
8.25±2.51 9.74±3.82
8.68±3.38 0.034
16.05±5.07 17.16±4.34
16.27±4.34 0.227
18.65±3.75 19.33±4.66
18.91±4.52 0.688
17.05±4.52 18.15±4.75
16.90±5.24 0.126
116.75±22.36 123.86±25.20
117.61±25.36 0.116
Nutrition Style Vegetables and meat
Cereals and meat Pastry
37.03±8.86 37.71±8.99 35.91±8.00
0.714 22.72±6.34
21.51±5.86 19.55±6.00
0.005 9.65±3.65 9.16±3.83 8.60±3.24
0.167 17.16±4.78
17.06±3.88 15.53±3.94
0.049 19.35±4.63 19.41±4.36 18.27±4.58
0.262 18.57±5.02
17.32±5.04 15.98±3.98
0.002 124.51±25.99 121.18±24.63 113.86±22.62
0.025
Number of Meals/Day 2 meals
3 meals 4 and more
32.97±6.78 37.58±8.68 27.37±7.99
<0.001 18.94±5.43 22.33±6.20 15.62±4.27
<0.001 9.22±3.67 9.36±3.66 7.37±2.19
0.323 13.48±3.92
17.46±4.13 11.62±4.62
<0.001 18.08±4.67 19.42±4.43 15.62±5.87
0.016 16.34±4.44 18.00±4.90 13.62±5.15
0.013 109.05±20.16 124.18±24.65 91.25±26.81
<0.001
Frequency of Exercise Always Frequently Occasionally Rarely None
42.00±6.01 37.92±7.77 37.91±9.27 36.51±7.57 34.35±8.72
0.006 26.50±8.23 21.76±6.79 22.02±6.42 22.31±6.10 20.17±5.36
0.088 12.70±4.21
11.84±3.80 10.40±3.58 8.81±2.81 7.32±3.09
<0.001 17.30±3.74 17.46±4.48 17.12±4.53 17.68±4.10 15.45±4.31
0.021 20.70±4.59 20.76±3.51 19.43±4.71 19.60±4.41 17.92±4.41
0.062 19.50±5.42
19.92±5.33 18.62±5.26 17.23±4.63 16.11±4.06
0.003 138.70±24.99 129.69±26.27 125.53±26.93 122.17±21.30 111.33±22.39
<0.001
Obesity is a sign of Illness
Yes
No 36.71±8.65 36.68±9.09 0.988 22.04±6.25 19.97±5.91 0.042 9.29±3.71 9.28±3.25 0.993 17.55±4.61 16.64±4.35 0.205 19.22±4.52 18.73±4.72 0.509 17.97±4.90 16.08±4.79 0.019 121.89±25.42 118.33±23.90 0.389
Regular Weighing Yes