Lists of monosyllables for speech audiometry testing:
construct validity
Listas de monossílabos para teste logoaudiométrico: validação de
construto
Ana Valéria de Almeida Vaucher1, Isabela Hoffmeister Menegotto2, Anaelena Bragança de Moraes1, Maristela
Julio Costa1
ABSTRACT
Introduction: Speech stimuli are used as part of basic audiological
assessment for speech recognition analysis, and validated materials are required for this purpose. Purpose: To perform construct validation
of new lists of monosyllables for speech audiometry assessment.
Methods: The speech recognition percentage index was determined
with two materials: two new lists of monosyllables, which were validated for content and considered to be equivalent, and the list of Pen and Mangabeira-Albernaz (1973), considered as the gold standard in the clinical routine of speech audiometry assessment in Brazil. The former were presented as recorded material and the latter, via monitored live voice, by the same speaker. Individuals living in the same city where the research was conducted and who had moderate to moderately severe hearing loss in at least one ear were selected from a database. Twenty right-handed subjects - aged between 18 and 44, with mixed or conductive and sensorineural hearing loss - participated in this research. The scores resulting from the application of these lists were correlated. Data were analyzed by ear; there was a total of 18 right ears and 18 left ears. Results: There was no statistically significant difference between the right and left ears. There was a strong correlation between the new lists previously developed for this research and the list of Pen and Mangabeira-Albernaz in different hearing loss groups. When comparing the pairs of resulting scores, there was also a strong linear correlation between the new lists and the list of Pen and Mangabeira-Albernaz. Conclusion: The new monosyllable lists were validated for the construct.
Keywords: Hearing; Hearing loss; Speech perception; Audiometry,
Speech; Psychometrics
RESUMO
Introdução: Estímulos de fala são usados como parte da avaliação
audiológica básica, para análise do reconhecimento de fala, e materiais validados são necessários para este fim. Objetivo: Realizar validação
de construto de novas listas de monossílabos, para uso na avaliação logoaudiométrica. Métodos: Pesquisou-se o Índice Percentual de
Reconhecimento de Fala, com dois materiais: duas novas listas de monossílabos, validadas quanto ao conteúdo e consideradas equivalentes e a lista de Pen e Mangabeira-Albernaz (1973), considerada padrão-ouro na rotina clínica da avaliação logoaudiométrica, no Brasil. As novas listas foram apresentadas na forma gravada e a segunda, à viva voz, pelo mesmo locutor. Foram selecionados, por meio de um banco de dados, indivíduos residentes no município onde a pesquisa foi realizada e que possuíam perda auditiva de grau moderado a moderadamente severo em, pelo menos, uma das orelhas. Participaram 20 sujeitos destros, com idades entre 18 e 44 anos, com perda auditiva do tipo neurossensorial, mista ou condutiva. Foram correlacionados os escores obtidos, resultantes da aplicação das listas. Os dados foram analisados por orelha, sendo então, 18 orelhas direitas e 18 orelhas esquerdas.
Resultados: Não houve diferença significativa entre as orelhas direita e
esquerda. Observou-se forte correlação entre as novas listas previamente desenvolvidas para esta pesquisa e a lista de Pen e Mangabeira-Albernaz, nos diferentes grupos de perda auditiva. Ao comparar os pares de escores obtidos, também houve forte correlação linear entre as novas listas e a lista de Pen e Mangabeira-Albernaz. Conclusão: As novas listas de monossílabos foram validadas, em relação ao construto.
Palavras-chave: Audição; Perda auditiva; Percepção da fala;
Audiometria da fala; Psicometria
Research conducted in the Graduate Program in Human Communication Disorders, Universidade Federal de Santa Maria – UFSM – Santa Maria (RS), Brazil. (1) Universidade Federal de Santa Maria – UFSM – Santa Maria (RS), Brazil.
(2) Universidade Federal de Ciências da Saúde de Porto Alegre – UFCSPA – Porto Alegre (RS), Brazil.
Conflict of interests: No
Authors’ contribution: AVAV participated in the conception and design of the study, collection, analysis and interpretation of data; HMI revised the manuscript; ABM made the statistical analysis and helped to interpret the data; MJC revised the manuscript and approved the final draft to be published.
Corresponding author: Ana Valéria de Almeida Vaucher. E-mail: [email protected]
INTRODUCTION
Speech stimuli are used in audiologic assessment, speech audiometry testing, or vocal audiometry, through detection and recognition of speech, thus helping to confirm tonal thresholds measured in audiometry(1,2).
A listener’s ability to recognize speech stimuli is assessed by means of the Speech Recognition Percentage Index (SRPI), using monosyllabic words(3,4) at an intensity level that allows the
best possible performance. It may range between 20 dB and 60 dB sensation level (SL), but stimuli are usually presented at 40 dB SL(5,6), or at the listener’s most comfortable listening level(7,8).
Each language should have its own speech materials, consisting of carefully selected words, taking into account the previously established criteria(4), and its psychometric
characteristics should be defined(2,9). In Brazil, there is no
recorded material available so far for speech audiometry that is composed of monosyllabic words and accompanied by psychometric studies. Thus, this gap needs to be filled by creating new lists of monosyllables for the Portuguese language, thus initiating the process of validation of such lists(10).
For explanatory purposes, classic aspects of the validation process were selected, namely: content validity, criterion validity and construct validity(11,12). Content validity refers to
the initial stage of the process and is related to the preparation and development of the instrument. Criterion validity is an aspect relative to the effectiveness of the test in predicting the performance of a group of individuals, as regards a specific criterion. Construct validity checks whether a test is an adequate representation of the theoretical construct or trait. Thus, all these aspects are used in the psychometric measures of instruments(11,12,13).
In the present study, the construct validity stage was focused on for the lists created to be applied in speech audiometry to measure the SRPI. The form of construct validation in use was hypothesis testing(11), which is based on the correlation of the
proposed instrument with other tests that measure the same trait. Thus, this study was aimed at construct validity for the lists of monosyllables, correlating the scores achieved in the implementation of the new lists of monosyllabic words with those of the lists of Pen and Mangabeira-Albernaz (1973)(14)
and, therefore, gather evidence of construct validity of the new instrument proposed for speech audiometry assessment.
METHODS
The present study was part of a research project approved by the Research Ethics Committee of the Universidade Federal de Santa Maria, under protocol number 13932513.1.0000.5346.
It follows the Human Research Guidelines and Regulatory Standards (Resolution 466/2012, of the National Health Council). The study population was composed of subjects with hearing loss, cared for at a hearing health center at the Federal
University of Santa Maria, recruited by means of an existing database in this clinic.
The inclusion criteria were: right-handed adult subjects, with moderate to moderately severe hearing loss(15) in at
least one of their ears; actual or potential hearing aid users; residents in the municipality where the research was conducted; agreement to participate in the research by signing an informed consent form. It should be emphasized that the choice of right-handed subjects, in principle, did not influence the performance of the assessed subjects, as they were all right-handed and the requested task involved monotic hearing(16).
The exclusion criteria were: age below 19 years or above 44 years; mild, severe, or deep hearing loss in both ears; other impairments that could affect understanding and/or oral language, e.g., language disorders or speech disorders.
This research used convenience sampling. For the purposes of collection and analysis of data, each ear was considered as a subject and was grouped according to type and degree of hearing loss, namely: Group 1: moderate sensorineural hearing loss; Group 2: moderately severe sensorineural hearing loss; Group 3: moderately severe mixed hearing loss; Group 4: moderate mixed hearing loss; Group 5: moderate conductive hearing loss.
Brief interviews were conducted with the patients in order to collect personal data and information about their audiological history, as well as to provide information about the research and have them sign the Informed Consent Form. Subsequently, visual inspection of the external acoustic meatus was performed using a Heine Mini 3000 otoscope; audibility thresholds were measured at the frequencies of 250 Hz to 8000 Hz, using a properly calibrated Interacoustics AC 33 audiometer with TDH-39 earphones.
As a result, the Speech Recognition Percentage Index (SRPI) was determined at the most comfortable listening level(9,10) by applying two different instruments; one of them was
the new lists of monosyllabic words, which had been validated for content and were considered as equivalent(10), because they
posed the same level of difficulty when applied to subjects with normal hearing in a controlled hearing situation. The lists were called L1 and L2. The other instrument was composed of lists D1 and D2 of Pen and Mangabeira-Albernaz (1973)(14), used
as a reference in the clinical routine of speech audiometry assessment(1,14). To perform speech audiometry assessment with
the new lists, a Toshiba CD player was fitted to the audiometer. Both tonal audiometry and speech audiometry assessment were performed in a soundproof booth.
in the audiometer, the speech signal present in the recording of the lists of Pen and Mangabeira-Albernaz was not around 0VU, as expected.
At the time of application, the lists were intentionally presented in different orders, starting by the best ear in individuals who had both ears evaluated.
The data were analyzed statistically, and construct validity was checked in the correlation with another instrument(11), considered
as the gold standard, used in speech recognition assessment. The software Statistica9.1 was used with a confidence interval of 95% (p≤0.05). Statistically significant values were marked
with (*). Normality of data was evaluated with the Shapiro-Wilk test. Correlation between the two instruments was analyzed with Spearman’s rank correlation coefficient.
RESULTS
Initially, according to the inclusion criteria of the sample, 71 eligible subjects were selected to participate in the study. When the researchers attempted to contact the subjects, 42 of them (59.15%) could not be reached by telephone; 29 (40.85%) scheduled the assessment, but only 20 (28.16%) came to the clinic. Sixteen of them were evaluated in both ears and the other 4 were evaluated in only one of the ears, in a total of 36 ears. With respect to mean scores and standard deviations found in the new lists of monosyllables (L1/L2) and the lists of Pen and Mangabeira-Albernaz (D1/D2), the statistical analysis showed that there was no difference between the means when comparing groups with different levels of hearing loss (Table 1).
As for correlation between the mean scores achieved by subjects in the new lists of monosyllables and the lists of Pen and Mangabeira-Albernaz, it was found that there was a strong correlation between the mean scores in the application of the lists L1/L2 and D1/D2, for the different hearing loss groups, with a statistical significance - p-value0.05 - in all groups (Table 2).
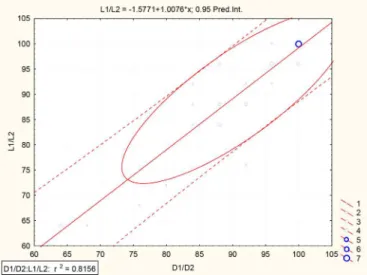
Figure 1 shows the result of Spearman’s correlation test, applied to check the correlation between the performance of subjects with hearing loss in the different instruments evaluated - L1/L2 and D1/D2.
The circles beside the figure indicate the amount of subjects who presented the scores for L1/L2 and D1/D2. In this way, the speech recognition scores of 7 subjects were
Table 1. Subjects’ scores achieved in the new lists of monosyllabic words, presented as recorded material and in the lists of Pen and Mangabeira-Albernaz, presented via monitored live voice to the different hearing loss groups
Group n L1/L2 D1/D2
Mean Standard deviation p-value Mean Standard deviation p-value
1 12 89.33 9.547 0.327 88.66 7.969 0.373
2 9 88.44 11.215 90.22 11.155
3 7 88.00 15.663 88.57 13.938
4 4 84.00 9.797 89.00 8.246
5 4 100.00 0.00 100.00 0.00
Total 36 89.44 11.157 90.33 10.000
Analysis of Variance – ANOVA (p≤0.05)
Subtitle: Group 1 = moderate sensorineural hearing loss; Group 2 = moderately severe sensorineural hearing loss; Group 3 = moderately severe mixed hearing loss; Group 4 = moderate mixed hearing loss; Group 5 = moderate conductive hearing loss; L1/L2 = new lists of equivalent monosyllables; D1/D2 = lists of Pen and Mangabeira-Albernaz read out loud
Table 2. Results of correlation between mean scores in the different instruments evaluated - new lists of monosyllables and lists of Pen and Mangabeira-Albernaz
Group Correlation coefficient
1 r=0.905**
2 r=0.822*
3 r=0.953**
4 r=0.990*
5 There was no variability between the two tests.
Pearson’s correlation test - ** (p≤0.001), * (p≤0.05)
Subtitle: Group 1 = moderate sensorineural hearing loss; Group 2 = moderately severe sensorineural hearing loss; Group 3 = moderately severe mixed hearing loss; Group 4 = moderate mixed hearing loss; Group 5 = moderate conductive hearing loss
**Significant difference (p≤0.001), strong correlation >0.08** Spearman’s Correlation Coefficient ρ=0.8538**, p=0.0000**
Subtitle: L1/L2 = new lists of equivalent monosyllables; D1/D2 = lists of Pen and Mangabeira-Albernaz; φ = number of subjects in each performance combination
100% in both speech materials used in the assessment; 6 subjects had approximately 96% of speech recognition with the two materials and so on. The results shown in Figure 1 are reinforced by the results shown in Table 2. The pairs of data arising out of the scores achieved in these lists are linearly distributed, indicating a strong positive linear correlation between the scores achieved in both tests. In other words, when the scores of L1/L2 increased, the scores of D1/D2 also increased. The p-value of 0.000 indicated that this correlation is statistically significant, while the value of Spearman’s rho (ρ) is 0.8538.
DISCUSSION
The results in Table 1 show that there is no difference between the mean scores for the different hearing loss groups, when both the new lists of monosyllables and the lists D1/D2 were implemented. This fact is believed to be related to an association between the variables age, characteristics of hearing loss and level of stimulus presentation. The subjects that were part of the groups were aged between 19 and 44 years, with moderate and moderately severe hearing loss. Therefore, they were adults with an average age of 30.5 years and decreased audibility thresholds; however, they had not yet begun to feel the effects of aging(17), and their performance was in accordance
with the literature.
There are studies that show the influence of aging of the auditory system on speech recognition, even when peripheral hearing is normal(18); speech recognition is worse when
associated with hearing loss alone or together with the decline of cognitive functions(19,20,21). As shown by the characteristics
of recognition of monosyllabic words by individuals aged 80 years or older, there is a correlation between speech recognition and auditory thresholds, with a tendency toward worsening as individuals grow older(22), that is, there is a gradual decrease
of speech recognition as age increases(23).
As for the characteristics of hearing loss, the literature indicates that speech recognition may be impaired in most cases of sensorineural hearing loss(7,21,24), and it becomes worse
as hearing loss increases or when it is associated with aging(24).
The average performance scores in the results of this study were above the average results found in other studies(7,24), probably
because the subjects in this study were younger. For individuals with conductive hearing loss, the results were similar to those of another study(5), without interference of type and degree of
hearing loss on speech recognition, because individuals with this type of loss can recognize speech satisfactorily, as the stimuli are presented at a more intense level.
The fact that lists L1/L2 were presented as recorded material while D1/D2 were presented via monitored live voice does not prevent a strong correlation between them (Table 2), quite possibly because the speaker was the same in both tests. In the presentation of lists D1 and D2, the speaker articulated the
words clearly, seeking to produce them as similarly as possible to the standard used for recording lists L1 and L2 and attempting to maintain a constant level of intensity by visually controlling the VU meter of the audiometer, i.e., trying to minimize, as much as possible, the influence that a speaker may have at the time of presentation of a test.
However, when speech audiometry assessment is performed on a daily basis by different evaluators, consistency is very difficult to maintain when presenting the material, especially in the case of assessments performed via monitored live voice. The literature confirms that there may be large differences in speech recognition measurements determined by different speakers, albeit with the same test material, whether applied via monitored live voice(25) or recorded(2,26).
Thus, authors prefer to use recorded tests(2,24,27,28,29)
because they argue that recorded tests decrease variability of an examiner’s speech and ensure the same conditions of presentation of the material to all subjects, thus standardizing the assessment.
The purpose of this study was to seek evidence of validity for a new speech material, reinforcing the need for standardization in speech audiometry assessment and, thus, allowing the control of variables inherent in the presentation of words via monitored live voice, as referenced in the literature and observed in clinical practice.
It should be emphasized that the results are valid specifically for the study sample; the lists have to be applied to a larger sample with different levels and types of hearing loss as well as cover other age groups in order to establish standardization parameters. The lists of words used in this study are in the process of validation and, in this work, only one of the steps in this process was described.
CONCLUSION
When analyzing the results achieved by individuals with hearing loss using an instrument widely used in clinical routine and a new instrument being proposed, the strong correlation between them allowed considering the construct of the new instrument as valid. Moreover, the application of the new instrument should continue in different studies in order to establish other measures of validation.
REFERENCES
1. Menegotto IH, Costa MJ. Avaliação da percepção de fala na avaliação audiológica convencional. In: Boéchat EM, Menezes PL, Couto CM, Frizzo ACF, Scharlach RC, Anastasio ART, organizadores. Tratado de audiologia.Rio de Janeiro: Guanabara-Koogan; 2015. p. 67-75.
3. Carhart R. Problems in the measurement of speech discrimination. Arch Otolaryngol. 1965;82:253-60. https://doi.org/10.1001/ archotol.1965.00760010255007
4. Egan JP. Articulation testing methods. Laryngoscope. 1948;58(9):955-91. https://doi.org/10.1288/00005537-194809000-00002
5. Silva AM, Gordo A, Pereira LD. Índice percentual de reconhecimento da fala com e sem ruído em indivíduos com perda condutiva e neurossensorial: estudo comparativo. Acta AWHO. 1997;16(4):174-78.
6. Roll E, Wallenhaupt D, Ramos APF, Menegotto IH. Novas listas de monossílabos para avaliação do reconhecimento da fala. Pro Fono. 2003;15(2):159-68.
7. Zamboni ZC, Iorio MCM. Reconhecimento de fala no nível de máximo conforto em pacientes adultos com perda auditiva neurossensorial. Rev Soc Bras Fonoaudiol. 2009;14(4):491-7. https:// doi.org/10.1590/S1516-80342009000400011
8. Russo ICP, Santos, TMM. A prática da audiologia clínica.4a ed.São Paulo: Cortez; 1993. Capítulo IV, Logoaudiometria; p. 73-88. 9. Carhart R. Basic principles of speech audiometry. Acta Otolaryngol.
1951;40(1-2):62--71.
10. Vaucher AVA. Construção e validação de listas de monossílabos para a realização do índice percentual de reconhecimento da fala [tese]. Santa Maria: Universidade Federal de da Comunicação Humana; 2016.
11. Pasquali L. Psicometria: teoria dos testes na psicologia e na educação. 4a ed. Rio de Janeiro: Vozes; 2011.
12. Pacico JC, Hutz CS. Validade. In: Hutz CS, Bandeira DR, Trentin CM, organizadores. Psicometria. Porto Alegre: Artmed; 2015. 13. Pasquali L. Psicometria. Rev Esc Enferm USP. 2009;43(n esp):992-9.
https://doi.org/10.1590/S0080-62342009000500002
14. Mangabeira-Albernaz PL. Logoaudiometria. In: Pereira LD, Schochat E, organizadores. Processamento auditivo central: manual de avaliação.São Paulo: Lovise; 1997. p. 37-42.
15. Lloyd LL, Kaplan H. Audiometric interpretation: a manual o basic audiometry. Baltimore: University Park Press; 1978.
16. Westerhausen R, Bless J, Kompus K. Behavioral laterality and aging: the free-recall dichotic-listening right-ear advantage increases with age. Develop Neuropsychol. 2015;40(5):313-27. https://doi.org/10. 1080/87565641.2015.1073291
17. Wilson RH, McArdle R. Speech signals used to evaluate functional status of the auditory system. J Rehabil Res Dev.2005;42(4 Suppl 2):79-94. https://doi.org/10.1682/JRRD.2005.06.0096
18. Soncini F, Costa MJ, Oliveira TMT. Influência do processo de envelhecimento no reconhecimento de fala em indivíduos normo-ouvintes. Pro Fono. 2003;15(3):287-96.
19. Calais LL, Gregio AML, Gil D, Borges ACLC. Reconhecimento de fala e a previsibilidade da palavra em idosos: revisão de literatura. Disturb Comun. 2014;26(2):386-94.
20. Bernabei R, Bonuccelli U, Maggi S, Marengoni A, Martini A, Memo M et al. Hearing loss and cognitive decline in older adults: questions and answers. Aging Clin Exp Res. 2014;26(6):567-73. https://doi. org/10.1007/s40520-014-0266-3
21. Fernandes DG, Souza PC, Costa-Guarisco LP. Estudo do reconhecimento de fala nas perdas auditivas neurossensoriais descendentes. Rev CEFAC. 2014;16(3):792-7. https://doi. org/10.1590/1982-0216201423612
22. Deng X, Ji F, Yang S. Correlation between maximum phonetically balanced word recognition score and pure-tone auditory threshold in elder presbycusis patients over 80 years old. Acta Otolaryngol. 2014;134(2):168-72. https://doi.org/10.3109/00016489.2013.844855 23. Baraldi GS, Almeida lC, Borges ACC. Evolução da perda
auditiva no decorrer do envelhecimento. Braz J Otorhinolaryngol. 2 0 0 7 ; 7 3 ( 1 ) : 6 4 7 0 . h t t p s : / / d o i . o r g / 1 0 . 1 5 9 0 / S 0 0 3 4 -72992007000100010
24. Andrade AN, Iorio MCM, Gil D. Speech recognition in individuals with sensorineural hearing loss. Braz J Otorhinolaryngol. 2016;82(3):334-40. https://doi.org/10.1016/j.bjorl.2015.10.002 25. Silverman SR, Hirsh, IJ. Problems related to the use of speech in
clinical audiometry. Ann Otol Rhinol Laryngol. 1956;64(4):1234-44. https://doi.org/10.1177/000348945506400424
26. Kreul EJ, Bell DW, Nixon JC. Factors affecting speech discrimination test difficulty. J Speech Hear Res.1969;12(2):281-87. 27. Mendel LL, Owen SR. A study or recorded versus live voice word
recognition. Int J Audiol. 2011;50(10):688-93. https://doi.org/10.31 09/14992027.2011.588964
28. Brandy WT. Reliability of voice tests of speech discrimination. J Speech Lang Hear Res. 1966;9:461-5. https://doi.org/10.1044/ jshr.0903.461