Morbidity and Mortality According to Latest
CD4+ Cell Count among HIV Positive
Individuals in South Africa Who Enrolled in
Project Phidisa
Patrick H. Maduna1, Matt Dolan2, Lwando Kondlo3, Honey Mabuza1, Judith N. Dlamini3, Mike Polis4, Thabo Mnisi1, Susan Orsega4, Patrick Maja3, Lotty Ledwaba3,
Thuthukile Molefe3, Phumelele Sangweni3, Lisette Malan1, Gugu Matchaba3, Paul Khabo3, Greg Grandits5, James D. Neaton5*
1South Africa Military Health Services, South African National Defence Forces, Pretoria, South Africa,
2The Henry M. Jackson Foundation for the Advancement of Military Medicine, Inc., Bethesda, Maryland, United States of America,3Charisma Healthcare Solutions, Pretoria, South Africa,4National Institute of Allergy and Infectious Diseases, National Institutes of Health, Bethesda, Maryland, United States of America,
5Division of Biostatistics, University of Minnesota, Minneapolis, Minnesota, United States of America
Abstract
Background
Short-term morbidity and mortality rates for HIV positive soldiers in the South African Na-tional Defence Force (SANDF) would inform decisions about deployment and HIV disease management. Risks were determined according to the latest CD4+ cell count and use of an-tiretroviral therapy (ART) for HIV positive individuals in the SANDF and their dependents.
Methods and Findings
A total of 7,114 participants were enrolled and followed for mortality over a median of 4.7 years (IQR: 1.9, 7.1 years). For a planned subset (5,976), progression of disease (POD) and grade 4, potentially life-threatening events were also ascertained. CD4+ count and viral load were measured every 3 to 6 months. Poisson regression was used to compare event rates by latest CD4+ count (<50, 50–99, 100–199, 200–349, 350–499, 500+) with a focus on upper three strata, and to estimate relative risks (RRs) (ART/no ART). Median entry CD4+ was 207 cells/mm3. During follow-up over 70% were prescribed ART. Over follow-up
1,226 participants died; rates ranged from 57.6 (<50 cells) to 0.8 (500+ cells) per 100 per-son years (py). Compared to those with latest CD4+ 200–349 (2.2/100py), death rates were significantly lower (p<0.001), as expected, for those with 350–499 (0.9/100py) and with 500+ cells (0.8/100py). The composite outcome of death, POD or grade 4 events oc-curred in 2,302 participants (4,045 events); rates were similar in higher CD4+ count strata (9.4 for 350–499 and 7.9 for 500+ cells) and lower than those with counts 200–349 cells
OPEN ACCESS
Citation:Maduna PH, Dolan M, Kondlo L, Mabuza H, Dlamini JN, Polis M, et al. (2015) Morbidity and Mortality According to Latest CD4+ Cell Count among HIV Positive Individuals in South Africa Who Enrolled in Project Phidisa. PLoS ONE 10(4): e0121843. doi:10.1371/journal.pone.0121843
Academic Editor:Graciela Andrei, Rega Institute for Medical Research, BELGIUM
Received:July 23, 2014
Accepted:February 19, 2015
Published:April 9, 2015
Copyright:This is an open access article, free of all copyright, and may be freely reproduced, distributed, transmitted, modified, built upon, or otherwise used by anyone for any lawful purpose. The work is made available under theCreative Commons CC0public domain dedication.
Data Availability Statement:The data underlying this study are owned by the South African National Defence Force (SANDF). Interested researchers can contact the SANDF directly to request data, using the following contact information: Lotty Ledwaba at [email protected].
(13.5) (p<0.001). For those with latest CD4+ 350+ cells, 63% of the composite outcomes (680 of 1,074) were grade 4 events.
Conclusion
Rates of morbidity and mortality are lowest among those with CD4+ count of 350 or higher and rates do not differ for those with counts of 350–499 versus 500+ cells. Grade 4 events are the predominant morbidity for participants with CD4+ counts of 350+ cells.
Introduction
South Africa is one of the first nations to integrate persons with HIV into military deployments and peacekeeping operations. When deciding whether an HIV positive participant should be included as part of internal or external military deployments, reliable quantification of the risk of serious illness over the next 6–12 months is necessary [1].
CD4+ cell count is an established prognostic marker for AIDS and death [2], and current/ most recent CD4+ cell count has been shown to be a good predictor of short-term risk of AIDS and death in cohorts comprised of participants in both resource-rich and resource-poor set-tings [3–12]. Such data for ART-naïve patients have been used to make decisions about when to initiate antiretroviral treatment [3]. Until recently, there were less data on risks of non-AIDS events such as major cardiovascular, renal and liver disease events and non-AIDS cancer [13–
17]. These events have been associated with HIV disease and ART [18] and may be associated with a greater risk of death than AIDS events [19], therefore, an overall assessment of the short-term risk of serious illness needs to also consider non-AIDS conditions. With few excep-tions [7,20], most data on serious non-AIDS conditions have been generated from cohorts in high-income countries and, as noted in a recent editorial, the spectrum of illness among indi-viduals with HIV in Africa is likely different [21].
Many studies involving African cohorts have also had high lost to follow-up rates [12,22–
24]. Larger cohorts with follow-up for mortality and different types of morbidity are needed to inform policy on military deployments in South Africa. Such data will also inform the manage-ment of HIV patients more generally with high CD4+ cell counts and help establish future research directions.
In this paper data from a large cohort of over 7,000 HIV positive South African National Defence Force (SANDF) members and their dependents who were followed for several years are used to estimate the risk of death and serious illness according to latest CD4+ cell count and to assess whether those risks vary according to use of ART.
Methods
Study population
Project Phidisa is an HIV/AIDS research collaboration between the South African Department of Defence (SA DoD) through the South African Military Health Service (SAMHS), the US De-partment of Health and Human Services through the National Institutes of Health (NIH), and the US Department of Defense (US DoD). It was established in 2003 with the aim of studying HIV in a sample of SANDF members and their dependents.
Project Phidisa includes participants enrolled in 3 protocols at 6 SAMHS sites: hospitals in Pretoria, Cape Town and Bloemfontein, and sickbays in Phalaborwa, Mtubatuba, and Mthatha. Beth Basseler and Xiao Liu who contributed to the
study. This project has been funded in whole or in part with federal funds from the National Cancer Institute, National Institutes of Health, under contract no. HHSN261200800001E. The content of this publication does not necessarily reflect the views or policies of the Department of Health and Human Services, nor does mention of trade names, commercial products, or organizations imply endorsement by the U.S. Government. The funders had a role in study design, data collection and analysis, decision to publish, and preparation of the manuscript.
Beginning in January 2004, HIV-infected SANDF members and their dependents could be en-rolled in a cohort study (Phidisa 1) or in a randomized trial (Phidisa 2) (ClinicalTrials.gov identifier: NCT00342355) [25]. For Phidisa 1, the inclusion criteria were very broad; any HIV-positive individual in the SANDF or their family members could be enrolled. For Phidisa 2, HIV-positive individuals could be randomized to one of four ART regimens if their CD4+ count was<200 cells or they had a prior AIDS diagnosis and they met the following other
eli-gibility criteria: hemoglobin level of 9 g/dL or higher (8 g/dL or higher for women), a neutro-phil count>500 cells/μL, a platelet count>25,000 platelets/μL, and a serum liver
transaminase level<5 times the upper limit of the normal range [25]. Participants who were
not enrolled in the trial received ART according to South African national guidelines [26]. In March 2008, after the clinical trial was completed, all participants in Phidisa 1 and disa 2 were invited to participate in an amended observational study protocol (Phidisa 1a). Phi-disa 1a included participants in PhiPhi-disa 1 and PhiPhi-disa 2 who reconsented and newly enrolled HIV positive participants. Like Phidisa 1, the inclusion criteria were very broad, any HIV-posi-tive SANDF member or their family members could be enrolled, and for ART-naïve partici-pants, ART was initiated according to South African national guidelines [26]. Phidisa 1 and 1a also included participants who were not HIV positive. These participants are not included in this report.
Ethics statement
The study was approved by the Phidisa/SANDF Institutional Review Board and National Insti-tute of Allergy and Infectious Diseases (NIAID) Institutional Review Board. Written informed consent was obtained from all participants.
Data collection and follow-up of participants
At the time of enrollment (baseline), a medical history was obtained, a physical examination was performed, and plasma HIV RNA level, CD4+ cell count, hematology and clinical chemis-tries were determined. The database does not include information to identify a SANDF mem-ber from a dependent.
Prior to April 2008, follow-up visits occurred at least every 3 months for trial participants (Phidisa 2) and at least every 6 months for participants who were not in the trial (Phidisa 1). After April 2008 and through February 2012, participants in Phidisa 1a were seen every 3 months if on ART and every 6 months if not on ART. In 2012, the follow-up visit schedule for all participants was changed to every 6 months.
At each follow-up visit, interim medical and treatment histories were obtained and CD4+ cell counts and HIV RNA levels were measured. Deaths were reported throughout foIlow-up for participants in Phidisa 1, Phidisa 2, and Phidisa 1a. Henceforth, this is referred to as the mortality cohort. Follow-up time for this cohort began at enrollment date into Phidisa 1, Phi-disa 2, or PhiPhi-disa 1A. POD events, which include AIDS-defining events and pulmonary tuber-culosis (TB), and events considered potentially life-threatening (grade 4 events), which were not limited to laboratory abnormalities, were collected for participants in Phidisa 2 and for all participants enrolled in Phidisa 1a. Henceforth, this subset of participants is referred to as the morbidity and mortality cohort. Follow-up time for this cohort began at enrollment date into Phidisa 2 or Phidisa 1A.
Grade 4 events were coded according to theMedical Dictionary for Regulatory Activities
non-AIDS conditions) are summarized as well as grade 4 events classified according to 26 dif-ferent system organ classes (SOCs).
For participants who enrolled in Phidisa 1a follow-up continued through February 28, 2013 except those enrolled in satellite sites of Mtubatuba and Mthatha, and for those enrolled at Phalaborwa. Follow-up ended for participants at the satellite sites on June 1, 2012 and for the participants at Phalaborwa on January 31, 2013. After the end of follow-up sites were asked to verify vital status, POD and grade 4 event status as of their site closing date for all participants who had not been seen for 12 months. For many participants who had been seen in the last 12 months, vital status and POD and grade 4 event status was also verified as of the closing date for the site. For each participant the date last known to be alive and date last known to be free of POD or grade 4 events were recorded. Participants who were not seen in the 12 months prior to the closing date for the site were considered lost to follow-up for vital status (or POD or grade 4 events).
Statistical analysis
For the mortality cohort, death rates were calculated by accumulating person time according to latest CD4+ cell count (<50, 50–99, 100–199, 200–349, 350–499 and 500+ cells). Person time
was counted from the time of each CD4+ measurement until the first of the following: next CD4+ cell count, death, date last known alive, or date of closeout. CD4+ cell counts were up-dated every 3 or 6 months; thus, the rates can be interpreted as the short-term risk of death as-sociated with a given CD4+ cell count, a measure that was considered to be relevant for making decisions about deployment and clinical management. For analyses according to use of ART, follow-up was censored for the cohort not on ART when ART was initiated. For these analyses, once a person started ART they were considered always on ART. The number of events and rates per 100 person years (PY) are cited. Standard errors of the rates can be obtained by divid-ing the rate by the square root of the number of events. Poisson regression (usdivid-ing the GEN-MOD procedure in SAS) with log person years as an offset and a compound symmetry covariance structure to account for the repeated CD4+ periods within a person was used to de-termine unadjusted and adjusted relative rates (RR) and 95% confidence intervals (CIs). CD4+ was modeled as both a continuous variable (square root transformation) to assess trends and as a model with 5 indicators variables to represent the six CD4+ strata. For the latter, those with latest levels of CD4+ 200–349 cells/mm3were used as the reference group. In addition comparisons between the upper two CD4+ count strata are made (350–499 versus 500+ cells). Adjustment considers age, gender, and history of POD at the time of enrolment, and time-up-dated HIV viral load categorized as<400, 400–9999, and 10,000+ copies/mL. Deviance
statis-tics and deletion diagnosstatis-tics indicated a good fit of the Poisson model [27].
For analyses of associations of latest CD4+ cell count with mortality for those on and not on ART, instead of censoring follow-up for those not on ART when ART was initiated, a second analysis was also performed which considered the initiation of ART as a competing risk. For this analysis a competing risk proportional hazards regression model was used [28]. A referee noted that this is a more appropriate estimate than hazards determined from a regression model that considers the cause-specific hazards (e.g., mortality and initiation of ART) because of their dependence (i.e., participants with lower CD4+ counts are more likely to initiate ART and someone who has initiated ART has zero risk of pre-ART death). This dependence would lead to bias in comparing associations between latest CD4+ cell count and mortality for those not on ART and those on ART. For those not on ART, a supplemental table (S3 Table) is in-cluded which compares estimates of CD4+ modeled as a continuous variable and with 5 indica-tors variables as mentioned in the preceding paragraph when a cause-specific hazard
proportional hazards regression model is used and when a competing risk proportional haz-ards regression model. The former is similar to the Poisson regression model described above.
All analyses ignored the treatment assignment in Phidisa 2 since rates of mortality and mor-bidity did not differ among the four randomized groups [25]. For selected comparisons, analy-ses are cited for those in the trial separately from those who did not participate in the trial.
All reported P values are 2 sided; difference with P<. 05 were considered significant. SAS
(version 9.4, SAS institute) was used.
Results
In Project Phidisa, 7,114 HIV positive participants were enrolled in the mortality cohort; 3,418 were enrolled in Phidisa 1, 1,771 in Phidisa 2 and 1,925 in Phidisa 1a (Fig 1). At enrolment, me-dian age was 35 years; 37.5% were female; meme-dian CD4+ count was 207 cells/mm3; 48.4% had CD4+ counts<200, 25.2% had counts 200–349, and 26.3% had counts of 350 cells or higher;
282 participants (4.4%) were prescribed ART at enrolment (Table 1).
Enrolment characteristics for the three Phidisa groups which comprise the mortality cohort are given inS1 Table. Of these 7,114 participants, 5,976 participants were in the morbidity and mortality cohort (referred to as MM cohort inFig 1). Enrolment characteristics for the morbid-ity and mortalmorbid-ity cohort were similar to those for the mortalmorbid-ity cohort (seeS2 Table). Flow dia-grams giving the number of participants who developed an event and the number with unknown event status are shown in Figs2and3.
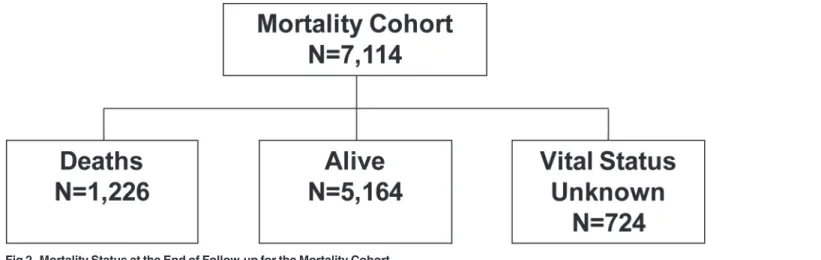
Median follow-up for participants in the mortality cohort was 4.7 years (IQR: 1.9,7.1 years); 1,226 participants died over a median follow-up of 0.8 years (IQR: 0.2, 2.4 years). A closeout visit form that verified vital status and POD and grade 4 event status as of the site closing date was completed for 93.8% of participants who had not attended a study visit in the 12 months before closure; a closeout form was completed for 80.2% of participants who had been seen within 12 months of site closure. Based on this information, vital status was unknown (i.e., no contact for at least 12 months) for 724 participants (10.2%); using a definition of no contact for 9 months, the percent with unknown vital status is 12.0%. Expressed as a rate, lost to follow-up was 2.2 per 100 person years. Compared to deaths and known survivors, those with unknown vital status were more likely to be female and have higher CD4+ cell counts at entry (Table 1). The 724 participants with no contact for at least 12 months were followed for 1,527 person years before becoming lost-to-follow-up. The median CD4+ cell count at the last follow-up visit they attended was 303 cells (IQR: 117 to 452).
enrolment<50 cells as compared to 12.9% of survivors). Those who died had higher HIV
RNA levels at enrolment (5.2 versus 4.7 log10copies/mL), were less likely to be on ART (2.3% versus 4.8%), and were more likely to have a history of POD (43.7% versus 22.4%).
Use of ART and CD4+ cell count and HIV RNA measurements during
follow-up
Of the 7,114 participants in the mortality cohort 2,003 (28.2%) were prescribed ART by com-pletion of the enrolment visit; 1,771 of these participants were prescribed ART as part of the randomized trial (Phidisa 2). During follow-up another 3,035 of the 7,114 participants (42.7%) initiated ART. Thus, for 70.9% of participants in the mortality cohort ART was prescribed at some point during the follow-up period. In total, for the mortality cohort, 20,734 person years accrued on ART and 11,282 person years accrued not on ART. The median (IQR) CD4+ at the time ART was first prescribed during follow-up was 143 (67, 210). Most initiated ART when their CD4+ count was<200 cells/mm3(71.5%); 1,042 (21.6%) initiated cART at counts
Fig 1. Phidisa Mortality and Morbidity and Mortality (MM) Cohorts.The mortality cohort is made up of 7,114 HIV+ participants: 1,771 enrolled into Phidisa 2 (the clinical trial), 3,418 into Phidisa 1 (cohort study) and 1,925 into Phidisa 1A (cohort study). Of these 7,114 participants, 5,976 participants were in the morbidity and mortality cohort. This includes the 1,771 participants from Phidisa 2, the 1,925 participants from Phidisa 1A and 2,280 participant form Phidisa 1 who reconsented into Phidisa 1A. The participants excluded from the MM cohort are the 1,138 participants enrolled in Phidisa 1 only in which morbidity data was not collected.
between 200 and 349 cells; 331 (6.9%) initiated at a count>350 cells/uL. There were 66,007
fol-low-up visits after initiating ART. At 75.2% of these visits, the HIV RNA level was<400 copies/
mL. The median CD4+ count at study entry for participants who did not initiate ART during follow-up was 335 cells (IQR: 153 to 508). During follow-up, the number of CD4+ counts for each participant ranged from 1 to 36 with a median number of 11 (IQR: 4–19).
These follow-up statistics were similar for the 5,976 participants in the morbidity and mor-tality cohort. ART was prescribed for 4,999 (83.7%) of these participants at entry or during
Table 1. Characteristics at Enrolment of Phidisa HIV Positive Participants by Mortality Status: Mortality Cohort.
Demographics Known Deceased Known Alive Unknown Total
Age (median years) 35.0 [32.0, 39.0] 35.0 [32.0, 39.0] 33.0 [30.0, 37.0] 35.0 [32.0, 39.0]
Female (%) 279 (22.8%) 2049 (39.7%) 338 (46.7%) 2666 (37.5%)
Location of home (% rural) 501 (40.9%) 2247 (43.5%) 231 (32.0%) 2979 (41.9%)
Marital status (% married) 697 (56.9%) 3474 (67.3%) 456 (63.2%) 4627 (65.1%)
Education (% HS or tertiary) 957 (78.3%) 4183 (81.2%) 623 (86.5%) 5763 (81.2%)
Body Mass Index (median kg/m2) 21.2 [18.9, 24.3] 24.3 [21.5, 28.1] 24.3 [21.4, 28.2] 23.8 [20.9, 27.6]
On ART at Baseline (%) 22 (2.3%) 233 (4.8%) 27 (4.5%) 282 (4.4%)
HIV characteristics
CD4 count (median cells/mm3) 94.5 [27.0, 231.5] 221.0 [105.0, 372.0] 277.0 [147.0, 444.0] 207.0 [87.0, 360.0]
<50 432 (35.5%) 663 (12.9%) 59 (8.2%) 1154 (16.3%)
50–99 198 (16.3%) 537 (10.4%) 53 (7.4%) 788 (11.1%)
100–199 216 (17.8%) 1131 (22.0%) 142 (19.7%) 1489 (21.0%)
200–349 222 (18.3%) 1372 (26.7%) 187 (26.0%) 1781 (25.2%)
350–499 83 (6.8%) 726 (14.1%) 148 (20.6%) 957 (13.5%)
500 + 65 (5.3%) 712 (13.8%) 130 (18.1%) 907 (12.8%)
HIV viral load (median log10copies/mL) 5.2 [4.7, 5.6] 4.7 [4.0, 5.2] 4.4 [3.7, 5.1] 4.8 [4.1, 5.3]
Hb (median g/dl) 11.6 [9.8, 13.4] 13.1 [11.6, 14.4] 13.1 [11.5, 14.4] 12.9 [11.3, 14.3] Co-morbidities
Hepatitis B—SAG positive (%) 66 (5.5%) 179 (3.5%) 12 (1.7%) 257 (3.6%)
Hepatitis C (%) 7 (0.6%) 27 (0.5%) 3 (0.4%) 37 (0.5%)
History of AIDS or Pulmonary/Extrapulmonary TB (%) 415 (43.7%) 1089 (22.4%) 105 (17.7%) 1609 (25.2%)
Number of patients 1226 5164 724 7114
doi:10.1371/journal.pone.0121843.t001
Fig 2. Mortality Status at the End of Follow-up for the Mortality Cohort.
follow-up; 20,672 person years accrued on ART and 10,236 person years accrued not on ART; and the median CD4+ cell count at the time ART was prescribed during follow-up was 143 cells (IQR: 67, 210). These participants had CD4+ cell counts measured at a median of 14 visits (IQR: 7, 21).
Death rates by latest CD4+ count in the mortality cohort
The overall death rate was 3.8 per 100 person years (for 6 participants who died a prior CD4+ count were not available and they are excluded). Latest CD4+ cell count specific death rates de-clined from 57.6 per 100 person years for those in the<50 cell stratum to 0.8 per 100 person
years in the 500 cell and higher CD4+ cell count stratum (Table 2).
Eight hundred and fifty-two of the 1,220 deaths (69.8%) occurred when the latest CD4+ cell count was<200 cells. Compared to those with latest CD4+ counts 200–349 cells, adjusted RRs
of death were significantly higher (p<0.001) in each of the three lowest CD4+ strata, and
sig-nificantly lower (p<0.001) for those with CD4+ counts in two higher strata. Death rates in the
upper two CD4+ strata were similar (0.9 and 0.8 per 100 person years). The adjusted RR and
Fig 3. Event Status at the End of Follow-up for the Morbidity and Mortality Cohort.
doi:10.1371/journal.pone.0121843.g003
Table 2. Mortality Rates by Latest CD4 Count (cells/mm3) for Phidisa Participants: Mortality Cohort.
Mortality
Unadjusted Adjusted
Latest CD4 Count No. Events Event Rate Per 100 PY Relative Rate P-Value Relative Rate P-Value
<50 423 57.6 26.13 (22.17–30.80) <.001 12.95 (10.49–15.98) <.001
50–99 211 20.0 9.10 (7.52–11.00) <.001 5.84 (4.69–7.28) <.001
100–199 218 5.4 2.46 (2.05–2.96) <.001 1.96 (1.60–2.40) <.001
200–349 230 2.2 1.00 (Reference) 1.00 (Reference)
350–499 75 0.9 0.43 (0.33–0.56) <.001 0.44 (0.33–0.58) <.001
500 63 0.8 0.37 (0.28–0.49) <.001 0.44 (0.32–0.60) <.001
Total (Estimate per sqrt cell) 1220 3.8 -0.248±0.006 -0.197±0.008
Notes:Relative rate estimates obtained using Poisson Regression
95% CI for mortality while CD4+ count was 500+ versus 350–499 was 1.01 (95% CI: 0.70 to 1.46).
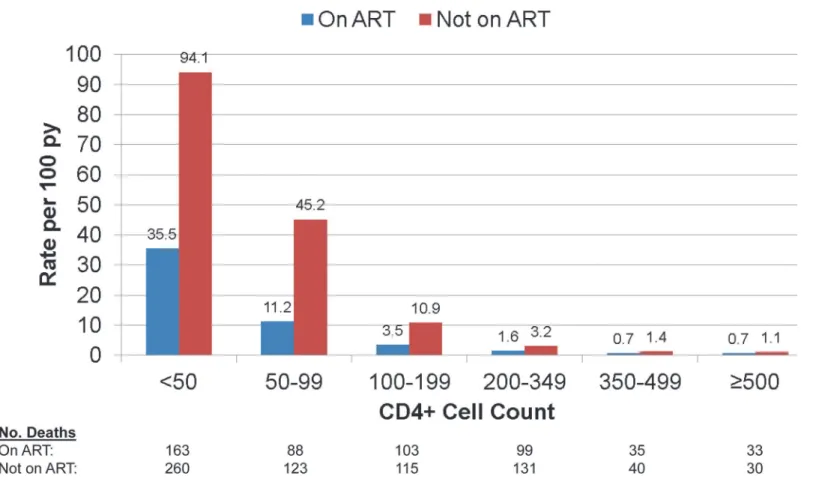
Fig 4gives death rates by latest CD4+ cell count according to use of ART. In each CD4+ count group, rates of death for those not on ART were greater than for those on ART.
For those on ART, adjusted RRs defined like those in the last column ofTable 2were 16.5 (95% CI: 11.9 to 22.9), 5.7 (95% CI: 4.2 to 7.9), 1.9 (95% CI: 1.4 to 2.5), 0.41 (95% CI: 0.27 to 0.62) and 0.47 (95% CI: 0.31 to 0.70) for those with latest CD4+ cell counts<50, 50–99, 100–
199, 350–499, and 500+, respectively, relative to the group with a latest count of 200–349 cells. We carried out an analysis separately for participants in the Phidisa 2 clinical trial and for those who were on ART but not in the trial. The slope of mortality on latest CD4+ cell count after square root transformation was greater for those in Phidisa 2 (-0.249) compared to those who were not (-0.148). This was due to the much higher death rate in the lower latest CD4+ count group (<50 cells) for trial participants (48.8 per 100 person years) as compared to those who
were not in the trial (21.8 per 100 person years). For the other latest CD4+ count groups (50–99, 100–199, 200–349, 350–499 and 500+ cells) death rates were similar for the two cohorts (12.7, 3.8, 1.3, 0.7 and 0.6 per 100 person years for Phidisa 2 participants and 9.8, 3.1, 1.8, 0.7 and 0.8 per 100 person years for those on ART but not in Phidisa 2).
For participants not on ART, the adjusted RRs were 11.0 (95% CI: 8.0 to 15.2), 7.2 (95% CI: 5.2 to 10.0), 2.4 (95% CI: 1.8 to 3.2), 0.48 (95% CI: 0.32 to 0.73) and 0.44 (95% CI: 0.28 to 0.71)
Fig 4. Mortality by Latest CD4+ Cell Count and ART status for Phidisa Participants.
for those with latest CD4+ cell counts<50, 50–99, 100–199, 350–499, and 500+, respectively,
relative to the group with a latest count of 200–349 cells.
The CD4+ slopes for those on ART and not on ART were -0.209 (SE = 0.013) and -0.187 (SE = 0.011), respectively (p = 0.20 for difference in slopes). Of the 624 deaths that occurred with latest CD4+ cell counts<100 cells, 61.4% were patients who died before starting ART.
Mortality, POD and grade 4 event rates by latest CD4+ count and use of
ART in the morbidity and mortality cohort
The morbidity and mortality cohort is comprised of 5,976 participants from 3 groups; 1,771 were enrolled in Phidisa 2 (93% of participants who were alive at the time of enrolment in Phi-disa 1a reconsented for further follow-up), 2,280 were initially enrolled in PhiPhi-disa 1 and recon-sented to participate in Phidisa 1a (for these participants, only follow-up during Phidisa 1a is used), and 1,925 were newly enrolled in Phidisa 1a (Fig 1). Event (death, POD or grade 4) sta-tus was unknown (no contact for 12 months) for 302 (5.1%) of the participants in this cohort (Fig 3); this percent was 6.0% if no contact within 9 months is considered. Expressed as a rate, the lost to follow-up was 1.0 per 100 person years.
Table 3summarizes findings by latest CD4+ cell count for death, POD, grade 4 events and the composite outcome that includes these events. For the composite outcome and each com-ponent, rates declined with increasing CD4+ cell count. Adjusted slopes were significantly less than zero for the composite outcome and each component. The most negative slope was found for all-cause mortality (slope = -0.213, SE = 0.011); the least negative was observed for grade 4 events (slope = -0.086, SE = 0.007).
The difference in rates between the upper two CD4+ strata was not significant except for POD which was lower for those with latest CD4+ count of 500+ versus 350–499 cells/mm3 (crude rates were 1.8 versus 3.1 per 100 person years). The adjusted RRs and 95% CIs while the CD4+ count was 500+ versus 350–499 were 0.97 (95% CI: 0.62 to 1.50), 0.67 (95% CI: 0.51 to 0.87), 0.99 (95% CI: 0.84 to 1.17), and 0.89 (95% CI: 0.77 to 1.02), for death, POD, grade 4 events, and the composite outcome, respectively.
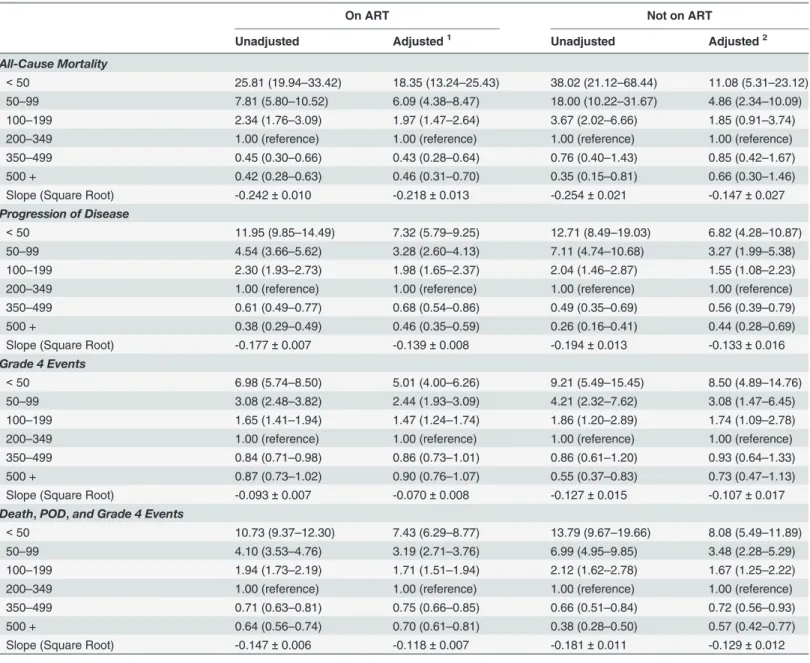
Table 4summarizes event rates by latest CD4+ count and gives RRs by ART status using those with latest CD4+ cell count of 200–349 cells as reference. For the composite outcome, RRs for the upper two CD4+ strata compared to the 200–349 stratum were significantly less than 1.0 for those on and not on ART and rates in the upper two CD4+ strata did not differ from one another. The adjusted RRs (500+ versus 350–499) were 0.94 (95% CI: 0.81 to 1.10) and 0.79 (95% CI: 0.57 to 1.09) for those on and not on ART, respectively.
S3 Tablecompares results from a cause-specific hazard and competing risk proportional hazards regression model for mortality and POD for those not on ART. CD4+ slopes and HR estimates for counts less than 200 cells are smaller for the competing risk regression models than the cause-specific hazards model. Estimates for counts at 350–499 and 500+ cells versus 200–349 cells are similar for the two models, likely as a result of less dependence between the competing events of death and POD with initiation of ART at higher counts.
We also assessed whether rates of morbidity and mortality differed between those on and not on ART according to latest CD4+ cell count level (Table 5). Overall, for the composite out-come, the adjusted RR (ART/no ART) was 0.83 (95% CI: 0.74–0.93). This lower overall rate for those on ART compared to those not on ART primarily resulted from a significantly lower rates on ART in the lower two CD4+ strata. For the upper two latest CD4+ strata, the RR (ART/no ART) was 1.05 (95% CI: 0.86 to 1.28).
CI; 0.66–1.09). POD rates were lower for those on ART as compared to those not on ART in each CD4+ stratum; overall the adjusted RR was 0.55 (95% CI: 0.47–0.64). The most common POD event was pulmonary TB. Of the 1,160 POD events that occurred on ART, 747 (64.4%)
Table 3. Mortality and Morbidity Rates by Latest CD4 Count (cells/mm3) for Phidisa Participants: Morbidity and Mortality Cohort.
Unadjusted Adjusted
Mortality No. Events Event Rate Per 100 PY Relative Rate P-Value Relative Rate P-Value
<50 181 42.5 27.08 (21.43–34.21) <0.001 18.19 (13.80–23.97) <0.001
50–99 101 13.6 8.70 (6.67–11.34) <0.001 6.22 (4.66–8.31) <0.001
100–199 119 3.9 2.47 (1.92–3.18) <0.001 2.02 (1.55–2.62) <0.001
200–349 122 1.6 1.00 (Reference) 1.00 (Reference)
350–499 50 0.8 0.51 (0.37–0.71) <0.001 0.48 (0.34–0.68) <0.001
500 39 0.6 0.41 (0.28–0.58) <0.001 0.46 (0.32–0.66) <0.001
Total (Estimate per sqrt cell) 612 2.5 -0.242±0.009 -0.213±0.011
RR (500 v 350–499): 0.97 (0.62–1.50)
Progression of Disease
<50 260 61.1 11.16 (9.43–13.22) <0.001 6.84 (5.59–8.36) <0.001
50–99 181 24.4 4.50 (3.74–5.41) <0.001 3.19 (2.61–3.90) <0.001
100–199 348 11.3 2.08 (1.79–2.42) <0.001 1.84 (1.57–2.16) <0.001
200–349 421 5.4 1.00 (Reference) 1.00 (Reference)
350–499 193 3.1 0.56 (0.47–0.68) <0.001 0.62 (0.51–0.75) <0.001
500 113 1.8 0.34 (0.27–0.42) <0.001 0.41 (0.33–0.52) <0.001
Total (Estimate per sqrt cell) 1516 6.2 -0.176±0.006 -0.139±0.007
RR (500 v 350–499): 0.67 (0.51–0.87)
Grade 4 Events
<50 212 49.8 7.38 (6.14–8.88) <0.001 6.13 (5.01–7.49) <0.001
50–99 164 22.1 3.24 (2.65–3.97) <0.001 2.82 (2.27–3.50) <0.001
100–199 351 11.4 1.71 (1.47–1.99) <0.001 1.61 (1.37–1.88) <0.001
200–349 510 6.6 1.00 (Reference) 1.00 (Reference)
350–499 346 5.5 0.84 (0.73–0.97) 0.019 0.85 (0.73–0.98) 0.031
500 334 5.5 0.81 (0.69–0.94) 0.007 0.84 (0.71–0.98) 0.030
Total (Estimate per sqrt cell) 1917 7.9 -0.099±0.007 -0.086±0.007
RR (500 v 350–499): 0.99 (0.84–1.17)
Death, POD, and Grade 4
<50 653 153.4 10.93 (9.64–12.40) <0.001 7.88 (6.80–9.13) <0.001
50–99 445 60.0 4.32 (3.77–4.95) <0.001 3.39 (2.92–3.93) <0.001
100–199 819 26.7 1.93 (1.73–2.15) <0.001 1.75 (1.56–1.96) <0.001
200–349 1054 13.5 1.00 (Reference) 1.00 (Reference)
350–499 588 9.4 0.69 (0.62–0.78) <0.001 0.72 (0.64–0.81) <0.001
500 486 7.9 0.57 (0.50–0.65) <0.001 0.64 (0.56–0.73) <0.001
Total (Estimate per sqrt cell) 4045 16.6 -0.152±0.005 -0.126±0.006
RR (500 v 350–499): 0.89 (0.77–1.02)
Notes:Relative rate estimates obtained using Poisson Regression
Adjusted for age, gender, history of AIDS or TB, and time updated viral load (<400, 400–9999, 10000+)
were due to pulmonary TB; 246 of the 356 POD events (69.1%) that occurred among partici-pants not taking ART were attributed to pulmonary TB.
For grade 4 events, overall, the adjusted RR (ART/no ART) was 1.15 (95% CI: 0.98–1.34). Grade 4 events accounted for approximately 50% of the morbidity among participants taking ART (1,635 of 3,296 events). For those not on ART, most events were due to POD and grade 4 events comprised 38% of all events.
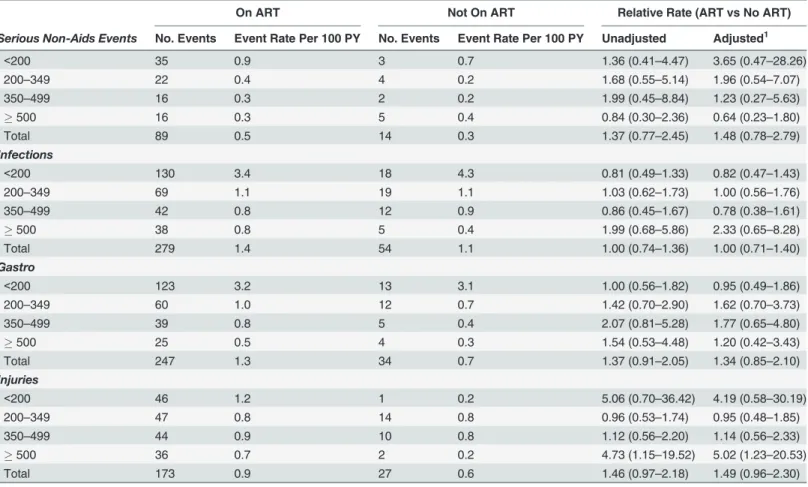
Tables6and7examine the types of grade 4 events by latest CD4+ count and ART status. Overall, few serious non-AIDS events by our definition (seeMethods) occurred. Among partic-ipants on ART, there were 89 serious non-AIDS events (rate = 0.5 per 100 person years); 14
Table 4. Relative Rates of Morbidity and Mortality by Latest CD4 Count (cells/mm3) and ART Status: Morbidity and Mortality Cohort.
On ART Not on ART
Unadjusted Adjusted1 Unadjusted Adjusted2
All-Cause Mortality
<50 25.81 (19.94–33.42) 18.35 (13.24–25.43) 38.02 (21.12–68.44) 11.08 (5.31–23.12) 50–99 7.81 (5.80–10.52) 6.09 (4.38–8.47) 18.00 (10.22–31.67) 4.86 (2.34–10.09)
100–199 2.34 (1.76–3.09) 1.97 (1.47–2.64) 3.67 (2.02–6.66) 1.85 (0.91–3.74)
200–349 1.00 (reference) 1.00 (reference) 1.00 (reference) 1.00 (reference)
350–499 0.45 (0.30–0.66) 0.43 (0.28–0.64) 0.76 (0.40–1.43) 0.85 (0.42–1.67)
500 + 0.42 (0.28–0.63) 0.46 (0.31–0.70) 0.35 (0.15–0.81) 0.66 (0.30–1.46)
Slope (Square Root) -0.242±0.010 -0.218±0.013 -0.254±0.021 -0.147±0.027
Progression of Disease
<50 11.95 (9.85–14.49) 7.32 (5.79–9.25) 12.71 (8.49–19.03) 6.82 (4.28–10.87)
50–99 4.54 (3.66–5.62) 3.28 (2.60–4.13) 7.11 (4.74–10.68) 3.27 (1.99–5.38)
100–199 2.30 (1.93–2.73) 1.98 (1.65–2.37) 2.04 (1.46–2.87) 1.55 (1.08–2.23)
200–349 1.00 (reference) 1.00 (reference) 1.00 (reference) 1.00 (reference)
350–499 0.61 (0.49–0.77) 0.68 (0.54–0.86) 0.49 (0.35–0.69) 0.56 (0.39–0.79)
500 + 0.38 (0.29–0.49) 0.46 (0.35–0.59) 0.26 (0.16–0.41) 0.44 (0.28–0.69)
Slope (Square Root) -0.177±0.007 -0.139±0.008 -0.194±0.013 -0.133±0.016
Grade 4 Events
<50 6.98 (5.74–8.50) 5.01 (4.00–6.26) 9.21 (5.49–15.45) 8.50 (4.89–14.76)
50–99 3.08 (2.48–3.82) 2.44 (1.93–3.09) 4.21 (2.32–7.62) 3.08 (1.47–6.45)
100–199 1.65 (1.41–1.94) 1.47 (1.24–1.74) 1.86 (1.20–2.89) 1.74 (1.09–2.78)
200–349 1.00 (reference) 1.00 (reference) 1.00 (reference) 1.00 (reference)
350–499 0.84 (0.71–0.98) 0.86 (0.73–1.01) 0.86 (0.61–1.20) 0.93 (0.64–1.33)
500 + 0.87 (0.73–1.02) 0.90 (0.76–1.07) 0.55 (0.37–0.83) 0.73 (0.47–1.13)
Slope (Square Root) -0.093±0.007 -0.070±0.008 -0.127±0.015 -0.107±0.017
Death,POD,and Grade 4 Events
<50 10.73 (9.37–12.30) 7.43 (6.29–8.77) 13.79 (9.67–19.66) 8.08 (5.49–11.89)
50–99 4.10 (3.53–4.76) 3.19 (2.71–3.76) 6.99 (4.95–9.85) 3.48 (2.28–5.29)
100–199 1.94 (1.73–2.19) 1.71 (1.51–1.94) 2.12 (1.62–2.78) 1.67 (1.25–2.22)
200–349 1.00 (reference) 1.00 (reference) 1.00 (reference) 1.00 (reference)
350–499 0.71 (0.63–0.81) 0.75 (0.66–0.85) 0.66 (0.51–0.84) 0.72 (0.56–0.93)
500 + 0.64 (0.56–0.74) 0.70 (0.61–0.81) 0.38 (0.28–0.50) 0.57 (0.42–0.77)
Slope (Square Root) -0.147±0.006 -0.118±0.007 -0.181±0.011 -0.129±0.012
Notes:1Adjusted for age, gender, history of AIDS or TB, and time-updated viral load (<400, 400–999, 1000+).
2Adjusted for age, gender, history of AIDS or TB, and time-updated viral load (log10).
Table 5. Morbidity and Mortality Rates by Latest CD4 Count and ART Status and Relative Rates (ART vs No ART) by CD4 Count (cells/mm3): Mor-bidity and Mortality Cohort.
On ART Not on ART Relative Rate (ART vs No ART)
No. Events
Event Rate Per 100 PY
No. Events
Event Rate Per 100 PY
Unadjusted Adjusted1
All-Cause Mortality
<200 339 8.9 62 14.7 0.60 (0.46–
0.80)
0.92 (0.64–
1.32)
200–349 95 1.6 27 1.6 1.01 (0.66–
1.54)
0.85 (0.55–
1.33)
350–499 35 0.7 15 1.2 0.59 (0.32–
1.08)
0.56 (0.28–
1.15)
500 + 32 0.7 7 0.5 1.20 (0.53–
2.72)
1.03 (0.44–
2.43)
Total2 501 2.5 111 2.4 0.72 (0.58
–
0.90)
0.85 (0.66–
1.09) Progression of Disease
<200 652 17.1 137 32.5 0.52 (0.43–
0.64)
0.52 (0.42–
0.66)
200–349 280 4.6 141 8.1 0.57 (0.45–
0.71)
0.47 (0.37–
0.61)
350–499 142 2.8 51 4.0 0.71 (0.50–
1.02)
0.74 (0.50–
1.11)
500 + 86 1.8 27 2.1 0.84 (0.52–
1.36)
0.73 (0.44–
1.22)
Total2 1,160 5.9 356 7.6 0.58 (0.51
–
0.67)
0.55 (0.47–
0.64) Grade 4 Events
<200 652 17.1 75 17.8 0.98 (0.75–
1.28)
0.94 (0.70–
1.26)
200–349 408 6.7 102 5.9 1.17 (0.90–
1.50)
1.12 (0.86–
1.47)
350–499 283 5.7 63 5.0 1.14 (0.85–
1.54)
1.10 (0.80–
1.51)
500 + 292 6.0 42 3.3 1.83 (1.26–
2.64)
1.64 (1.12–
2.40)
Total2 1,635 8.3 282 6.0 1.20 (1.03
–
1.39)
1.15 (0.98–
1.34) Death,POD,and Grade 4
Events
<200 1,643 43.1 274 65.0 0.68 (0.57–
0.81)
0.73 (0.60–
0.88)
200–349 784 13.0 270 15.5 0.84 (0.71–
1.00)
0.75 (0.63–
0.90)
350–499 459 9.2 129 10.1 0.91 (0.72–
1.16)
0.91 (0.70–
1.18)
500 + 410 8.5 76 5.9 1.42 (1.07–
1.88)
1.28 (0.94–
1.73)
Total2 3,296 16.7 749 15.9 0.84 (0.76
–
0.94)
0.83 (0.74–
0.93)
Notes:1Adjusted for age, gender, and history of AIDS or TB. 2Unadjusted relative rates pooled within CD4 category.
events occurred among participants who were not taking ART (rate = 0.3 per 100 person years). The adjusted RR (ART/no ART) was 1.48 (95% CI: 0.78 to 2.79).
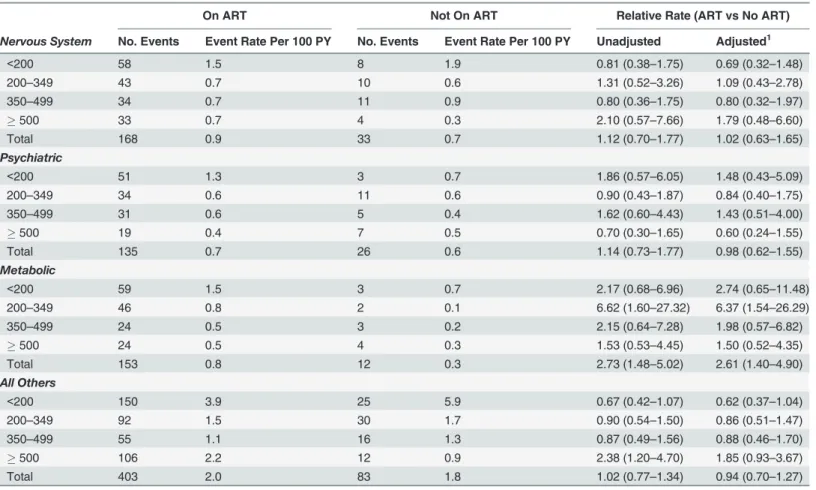
For 6 SOCs, over 100 events were reported. With the exception of events which were coded as metabolic events, the overall (pooled over CD4+ strata) differences between those on and not on ART were not significant. Among patients taking ART, 153 metabolic events occurred (rate = 0.8 per 100 person years) versus 12 events (rate = 0.3 per 100 person years) among par-ticipants not on ART (adjusted RR = 2.61; 95% 1.40–4.90). Among patients on ART the most common metabolic grade 4 events were diabetes (29 events), hyperlactacidemia (28),dehydra-tion (18), hyperglycemia (15), and lactic acidosis (13). The excess events among participants on ART compared to those not on ART was greatest at CD4+ counts<350 cells.
Discussion
We studied a large cohort of HIV positive participants in South Africa who were in the SANDF or who were a dependent of a SANDF member. Our main findings are: 1) death, POD and grade 4 event rates were markedly higher in the CD4+ count strata<200; 2) overall, and for
those on and not on ART, differences in mortality and serious morbidity between those with CD4+ count 350–499 and 500+ were small and not significant; and 3) the type of morbidity ex-perienced varied according to use of ART and latest CD4+ cell count.
Table 6. Grade 4 Event Types by Latest CD4 Count (cells/mm3) and ART Status: Morbidity and Mortality Cohort.
On ART Not On ART Relative Rate (ART vs No ART)
Serious Non-Aids Events No. Events Event Rate Per 100 PY No. Events Event Rate Per 100 PY Unadjusted Adjusted1
<200 35 0.9 3 0.7 1.36 (0.41–4.47) 3.65 (0.47–28.26)
200–349 22 0.4 4 0.2 1.68 (0.55–5.14) 1.96 (0.54–7.07)
350–499 16 0.3 2 0.2 1.99 (0.45–8.84) 1.23 (0.27–5.63)
500 16 0.3 5 0.4 0.84 (0.30–2.36) 0.64 (0.23–1.80)
Total 89 0.5 14 0.3 1.37 (0.77–2.45) 1.48 (0.78–2.79)
Infections
<200 130 3.4 18 4.3 0.81 (0.49–1.33) 0.82 (0.47–1.43)
200–349 69 1.1 19 1.1 1.03 (0.62–1.73) 1.00 (0.56–1.76)
350–499 42 0.8 12 0.9 0.86 (0.45–1.67) 0.78 (0.38–1.61)
500 38 0.8 5 0.4 1.99 (0.68–5.86) 2.33 (0.65–8.28)
Total 279 1.4 54 1.1 1.00 (0.74–1.36) 1.00 (0.71–1.40)
Gastro
<200 123 3.2 13 3.1 1.00 (0.56–1.82) 0.95 (0.49–1.86)
200–349 60 1.0 12 0.7 1.42 (0.70–2.90) 1.62 (0.70–3.73)
350–499 39 0.8 5 0.4 2.07 (0.81–5.28) 1.77 (0.65–4.80)
500 25 0.5 4 0.3 1.54 (0.53–4.48) 1.20 (0.42–3.43)
Total 247 1.3 34 0.7 1.37 (0.91–2.05) 1.34 (0.85–2.10)
Injuries
<200 46 1.2 1 0.2 5.06 (0.70–36.42) 4.19 (0.58–30.19)
200–349 47 0.8 14 0.8 0.96 (0.53–1.74) 0.95 (0.48–1.85)
350–499 44 0.9 10 0.8 1.12 (0.56–2.20) 1.14 (0.56–2.33)
500 36 0.7 2 0.2 4.73 (1.15–19.52) 5.02 (1.23–20.53)
Total 173 0.9 27 0.6 1.46 (0.97–2.18) 1.49 (0.96–2.30)
Notes:Relative rate estimates obtained using Poisson Regression
1
Adjusted for age, gender, and history of POD. Unadjusted relative rates for total pooled within CD4 category
Our finding is consistent with large cohorts from Western countries and from Africa and Asia [3–5,10–12]. Death rates and AIDS rates increased sharply the lower the latest CD4+ cell count. Risk gradients are evident among both ART-naïve participants and among those receiv-ing ART. In a competreceiv-ing risk regression analysis we found that the strength of the associations between latest CD4+ cell count and mortality and POD for those not on ART is overestimated particularly at lower latest CD4+ cell count levels. At higher counts (350+ cells), differences rel-ative to those with counts 200–349 cells are similar for the cause-specific hazard analysis and the competing risk analysis.
Data on the relationship of non-AIDS morbidity and latest CD4+ cell counts is more limit-ed. In the EuroSIDA cohort in which most participants were taking ART and who had a nadir CD4+ cell count of 178 cells, non-AIDS events that included malignancies, major CVD events, pancreatitis, major liver disease events and end-stage renal disease were associated with latest CD4+ cell count but the association was weaker than the association of latest CD4+ count and AIDS [14]. Also, in EuroSIDA, there was not a significant difference in non-AIDS rates for those with counts of 500 cells or higher versus those with counts 351–500 cells. In Phidisa, there were relatively few serious non-AIDS events, but with consideration of any grade 4 event, like EuroSIDA, CD4+ risk gradients were not as large as for AIDS. Also, at higher CD4+ counts, grade 4 event rates did not differ significantly between those with latest CD4+ counts of 500
Table 7. Rates of Grade 4 Event Types by Latest CD4 Count (cells/mm3) and ART Status: Morbidity and Mortality Cohort.
On ART Not On ART Relative Rate (ART vs No ART)
Nervous System No. Events Event Rate Per 100 PY No. Events Event Rate Per 100 PY Unadjusted Adjusted1
<200 58 1.5 8 1.9 0.81 (0.38–1.75) 0.69 (0.32–1.48)
200–349 43 0.7 10 0.6 1.31 (0.52–3.26) 1.09 (0.43–2.78)
350–499 34 0.7 11 0.9 0.80 (0.36–1.75) 0.80 (0.32–1.97)
500 33 0.7 4 0.3 2.10 (0.57–7.66) 1.79 (0.48–6.60)
Total 168 0.9 33 0.7 1.12 (0.70–1.77) 1.02 (0.63–1.65)
Psychiatric
<200 51 1.3 3 0.7 1.86 (0.57–6.05) 1.48 (0.43–5.09)
200–349 34 0.6 11 0.6 0.90 (0.43–1.87) 0.84 (0.40–1.75)
350–499 31 0.6 5 0.4 1.62 (0.60–4.43) 1.43 (0.51–4.00)
500 19 0.4 7 0.5 0.70 (0.30–1.65) 0.60 (0.24–1.55)
Total 135 0.7 26 0.6 1.14 (0.73–1.77) 0.98 (0.62–1.55)
Metabolic
<200 59 1.5 3 0.7 2.17 (0.68–6.96) 2.74 (0.65–11.48)
200–349 46 0.8 2 0.1 6.62 (1.60–27.32) 6.37 (1.54–26.29)
350–499 24 0.5 3 0.2 2.15 (0.64–7.28) 1.98 (0.57–6.82)
500 24 0.5 4 0.3 1.53 (0.53–4.45) 1.50 (0.52–4.35)
Total 153 0.8 12 0.3 2.73 (1.48–5.02) 2.61 (1.40–4.90)
All Others
<200 150 3.9 25 5.9 0.67 (0.42–1.07) 0.62 (0.37–1.04)
200–349 92 1.5 30 1.7 0.90 (0.54–1.50) 0.86 (0.51–1.47)
350–499 55 1.1 16 1.3 0.87 (0.49–1.56) 0.88 (0.46–1.70)
500 106 2.2 12 0.9 2.38 (1.20–4.70) 1.85 (0.93–3.67)
Total 403 2.0 83 1.8 1.02 (0.77–1.34) 0.94 (0.70–1.27)
Notes:Relative rate estimates obtained using Poisson Regression
1
Adjusted for age, gender, and history of POD. Unadjusted relative rates for total pooled within CD4 category
cells or higher versus those with counts 350–399 cells for either those on or not on ART. In Phidisa, the median CD4+ cell count at ART initiation was 143 cells, 25 cells lower than the EuroSIDA nadir CD4+ count.
The question about safe deployment primarily relates to those with CD4+ count above 350 cells so we focused many of our comparisons and our review of the literature on that group. Two large cohort studies have assessed the risk of death and AIDS at latest CD4+ cell counts above 350 cells. In a cohort study of ART-naïve participants enrolled at North American and European sites, death rates for participants with latest counts of 500–699 and 700+ cells were 23% and 34% lower than those with latest counts of 350–499 cells [29]. In a collaboration of European cohorts, that studied participants on ART with a suppressed viral load, rates of AIDS or death and of death were lower for those with latest counts greater than or equal to 500 cells as compared to 350–499. AIDS or death event rates were 0.52 and 0.79 per 1,000 person years for these two CD4+ strata; death rates were 0.24 and 0.38 per 1,000 person years, respectively [30]. In Phidisa, death rates were similar for those with latest CD4+ counts of 500 or higher as compared to those with counts 350–499 cells; however, the numbers of deaths in these strata were not large, particularly when further categorized by use of ART, and as a consequence, confidence intervals for the relative risks were wide both for the mortality cohort (95% CI: 0.70–1.46) and for the morbidity and mortality cohort (95% CI: 0.62–1.50). In the Phidisa mor-bidity and mortality cohort, POD (AIDS or pulmonary TB) rates were significantly lower for those with counts of 500 cells or higher compared to those with latest CD4+ counts 350–499; however, the absolute rate differences were small (3.1 versus 1.8, overall; 2.8 versus 1.8 for those on ART; and 4.0 versus 2.1 per 100 person years for those not on ART).
In resource-limited countries, there are fewer cohort studies that compare rates of mortality and AIDS among participants in latest CD4+ strata above 350 cells. Lewden summarized death rates by latest CD4+ cell count for ART-naïve participants enrolled in five cohorts in West Af-rica, and concluded that rates varied across cohorts, likely as a result of lost to follow-up differ-ences, and were higher than rates reported for high income countries [10]. In their study, rates of death were 3.0, 1.5, and 0.3 per 100 person years for those with latest CD4+ counts 201–350, 351–500, and 501+ cells/mm3, respectively. Overall, there were only 80 deaths in this study and for the upper two CD4+ strata there were only 23 and 7 deaths, respectively. Nevertheless, comparisons with two large European cohorts do suggest that CD4+ specific rates are higher in the West African study. In the CASCADE study, the rates (number of deaths) were 0.92 (47), 0.61 (50), and 0.37 (57) [11] for those with CD4+ count 200–349, 350–499, and 500+ cells, re-spectively; in the UK CHIC study, these rates (number of deaths) were 0.58 (46), 0.32 (30) and 0.18 (22) [5]. In the Phidisa mortality cohort, corresponding mortality rates (number of deaths) for ART-naïve participants were also greater than in CASCADE and UK CHIC and more simi-lar to the cohorts in West Africa. Death rates were 3.2 (131), 1.4 (40), and 1.1 (30) for those with latest CD4+ counts of 200–349, 350–499 and 500+ cells, respectively. For the morbidity and mortality cohort of Phidisa, these CD4+ specific mortality rates per 100 person years (number of deaths) were 1.6 (27), 1.2 (15), and 0.5 (7). The lower mortality rate for the morbid-ity and mortalmorbid-ity cohort compared to the mortalmorbid-ity cohort could be due to chance or to the greater availability and uptake of ART with time as has been described in other settings in Af-rica [31].
mortality rates were 2.0, 2.0, and 1.2 for those with latest CD4+ counts 300–399, 400–499, and 500+ cells, respectively [9]. Like Phidisa, in both of these cohorts ART was initiated for most participants at CD4+ counts<200 cells and the majority of deaths on ART occurred among
participants with latest CD4+ counts<200 cells. In the mortality cohort of Phidisa, death rates
(number of deaths) for those on ART with latest CD4+ counts of 200–349, 350–499, and 500+ cells were 1.6 (99), 0.7 (35), and 0.7 (33), respectively. The CD4+ specific death rates above 200 cells were similar for the morbidity and mortality cohort of Phidisa and for participants en-rolled in Phidisa 2 and for those who were not. However, in the lowest latest CD4+ count group (<50) considered, the death rate in Phidisa 2 was more than double that for participants
who were on ART but not in Phidisa 2. We attribute this to the fact that more participants with advanced HIV were enrolled in Phidisa 2; as previously reported, over one-half of the deaths during the trial occurred in the first 6 months of follow-up [25].
In Phidisa, latest CD4+ specific death rates were greater for those not on ART as compared to those on ART. In the CASCADE cohort, death rates on and not on ART according to latest CD4+ specific strata have been compared, and like the death rates for the Phidisa mortality co-hort, rates were lower for those on ART compared to those who were not on ART [11]. For participants in the Phidisa morbidity and mortality cohort, POD rates were lower for those on ART within each latest CD4+ count stratum; grade 4 rates tended to be higher. When only the upper two CD4+ strata were considered, the difference between the ART and no ART groups for the composite outcome were small and not significantly different from one another.
As described in other cohorts, morbidity at higher CD4+ counts is dominated by non-AIDS events [14,16–18,32]. Many of these events are more life-threatening than AIDS [19,27]. Non-AIDS events occur among participants with suppressed viral load and risk increases with advancing age [33]. The greater rate of grade 4 events as compared to AIDS event in Phidisa is most evident for those on ART. While the relative contributions of HIV and ART treatment for HIV to the risk of non-AIDS morbidity is uncertain and is currently being examined in a large clinical trial, it appears that chronic inflammation due to HIV, that remains present even with suppressive ART, as well as some ART, may be related to an increased risk of death and some serious non-AIDS conditions [34–38].
There are several strengths of our study. Foremost is the long-term follow-up of HIV partic-ipants for mortality, AIDS events and non-AIDS events. A second strength is the low lost to follow-up rate, particularly in the morbidity and mortality cohort. Several other studies have reported higher rates of lost to follow-up both for patients beginning ART and in pre-ART pro-grams [12,39–43]. This has been a major problem of many HIV treatment programs. We attri-bute the excellent follow-up in Phidisa to close, regular monitoring of performance at each site, the use of appointment reminders and the integration of HIV care at the SAMHS sites. A third strength is the ability to assess outcomes related to latest CD4+ cell counts during follow-up while on and not on ART in the same cohorts of participants as in the CASCADE study [11]. To our knowledge this is the only African cohort in which this has been possible to date.
A weakness is that for many of the POD events confirmatory diagnoses were not made. A second weakness is the composite outcome of death, POD or grade 4 events, includes events of varying severity. This is a general problem with composite outcomes. Future research will be aimed at understanding the risk of death of different POD and grade 4 events. Finally, the data available do not allow us to determine whether participants were soldiers in SANDF or their family members.
is a consequence of beginning ART very late, the type of ART used, or underlying conditions in the population.
Supporting Information
S1 Table. Enrollment characteristics of Phidisa HIV positive participants by protocol en-rollment: mortality cohort.
(DOCX)
S2 Table. Characteristics of Phidisa HIV positive participants by mortality status: morbidi-ty and mortalimorbidi-ty cohort.
(DOCX)
S3 Table. Mortality and Progression of Disease by Latest CD4+ Cell Count by Use of ART: A Comparison between a Cause-Specific Hazard and Competing Risk Proportional Haz-ards Regression Model.
(DOCX)
Acknowledgments
Authorship:The“first-last-author-emphasis”(FLAE) norm has been used in sequencing au-thors. We are thankful to L. Kondlo, M Dolan, P. Khabo, L.H. Mabuza, J. N. Dlamini, M. Polis, J.T. Mnisi, S. Orsega, P. Maja, L. Ledwaba, T. Molefe, P. Sangweni, L. Malan, G. Matchava, and G. Grandits, for their stimulating discussions, contributions and comments.
Executive Committee and OC’s office:The authors wish to thank past and present mem-bers of the Project Phidisa executive committee for their leadership of the project.
Phidisa HQ research staff and Clinical sites:The entire Phidisa staff (at HQ and research sites), as well as members of the SANDF and their dependents who devoted their time and ef-fort to this research project. Clindev, who provided regulatory monitoring, BARC (Bio Analyti-cal Research Corporation), who provided laboratory and personnel support, and the Henry Jackson Foundation, who provided project and personnel support, are also thanked.
Scientific Steering Committee:The authors also wish to thank past and present members of the Phidisa Scientific Steering Committee for guiding the Phidisa research agenda and the compilation of this study.
Author Contributions
Conceived and designed the experiments: PHM JDN. Analyzed the data: GG PK LK JDN. Wrote the paper: PHM MD LK HM JND MP T. Mnisi SO PM LL T. Molefe PS LM GM PK GG JDN.
References
1. Tawfik L., Kinoti S. The Impact of HIV/AIDS on the health workforce in developing countries- back-ground paper prepared for the World Health Report 2006—working together for health. WHO, 2006.
2. Phillips AN, Lundgren JD. The CD4 lymphocyte count and risk of clinical progression. Curr Opin HIV AIDS 2006; 1:43–49. doi:10.1097/01.COH.0000194106.12816.b1PMID:19372783
3. Collaboration CASCADE. Short-term risk of AIDS according to current CD4 cell count and viral load in antiretroviral drug-naïve individuals and those treated in the monotherapy era. AIDS 2004; 18: 51–58. PMID:15090829
6. Losina E, Yazdanpanah Y, Deuffic-Burban S, Wang B, Wolf LL, Messou E, et al. The independent ef-fect of highly active antiretroviral therapy on severe opportunistic disease incidence and mortality in HIV-infected adults in Cote d”Ivoire. Antiviral Therapy 2007; 12: 543–551. PMID:17668563
7. Deuffic-Burban S, Losina E, Wang B, Gabillard D, Messou E, Divi N, et al. Estimates of opportunistic in-fection incidence or death within specific CD4 strata in HIV-infected patients in Abidjan, Cote d’Ivoire: impact of alternative methods of CD4 modelling. Eur J Epidemiol 2007; 22: 737–744. PMID:17828437 8. Dunn D, Woodburn P, Duong T, Peto J, Phillips A, Gibb D, et al. Current CD4 cell count and the
short-term risk of AIDS and death before the availability of effective antiretroviral therapy in HIV-infected chil-dren and adults. J Infect Dis 2008; 197: 398–404. doi:10.1086/524686PMID:18248303
9. Lawn SD, Little F, Bekker LG, Kaplan R, Campbel E, Orrell C, et al. Changing mortality risk associated with CD4 cell response to antiretroviral therapy in South Africa. AIDS 2009; 23: 335–342. doi:10.1097/ QAD.0b013e328321823fPMID:19114870
10. Lewden C, Gabillard D, Minga A, Ekouévi DK, Avit D, Konate I, et al. CD4-specific mortality rates among HIV-infected adults with high CD4 counts and no antiretroviral treatment in West Africa. J Acquir Immune Defic Syndr 2012; 59: 213–219. doi:10.1097/QAI.0b013e31823b837ePMID:22027874 11. Babiker AG, Emery S, Fätkenheuer G, Gordin FM, Grund B, Lundgren JD, et al. Considerations in the
rationale, design and methods of the Strategic Timing of AntiRetroviral Treatment (START) study. Clin Trials 2013; 10 (1 Suppl): S5–S36. doi:10.1177/1740774512440342PMID:22547421
12. Gabillard D, Lewden C, Ndoye I, Moh R, Segeral O, Tonwe-Gold B, et al. Mortality, AIDS-morbidity, and loss to follow-up by current CD4 cell count among HIV-1-infcted adults receiving antiretroviral ther-apy in Africa and Asia: data from the ANRS 12222 Collaboration. J Acquir Immune Defic Syndr 2013; 62:555–561. doi:10.1097/QAI.0b013e3182821821PMID:23274931
13. Belloso W, Orellana LC, Grinsztejn B, Madero JS, La Rosa A, Veloso VG, et al. Analysis of serious non-AIDS events among HIV-infected adults in Latin American sites. HIV Med 2010; 11: 554–564. doi:
10.1111/j.1468-1293.2010.00824.xPMID:20345879
14. Mocroft A, Reiss P, Gasiorowski J, Ledergerber B, Kowalska J, Chiesi A, et al. Serious fatal and nonfa-tal non-AIDS defining illnesses in Europe. J Acquir Immune Defic Syndr 2010; 55: 262–270. doi:10. 1097/QAI.0b013e3181e9be6bPMID:20700060
15. Wester CW, Koethe JR, Shepherd BE, Stinnette SE, Rebeiro PF, Kipp AM, et al. Non-AIDS-defining events among HIV-1-infected adults receiving combination antiretroviral therapy in resource-replete versus resource-limited urban setting. AIDS 2011; 25: 1471–1479. doi:10.1097/QAD.
0b013e328347f9d4PMID:21572309
16. Reekie J, Gatell JM, Yust I, Bakowska E, Rakhmanova A, Losso M, et al. Fatal and nonfatal AIDS and non-AIDS events in HIV-1-positive individuals with high CD4 cell counts according to viral load strata. AIDS 2011; 25: 2259–2268. doi:10.1097/QAD.0b013e32834cdb4bPMID:21918422
17. Lucera C, Torres B, León A, Calvo M, Leal L, Pérez I, et al. Rate and predictors of non-AIDS events in a cohort of HIV-infected patients with a CD4 T cell count above 500 cells/mm3. AIDS Res Hum
Retrovi-ruses 2013; 29: 1161–1167. doi:10.1089/AID.2012.0367PMID:23530980
18. Phillips AN, Neaton J, Lundgren JD. The role of HIV in serious diseases other than AIDS. AIDS 2008; 22: 2409–2418. doi:10.1097/QAD.0b013e3283174636PMID:19005264
19. Neuhaus J, Angus B, Kowalska JD, La Rosa A, Sampson J, Wentworth D, et al. Risk of All-cause Mor-tality Associated with Non-fatal AIDS and Serious Non-AIDS Events among Adults Infected with HIV. AIDS 2010; 24:, 697–706. doi:10.1097/QAD.0b013e3283365356PMID:20177360
20. Anglaret X, Minga A, Gabillard D, Ouassa T, Messou E, Morris B, et al. AIDS and non-AIDS morbidity and mortality across the spectrum of CD4 cell counts in HIV-infected adults before starting antiretroviral therapy in Cóte d’Ivoire. Clin Infect Dis 2012; 54:714–723. doi:10.1093/cid/cir898PMID:22173233 21. De Cock KM, El-Sadr W. When to start ART in Africa—an urgent research priority. N Engl J Med 2013;
368:886–889. doi:10.1056/NEJMp1300458PMID:23425131
22. Rosen S, Fox MP, Gill CJ. Patient retention in antiretroviral therapy programmes in Sub-Saharan Africa: a systematic review. PLoS Med 2007; 4:e298. PMID:17941716
23. Brinkhof MWG, Spycher BD, Yiannoutsos C, Weigel R, Wood R, Messou E, et al. Adjusting mortality for loss to follow-up: analysis of five ART programmes in sub-Saharan Africa. PLoS One 2010; 5(11): e14149. doi:10.1371/journal.pone.0014149PMID:21152392
24. Brennan AT, Maskew M, Sanne I, Fox MP. The interplay between CD4 cell count, viral load suppres-sion and duration of antiretroviral therapy on mortality in a resource-limited setting. Trop Med Int Health 2013; 18: 619–631. doi:10.1111/tmi.12079PMID:23419157
25. The Phidisa II Writing Team for Project Phidisa. A Randomized Factorial Trial Comparing 4 Treatment Regimens in Treatment-Naive HIV-Infected Persons with AIDS and/or a CD4 Cell Count<200 Cells/μL
26. National Department of Health. Clinical Guidelines for the Management of HIV & AIDS in Adults and Adolescents. National Department of Health. South Africa, 2010.
27. Preisser JS, Qaqish BF. Deletion diagnostics for generalised estimating equations. Biometrika 1996. 83:551–562.
28. Fine JP, Gray RJ. A proportional hazards model for the subdistribution of a competing risk. J Am Stat Assoc 1999; 94: 496–509.
29. Study Group on Death Rates at High CD4 Count in Antiretroviral Naïve Patients. Death rates in
HIV-positive antiretroviral-naïve patients with CD4 count greater than 350 cells perμL in Europe and North
America: a pooled cohort observational study. Lancet 2010; 376: 340–345. doi:10.1016/S0140-6736 (10)60932-4PMID:20638118
30. The Opportunistic Infections Project Team of the Collaboration of Observational HIV Epidemiological Research in Europe (COHERE) in EuroCoord. CD4 cell count and the risk of AIDS or death in HIV-in-fected adults on combination antiretroviral therapy with a suppressed viral load: a longitudinal cohort study from COHERE. PloS Med 2012; 9(3): e1001194. doi:10.1371/journal.pmed.1001194PMID:
22448150
31. Floyd S, Marston M, Baisley K, Wringe A, Herbst K, Chihana M, et al. The effect of antiretroviral therapy provision on all-cause, AIDS and non-AIDS mortality at the population level—a comparative analysis of data from four setting in Southern and East Africa. Trop Med Int Health 2012; 17:E84–E93. doi:10. 1111/j.1365-3156.2012.03032.xPMID:22943383
32. Reisler RB, Han C, Burman WJ, Tedaldi EM, Neaton JD. Grade 4 events are as important as AIDS events in the era of HAART. J Acquir Immune Defic Syndr 2003; 34: 379–386. PMID:14615655 33. Miller CJ, Baker JV, Bormann AM, Erlandson KM, Huppler Hullsiek K, Justice AC, et al. Adjudicated
morbidity and mortality outcomes by age among individuals with HIV infection on suppressive antiretro-viral therapy. PLoS One 2014 Apr 11; 9(4):e95061. doi: 10.1371 PMID:24728071
34. Neuhaus J, Jacobs DR Jr., Baker JV, Calmy A, Duprez D, La Rosa A, et al. Markers of inflammation, coagulation, and renal function are elevated in adults with HIV infection. J Infect Dis 2010; 201 (12):1788–95. doi:10.1086/652749PMID:20446848
35. DAD Study Group, Friis-Moller N, Reiss P, Sabin CA, Weber R, Monforte A, et al. Class of antiretroviral drugs and the risk of myocardial infarction. N Engl J Med 2007; 356(17):1723–35. PMID:17460226 36. Kuller LH, Tracy R, Belloso W, De Wit S, Drummond F, Lane HC, et al. Inflammatory and coagulation
biomarkers and mortality in patients with HIV infection. PLoS Med 2008; 5(10):e203. doi: 10.1371 PMID:18942885
37. Duprez DA, Neuhaus J, Kuller LH, Tracy R, Belloso W, De Wit S, et al. Inflammation, Coagulation and Cardiovascular Disease in HIV-Infected Individuals. PLoS One 2012; 7(9):e44454. doi: 10.1371 PMID:
22970224
38. Borges AH, Silverberg MJ, Wentworth D, Grulich AE, Fätkenheuer G, Mitsuyasu R, et al. Predicting risk of cancer during HIV infection: the role of inflammatory and coagulation markers. AIDS 2013; 27: 433–
441.
39. Brinkhoff MWG, Dabis F, Myer L, Bangsberg DR, Boulle A, Nash D, et al. Early loss of HIV-infected pa-tients on potent antiretroviral therapy programmes in lower-income countries. Bull World Health Organ 2008; 86: 559–567. PMID:18670668
40. Brinkhoff MWG, Pujades-Rodriguez M, Egger M. Mortality of patients lost to follow-up in antiretroviral treatment programmes in resource-limited settings: systematic review and meta-analysis. PLoS One 2009; 4(6): e5790. doi: 10.1371 PMID:19495419
41. May M, Boulle A, Phiri S, Messou E, Myer L, Wood R, et al. Prognosis of patients with HIV-1infection starting antiretroviral therapy in sub-Saharan Africa: a collaborative analysis of scale-up programmes. Lancet 2010: 376: 449–457. doi:10.1016/S0140-6736(10)60666-6PMID:20638120
42. Van Cutsem G, Ford N, Hildebrand K, Goemaere E, Mathee S, Abrahams M, et al. Correcting for mor-tality among patients lost to follow up on antiretroviral therapy in South Africa: a cohort analysis. PLoS One 2011; 6(2):e14684. doi: 10.1371 PMID:21379378
43. Hassan AS, Fielding KL, Thuo NM, Nabwera HM, Sanders EJ, Berkley JA. Early loss to follow-up of re-cently diagnosed HIV-infected adults from routine pre-ART care in a rural district hospital in Kenya: a cohort study. Trop Med Int Health 2012; 17:82–93. doi:10.1111/j.1365-3156.2011.02889.xPMID: