Efficacy of Berberine in Patients with
Non-Alcoholic Fatty Liver Disease
Hong-Mei Yan1☯, Ming-Feng Xia1☯, Yan Wang2, Xin-Xia Chang1, Xiu-Zhong Yao3,
Sheng-Xiang Rao3, Meng-Su Zeng3, Yin-Fang Tu4, Ru Feng2, Wei-Ping Jia4, Jun Liu5, Wei Deng6, Jian-Dong Jiang2*, Xin Gao1*
1Department of Endocrinology and Metabolism, Zhongshan Hospital, Fudan University, Shanghai, 200032, China,2Institute of Materia Medica, Chinese Academy of Medical Sciences, and Peking Union Medical College, Beijing, 100050, China,3Department of Radiology, Zhongshan Hospital, Fudan University, Shanghai, 200032, China,4Department of Endocrinology and Metabolism, The Sixth People’s Hospital, Shanghai Jiaotong University, Shanghai, 200233, China,5Department of Endocrinology and Metabolism, The Fifth People’s Hospital, Fudan University, Shanghai, 200240, China,6School of public health, Fudan University, Shanghai, 200032, China
☯These authors contributed equally to this work.
*[email protected](XG); [email protected](JJ)
Abstract
Objectives
A randomized, parallel controlled, open-label clinical trial was conducted to evaluate the effect of a botanic compound berberine (BBR) on NAFLD.
Methods
A randomized, parallel controlled, open-label clinical trial was conducted in three medical centers (NIH Registration number: NCT00633282). A total of 184 eligible patients with NAFLD were enrolled and randomly received (i) lifestyle intervention (LSI), (ii) LSI plus pio-glitazone (PGZ) 15mg qd, and (iii) LSI plus BBR 0.5g tid, respectively, for 16 weeks. Hepatic fat content (HFC), serum glucose and lipid profiles, liver enzymes and serum and urine BBR concentrations were assessed before and after treatment. We also analyzed hepatic BBR content and expression of genes related to glucose and lipid metabolism in an animal model of NAFLD treated with BBR.
Results
As compared with LSI, BBR treatment plus LSI resulted in a significant reduction of HFC (52.7% vs 36.4%, p = 0.008), paralleled with better improvement in body weight, HOMA-IR, and serum lipid profiles (all p<0.05). BBR was more effective than PGZ 15mg qd in reducing body weight and improving lipid profile. BBR-related adverse events were mild and mainly occurred in digestive system. Serum and urine BBR concentrations were 6.99ng/ml and 79.2ng/ml, respectively, in the BBR-treated subjects. Animal experiments showed that BBR located favorably in the liver and altered hepatic metabolism-related gene expression.
OPEN ACCESS
Citation:Yan H-M, Xia M-F, Wang Y, Chang X-X, Yao X-Z, Rao S-X, et al. (2015) Efficacy of Berberine in Patients with Non-Alcoholic Fatty Liver Disease. PLoS ONE 10(8): e0134172. doi:10.1371/journal. pone.0134172
Editor:Jianping Ye, Pennington Biomedical Research Center, UNITED STATES
Received:March 17, 2015
Accepted:June 26, 2015
Published:August 7, 2015
Copyright:© 2015 Yan et al. This is an open access article distributed under the terms of theCreative Commons Attribution License, which permits unrestricted use, distribution, and reproduction in any medium, provided the original author and source are credited.
Data Availability Statement:Data are uploaded to Figshare at the following DOIs:http://dx.doi.org/10. 6084/m9.figshare.1434011;http://dx.doi.org/10.6084/ m9.figshare.1434010;http://dx.doi.org/10.6084/m9. figshare.1434009.
Conclusion
BBR ameliorates NAFLD and related metabolic disorders. The therapeutic effect of BBR on NAFLD may involve a direct regulation of hepatic lipid metabolism.
Trial Registration
ClinicalTrials.govNCT00633282
Introduction
Non-Alcoholic Fatty Liver Disease (NAFLD) is characterized by hepatic fat accumulation, insulin resistance and usually impaired glucose and lipid metabolism, which is currently a lead-ing cause of chronic liver diseases [1]. It has been a significant health problem that affects 20– 30% of the general population, among whom 5–20% developed liver cirrhosis during a 10-year period [2]. Besides, NAFLD predicts both type 2 diabetes (T2DM) and cardiovascular diseases [3], and the metabolic complex of NAFLD has attracted extensive attentions [4]. Several phar-macologic interventions have been attempted to treat NAFLD, and the agents targeting insulin resistance such as thiazolidinediones [5,6,7] have yielded promising results.
Berberine (BBR) is an active single compound isolated from Rhizoma Coptidis with a well-defined chemical structure. Recently, several studies from both clinic [8,9] and laboratory [10,11,12] reported that BBR had antidiabetic and antihyperlipidemic effects. Zhang Y et al. demonstrated that BBR had a robust glucose-lowering effect, accompanying with a signifi-cantly increase of glucose disposal rate through a randomized, double-blind, and placebo-con-trolled clinical trial [13]. Insulin resistance is frequently associated with hyperglycemia and dyslipidemia, and the ectopic liver fat accumulation played a key role in the development of insulin resistance [14]. In our previous study, BBR significantly decreased hepatic fat content (HFC) in high fat diet induced rats of NAFLD by reducing methylation of the MTTP promoter [15]. Therefore, we speculate that BBR may reverse many of the metabolic abnormalities asso-ciated with NAFLD by reducing the HFC. However, the effects and underlying mechanisms of BBR on hepatic steatosis and its associated metabolic abnormalities have never been investi-gated in patients with NAFLD.
In the present study, we carried out a randomized, multicenter, controlled, open-label clini-cal trial to investigate the efficacy and safety of BBR in NAFLD patients, and also explore the mechanism of BBR’s effect in an animal model of NAFLD.
Methods
Patients
A randomized, parallel controlled, open-label clinical trial was conducted in three medical cen-ters for treating NAFLD patients with impaired glucose regulation (IGR) or T2DM with LSI in combination with pioglitazone (PGZ) or BBR in three centers (NIH Registration number: NCT00633282). The trial design conformed to the revised CONSORT standards for reporting randomized trials (S1 CONSORT Checklist). A schematic flow chart of the trial design is pre-sented inS1 Fig. The planned sample size was 180 subjects, with equal assignment to each of the three study groups (60 per group). We estimated that with this sample size, the would have 90% power to detect an absolute difference in the value of HFC reduction of 7%, with a two-tailed type 1 error of 0.025.
(07JC14011 to Gao X.), the National Ministry of Education Program (985 III-YFX0302 to Gao X.) and Shanghai Municipal Health Bureau Foundation (12GWZX0103 to Gao X.), National Natural Science Foundation of China for Young Scholar (81200627 to Yan HM., 81100602 to Chang XX., 81300682 to Xia MF.), Foundation of Fudan University, China (20520133483 to Yan HM., 20520133383 to Chang XX.).
Competing Interests:The authors have declared
Eligible adults were identified and recruited from unsolicited referrals to the three participat-ing clinical centers from March 2008 to August 2011. Hepatic fat content (HFC) was assessed by a proton magnetic resonance spectroscopy (1H MRS) [16], and patients with a more than 13% HFC were enrolled in the study. Impaired glucose metabolism including IGR or T2DM was defined by fasting plasma glucose (FPG) value5.6 mmol/L and/or 2 hour postload plasma glucose (PPG) following a 75-g oral glucose challenge7.8 mmol/L. The course of T2DM should be less than 1 year for T2DM patients. Subjects were excluded if they had alcohol consumption10 g/d for women and20 g/d for men [17], positive for hepatitis B or C, or had other liver diseases. Patients who were treated with the following drugs within 4 weeks before enrollment were also excluded from the study, including hypoglycemic or lipid-regulat-ing (statins, fibrates) drugs, the drugs that may impact hepatic fat content (e.g. silybin, urso-deoxycholic acid, bicyclol, phosphatidylcholine and vitamin E) and Chinese herbs. For safety concern, those with severe metabolic abnormalities and organ dysfunction were excluded, for example, HbA1c>7.5%, serum triglyceride5.0 mmol/L, ALT or AST2 times upper limit of normal, serum creatinine i 1.5 mg/dL (133μmol/L) and blood pressure160/100 mmHg in receiving lifestyle therapy and anti-hypertensive drugs. The study was approved by the ethics committee of Zhongshan Hospital, Fudan University and was conducted in accordance with the guidelines of the Declaration of Helsinki, and the Committee was in charge of monitoring the results quarterly to ensure patients’safety and review of the therapeutic efficacy. Written informed consent was obtained from all patients.
Study Design
Subjects who met all enrollment criteria were randomly assigned to one of the three groups for the 16-weeks clinical trial, Group A- LSI, Group B- LSI plus PGZ (15 mg q.d.) and Group C-LSI plus BBR (0.5 g, t.i.d.). BBR (berberine, Huashi Pharmaceuticals Shanghai, China, Inc.) was administered orally at a dosage of 0.5 g 30 minutes before meal, three times a day (accord-ing to the Chinese Pharmacopeia [18]). The computer-generated random allocation sequence was obtained independently by the statistician from School of public health, Fudan University, Shanghai, China. Research investigators randomized participants to one of the three arms. LSI (including dietary modification and exercise) was conducted following the standardized rec-ommendation [19]. The daily dietary before entering the study were comparable among the three groups, and all of the participants were required to take the calorie limited-diet by sub-tracting 500 kcal from the mean daily calorie intake and achieve more than 150 min per week medium intensity aerobic exercise. The primary outcome was the decrease in HFC detected by 1H MRS; and the secondary outcomes included improvement in body weight, oral glucose
concentrations of BBR and its metabolites were measured by LC-MS/MS as described in detail previously [20].
Measurement of liver fat content using
1H-MRS
LFCs were by1H-MRS using a 1.5T magnetic resonance (MR) scanner (Siemens Avanto, Erlangen, Germany) equipped for proton spectroscopy acquisitions. Sagittal, coronal, and axial slices covering the whole liver were preliminarily acquired for positioning of the spectroscopy acquisition voxel. A single voxel of 8cm3(2 × 2 × 2 cm) was placed within the right lobe avoiding major vascular structures and subcutaneous fat tissue. The proton spectrum was acquired using the body coil after shimming over the volume of interest by means of a point-resolved spectros-copy (PRESS) sequence with the following parameters: repetition time = 1500milliseconds, echo time = 135milliseconds. Signal intensities of water peak at 4.8ppm (Sw) and the fat peak at 1.4ppm(Sf) were measured and hepatic fat percentage was calculated using the formula 100×Sf/ (Sf+Sw), as described by our group previously [21].
Animals Study
Thirty six healthy male SD rats (5–6 weeks old) weighing 190–210 gram were obtained from the Animal Development Center, Chinese Academy of Sciences, Shanghai. All rats were given free access to food and water, maintained on a 12/12-h light/dark cycle and received a high-fat diet (32.6% carbohydrate, 51.0% fat, 16.4% protein calories) for 6 weeks to establish the HFD-induced NAFLD model. BBR was purchased from Sigma-Aldrich (MO, USA), and adminis-trated at a single dose of 200mg/kg to the HFD-induced rat of NAFLD. The rats were sacrificed by cervical dislocation, and serum and liver tissue samples were collected at 0, 4, 8, 12, 24 and 48h, respectively (n = 6 for each time point), after oral administration of single-dose BBR, which was the most commonly used dose for animal studies [11,12]. All samples were stored at -80°C. Quantitative analysis of BBR and its metabolites in blood and urine were done with the method described [22]. The frozen tissue was used for preparation of mRNA and complemen-tary DNA for use in real-time quantitative polymerase-chain-reaction (PCR) analysis, and the details and the sequences of the primers used in this study are listed inS1 Text; Protein was also extracted from the frozen tissue, and its abundance was quantified through Western Blot Analysis. The antibodies used for immunoblotting included anti-MTTP (Bioworld), anti-Glu-cokinase (Proteintech), and anti- CPT1α(Proteintech). BBR and its metabolites in the liver tis-sue were quantified using a shimadzu triple-quadruple MS (LC–MS/MS 8040; Shimadzu Corporation, Kyoto Japan) (S1 Text). The animal study design conformed to the NC3Rs ARRIVE Guideline (S1 ARRIVE Checklist). All experimental procedures involving the use of animals were conducted in conformity with PHS policy and were approved by the Animal Use and Care Committee of Fudan University.
Statistical Analysis
study, all the data are given as mean±s.e.m. Comparisons among different time points after BBR administration were assessed by mixed effect linear model, and Bonferroni correction was used for pairwise comparisons. A p-value<0.05 was considered statistically significant.
Results
Study subjects
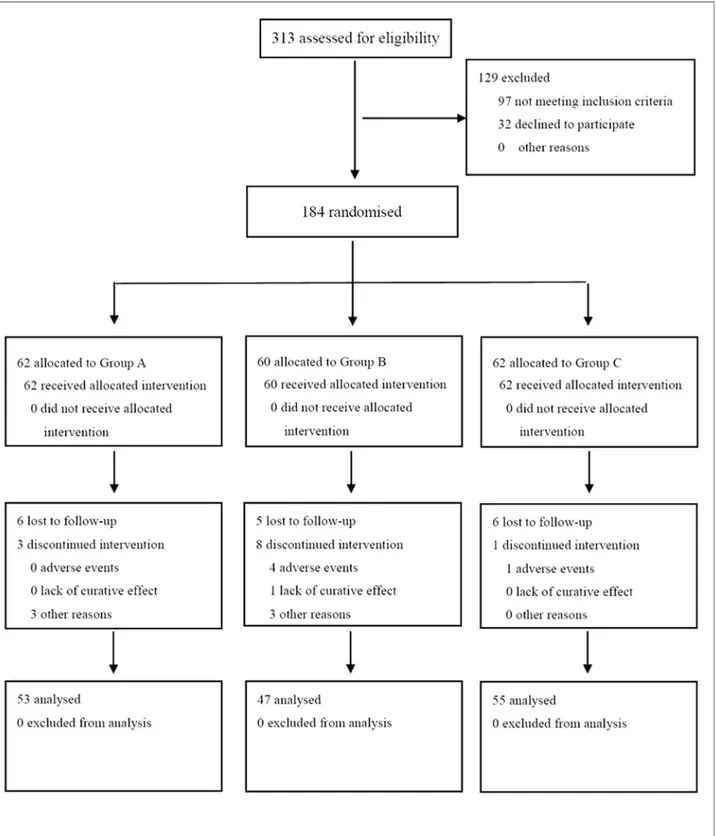
A total of more than 313 subjects were initially enrolled for the study between March 2008 and April 2011. After clinical assessment, total 184 subjects were identified to participate the trial, of which 62 were assigned to receive LSI alone, 60 for LSI plus pioglitazone, and 62 for LSI plus BBR at randomization (Fig 1). The three groups were well matched in respect to demographic profiles, HFC and other baseline characteristics (Table 1). At the end of the trial, 53, 47 and 55 patients completed their follow-up visits, respectively (Fig 1). Compliance with the lifestyle intervention and study medications was over 90% in all groups (S1 Table).
Hepatic fat content and liver enzymes
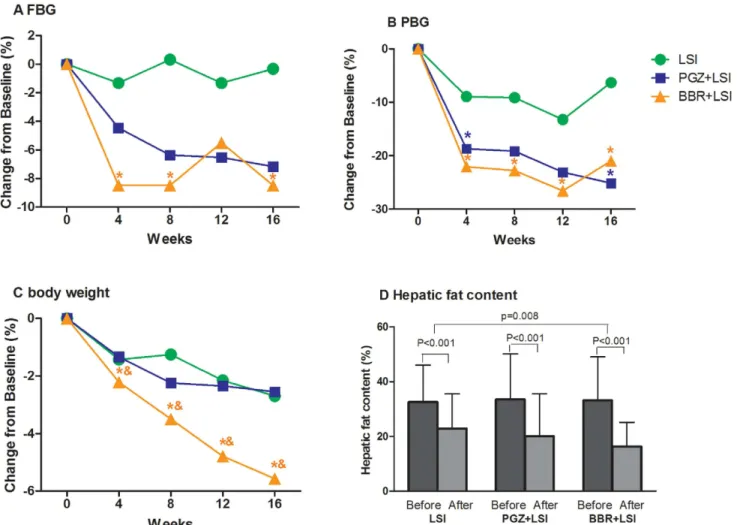
After treatment, HFC decreased by 57.2% in the LSI plus BBR group (P<0.001) and by 36.4%
in the LSI group (P<0.001). Treatment with LSI plus BBR caused more reduction of HFC as
compared to that with LSI alone (p = 0.008,Fig 2). Moreover, the effect of BBR on HFC was no smaller than that of PGZ (15mg per day) (p = 0.054) [23]. Liver enzymes were also reduced in all groups after treatment, and the reduction of ALT and AST showed no significant difference between the LSI plus BBR and LSI plus PGZ groups at the 16thweek (p = 0.855 and p = 0.632, respectively) (Table 2).
Responses in energy metabolism
In comparison with LSI alone, BBR exhibited extra decreases in body weight [-4.29(-5.04 –-3.54)kg vs -1.99(-2.76–-1.23)kg, p<0.001], BMI [-1.51(-1.79–-1.25)kg/m2vs -0.72(-0.99
–-0.44) kg/m2, p<0.001], waist circumference[-4.84(-5.70–-3.97)cm vs -2.14(-3.03–-1.26)cm,
p<0.001], HFC [-17.4(-20.8–-14.0)% vs -11.4(-14.8–-7.9)%, p = 0.008), 2h postload glucose
[-2.19(-2.87–-1.51)mmol/L vs -1.05(-1.73–-0.37)mmol/L, p = 0.020), area under the OGTT curve [-6.14(-7.72–-4.55) vs -3.33(-4.93–-1.73), p = 0.015], HOMA-IR [-1.06(-1.51–-0.61) vs -0.26(-0.72–0.20), p = 0.014], serum cholesterol [-0.52(-0.71–-0.33)mmol/L vs -0.12(-0.31– 0.07)mmol/L, p = 0.004], APO-B [-0.12(-0.16–-0.08)g/L vs -0.05(-0.09–0.01)g/L, p = 0.022] and triglycerides [-0.45(-0.68–-0.23)mmol/L vs -0.02(-0.24–0.21)mmol/L, p = 0.007](Table 2), showing clearly a significant benefit of BBR in metabolism. The blood glucose reduction in LSI plus BBR group occurred in the first 4 weeks of treatment and was sustained throughout the trial; a remarkable and time-dependent decrease of body weight was also observed in this group (Fig 2). As compared with the PGZ plus LSI group (the positive reference of the study), BBR plus LSI showed comparable effects in control of blood glucose and insulin sensitivity, whereas BBR has additional benefits in body weight and serum lipids (Table 2).
Adverse Events
Fig 1. CONSORT Flow Diagram.184 subjects were assigned to receive lifestyle intervention alone (n = 62), lifestyle intervention plus pioglitazone (n = 60), and lifestyle intervention plus berberine (n = 62). At the end of therapy, 53, 47 and 55 subjects in the three groups completed the follow-up visit, respectively.
fatigue, and cardiac symptoms (S2 Table). Owing to the AEs four patients discontinued the treatment with PGZ and one with BBR.
Serum and urine BBR concentrations
Eleven subjects from the LSI plus BBR group and eleven subjects from the LSI group were ran-domly selected for measurement of concentrations of serum and urine BBR and its metabolites before and after the 16-week intervention. At the end of 16-week treatment, the median levels of BBR in serum and urine were 6.99ng/ml and 79.2ng/ml, respectively, in the BBR-treated subjects (Table 3), whose baseline BBR concentrations were not detectable. In contrast, BBR was also not detectable before and after the intervention in LSI group. Urine analysis showed
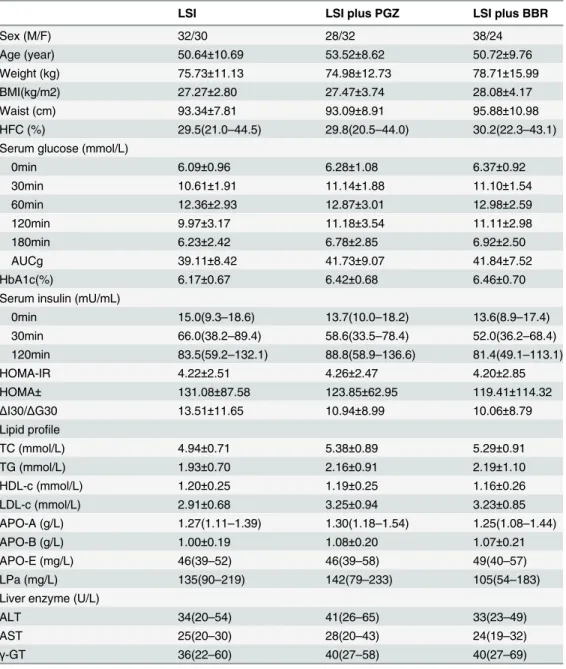
Table 1. Baseline Characteristics of the Study Subjects. The data were presented as the mean±SD,
except for skewed variables, which were presented as the median with the interquartile range given in parentheses.
LSI LSI plus PGZ LSI plus BBR
Sex (M/F) 32/30 28/32 38/24
Age (year) 50.64±10.69 53.52±8.62 50.72±9.76
Weight (kg) 75.73±11.13 74.98±12.73 78.71±15.99
BMI(kg/m2) 27.27±2.80 27.47±3.74 28.08±4.17
Waist (cm) 93.34±7.81 93.09±8.91 95.88±10.98
HFC (%) 29.5(21.0–44.5) 29.8(20.5–44.0) 30.2(22.3–43.1) Serum glucose (mmol/L)
0min 6.09±0.96 6.28±1.08 6.37±0.92
30min 10.61±1.91 11.14±1.88 11.10±1.54
60min 12.36±2.93 12.87±3.01 12.98±2.59
120min 9.97±3.17 11.18±3.54 11.11±2.98
180min 6.23±2.42 6.78±2.85 6.92±2.50
AUCg 39.11±8.42 41.73±9.07 41.84±7.52
HbA1c(%) 6.17±0.67 6.42±0.68 6.46±0.70
Serum insulin (mU/mL)
0min 15.0(9.3–18.6) 13.7(10.0–18.2) 13.6(8.9–17.4)
30min 66.0(38.2–89.4) 58.6(33.5–78.4) 52.0(36.2–68.4) 120min 83.5(59.2–132.1) 88.8(58.9–136.6) 81.4(49.1–113.1)
HOMA-IR 4.22±2.51 4.26±2.47 4.20±2.85
HOMA± 131.08±87.58 123.85±62.95 119.41±114.32
ΔI30/ΔG30 13.51±11.65 10.94±8.99 10.06±8.79
Lipid profile
TC (mmol/L) 4.94±0.71 5.38±0.89 5.29±0.91
TG (mmol/L) 1.93±0.70 2.16±0.91 2.19±1.10
HDL-c (mmol/L) 1.20±0.25 1.19±0.25 1.16±0.26
LDL-c (mmol/L) 2.91±0.68 3.25±0.94 3.23±0.85
APO-A (g/L) 1.27(1.11–1.39) 1.30(1.18–1.54) 1.25(1.08–1.44)
APO-B (g/L) 1.00±0.19 1.08±0.20 1.07±0.21
APO-E (mg/L) 46(39–52) 46(39–58) 49(40–57)
LPa (mg/L) 135(90–219) 142(79–233) 105(54–183)
Liver enzyme (U/L)
ALT 34(20–54) 41(26–65) 33(23–49)
AST 25(20–30) 28(20–43) 24(19–32)
γ-GT 36(22–60) 40(27–58) 40(27–69)
that BBR was mainly excreted as its prototype with concentrations ranging from 4.49 ng/mL to 645.48 ng/mL. Although five BBR metabolites (M1, M2, M4, M12, M13) were detected in urine of the patients, all of the metabolites showed very low concentrations raging from 0.01 to 10.15 ng/mL (approximately 70-fold lower than BBR). All the results indicated that the botanic compound BBR was well absorbed, metabolized and excreted mainly as its prototype from the urine.
BBR and Its Metabolites in liver after Oral Administration in Animal
Model
It is noticeable that Subjects at the BBR plus LSI group lost significantly more hepatic fat con-tent than the LSI group with the same degree of body weight loss (Fig 3), which indicated that the benefits of BBR on NAFLD and its related metabolic diseases might involve a direct action on hepatic energy metabolism. To further understand the therapeutic effects of BBR, we con-ducted experiments in a HFD-induced NAFLD animal model by treating rats with a single dose of BBR to exclude the interference of body weight change. As shown inFig 4, BBR and its metabolites were distributed in the liver. Moreover, BBR concentrations in rat liver were 50
Fig 2. Reduction of blood glucose, body weight and hepatic fat content after therapy.Mean values are shown for percentage changes from baseline of A) FBG, B) PBG, C) body weight and D) The mean HFC of the three groups before and after treatment.*p<0.05, compared with LSI group, &p<0.05, comared with LSI plus PGZ group.
Table 2. Changes of clinical and biochemical parameters after treatment. All parameters were adjusted for age, BMI and the baseline parameter and represented as means (95%CI). P value after adjustment for age, BMI, baseline data.
LSI LSI plus PGZ LSI plus BBR P value (LSI plus BBR vs. LSI)
P value (LSI plus BBR vs. LSI plus PGZ)
Number 53 47 55 -
-Weight (kg) -1.99(-2.76~-1.23) -1.94(-2.75~-1.12) -4.29(-5.04~-3.54) <0.001 <0.001
BMI(kg/m2) -0.72(-0.99~-0.44) -0.67(-0.97~-0.38) -1.51(-1.79~-1.25) <0.001 <0.001
Waist (cm) -2.14(-3.03~-1.26) -2.60(-3.55~-1.66) -4.84(-5.70~-3.97) <0.001 0.001 HFC(%) -11.4(-14.8~-7.9) -12.1(-15.8~-8.5) -17.4(-20.8~-14.0) 0.008 0.054 Blood glucose (mmol/L)
0min -0.15(-0.41~-0.12) -0.38(-0.66~-0.10) -0.47(-0.73~-0.20) 0.096 0.658 30min -0.63(-1.06~-0.19) -0.91(-1.38~-0.45) -1.03(-1.46~-0.60) 0.196 0.725 60min -1.23(-1.80~-0.65) -1.18(-1.79~-0.57) -1.86(-2.42~-1.29) 0.125 0.112 120min -1.05(-1.73~-0.37) -2.44(-3.17~-1.72) -2.19(-2.87~-1.51) 0.020 0.609 180min -0.90(-1.35~-0.44) -1.48(-1.97~-1.00) -1.57(-2.02~-1.11) 0.042 0.799 AUCg -3.33(-4.93~-1.73) -5.51(-7.21~-3.81) -6.14(-7.72~-4.55) 0.015 0.594 HbA1c(%) -0.30(-0.43~-0.16) -0.44(-0.58~-0.30) -0.47(-0.60~-0.33) 0.078 0.793 Serum insulin (mU/mL)
0min -0.85(-2.43~0.72) -1.66(-3.35~0.02) -1.59(-3.14~-0.03) 0.515 0.949 30min -3.10(-11.54~5.35) 1.24(-7.73~10.22) 6.93(-1.35~15.20) 0.098 0.362 120min 4.5(-10.9~19.9) -15.4(-32.0~1.1) -13.6(-28.9~1.7) 0.102 0.874 HOMA-IR -0.26(-0.72~0.20) -0.69(-1.18~-0.20) -1.06(-1.51~-0.61) 0.014 0.298 Lipid profile
TC(mmol/L) -0.12(-0.31~0.07) -0.11(-0.31~0.10) -0.52(-0.71~-0.33) 0.004 0.004 TG(mmol/L) -0.02(-0.24~0.21) -0.12(-0.36~0.12) -0.45(-0.68~-0.23) 0.007 0.050
HDL-c(mmol/ L) 0.005 (-0.034~0.044) 0.065 (0.023~0.107) 0.010 (-0.029~0.049) 0.861 0.061 LDL-c(mmol/ L)
-0.14(-0.32~0.04) -0.05(-0.25~0.14) -0.24(-0.42~-0.07) 0.442 0.154
APO-A(g/L) -0.01(-0.07~0.05) -0.00(-0.06~0.07) -0.09(-0.15~-0.03) 0.055 0.036 APO-B(g/L) -0.05(-0.09~-0.01) -0.05(-0.09~-0.00) -0.12(-0.16~-0.08) 0.022 0.023 APO-E(mg/L) -7.0(-10.7~-3.2) -8.9(-13.0~-4.8) -10.9(-14.6~-7.2) 0.143 0.476 LP(a)(mg/L) 4.53(-22.3~31.3) 17.8(-11.2~46.9) 23.6(-2.9~50.1) 0.319 0.774 Liver enzyme (U/L)
ALT -14.1(-18.0~-10.2) -20.5(-24.8~-16.2) -21.0(-24.9~-17.1) 0.015 0.855
AST -6.5(-8.2~-4.8) -8.3(-10.2~-6.4) -8.9(-10.7~-7.2) 0.050 0.632
γ-GT -8.4(-13.9~-3.0) -14.3(-20.2~-8.5) -11.7(-17.1~-6.3) 0.403 0.517
doi:10.1371/journal.pone.0134172.t002
Table 3. Contents of BBR and its metabolites in human blood and urine.
Compound M.W (m/z) Concentration (ng/mL) [Median (P25-P75)]
Serum BBR 336 6.99(4.65–9.82)
Urine BBR 336 79.16 (3.37–326.16)
M1 322 0.56 (0–3.01)
M2 322 0.66 (0–2.04)
M4 338 0.03(0–0.08)
M12 498 0(0–0.02)
M13 402 0.17(0–0.57)
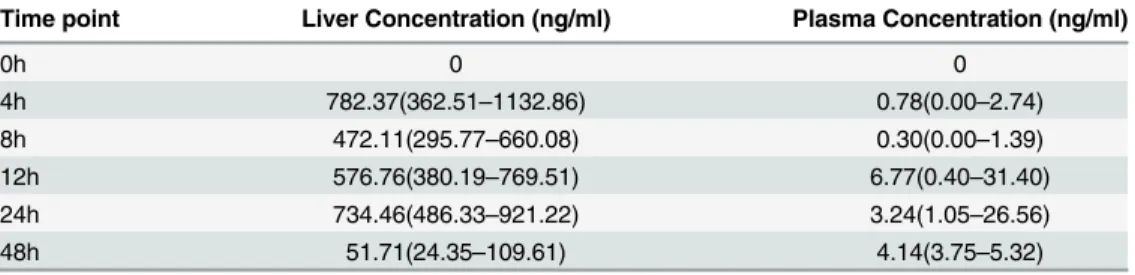
times higher than that in the plasma (Table 4). The first peak of BBR (886.80 ±174.55ng/g) in the liver occurred at 4 hrs after oral administration of the drug and second peak at 24 hrs (724.44±51.89 ng/g), followed by a significant decline. BBR metabolites exhibited a similar time-concentration relationship to that of BBR.
Effects of BBR on Hepatic Gene Expression
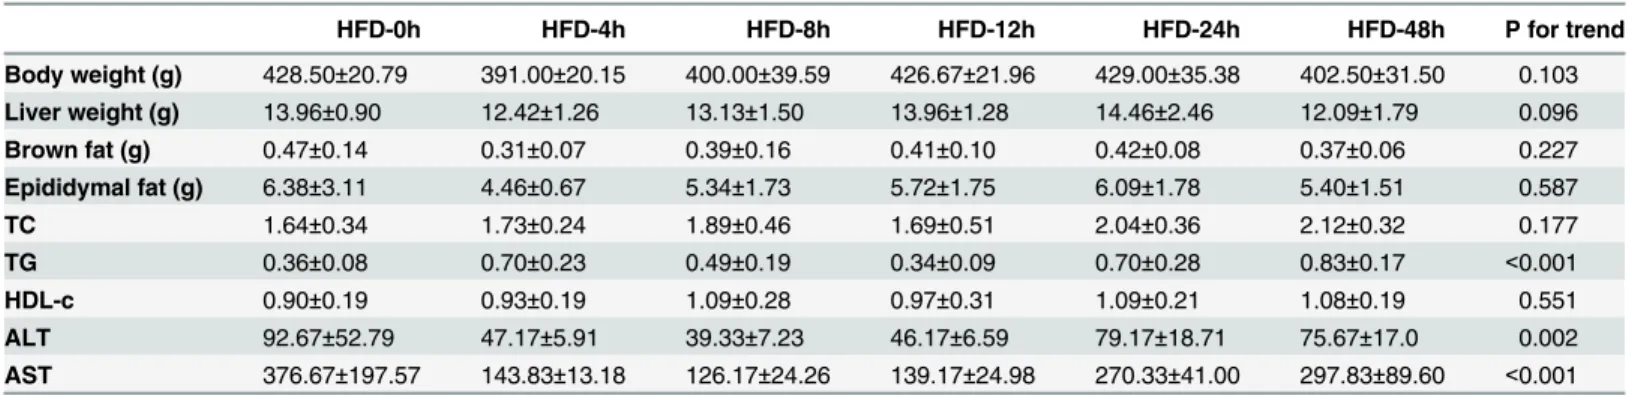
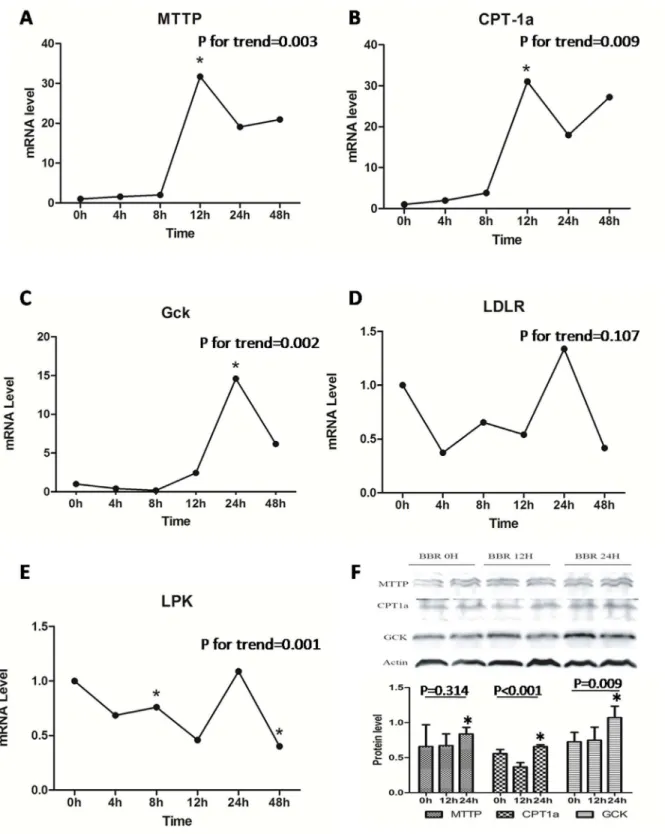
Having shown a preferable distribution of BBR in the liver, we further determine the effect of BBR on hepatic glucose and lipid metabolism. One single dose of BBR treatment significantly increased serum triglyceride and reduced serum ALT and AST concentration within 48hours, without change of body weight (Table 5). As shown inFig 5A–5E, the relative mRNA of CPT-1α, MTTP and GCK were significantly up-regulated (P<0.05) in the liver of HFD-fed rat orally
treated with a single dose of BBR. Western blot analysis showed a result consistent with that in real-time PCR (Fig 5F). The expression of CPT-1, MTTP and GCK reached the peak at 24 hrs after oral administration of BBR, parallel with a second peak of liver BBR concentration (Table 4). These data suggest a pleiotropic effect of BBR on the energy metabolism network in the liver, which may account for its direct therapeutic effect on NAFLD.
Fig 3. Comparison of HFC decrease (%) between the LSI and LSI plus BBR groups at different degrees of body weight change (<5%, 5–10% and
Discussion
The beneficial effects of BBR on glucose and lipid metabolism have been fully demonstrated. However, the mechanism underlying its therapeutic effect is still unclear. In our current study, we found that BBR was absorbable and mainly located in the liver (50 times higher than that in the plasma) after oral administration. With its preferential distribution in liver, BBR pro-foundly ameliorated liver steatosis in the NAFLD patients from our randomized clinical trial and directly regulated the expression of hepatic genes related to glucose and lipid-metabolism.
Fig 4. Concentration of BBR and its metabolites (M1, M2, M3, M4) in HFD rat liver and plasma (Mean±SEM, n = 6).
doi:10.1371/journal.pone.0134172.g004
Table 4. Concentration of BBR in HFD rat liver and plasma.
Time point Liver Concentration (ng/ml) Plasma Concentration (ng/ml)
0h 0 0
4h 782.37(362.51–1132.86) 0.78(0.00–2.74)
8h 472.11(295.77–660.08) 0.30(0.00–1.39)
12h 576.76(380.19–769.51) 6.77(0.40–31.40)
24h 734.46(486.33–921.22) 3.24(1.05–26.56)
48h 51.71(24.35–109.61) 4.14(3.75–5.32)
To the best of our knowledge, our current study is the first human study focusing on the BBR’s therapeutic effects on NAFLD, and we also measure its concentration in serum, urine and liver as well as hepatic gene expression related to glucose and lipid metabolism after BBR treatment.
In the present study, BBR treatment for 16-weeks in combination with LSI significantly reduced hepatic fat content in NAFLD patients, paralleled with a global metabolic benefit as reflected in reducing body weight, and improving glucose and lipid profiles. In comparison with LSI alone, BBR exhibited extra benefits in the improvement of body weight, HFC, HOMA-IR and lipid levels. Even compared with PGZ (15 mg/day) [24], BBR had not only a similar reduction of blood glucose and HFC, but also beneficial effects on body weight. Although gastro-enteric AEs related to BBR were observed, they were mild and tolerable. BBR was absorbable after oral administration in our study patients and studies on rat models showed that BBR was located favorably in the liver and could alter hepatic metabolism-related gene expression.
Patients in the berberine group lost significantly more liver fat content, and showed more reductions in blood glucose, triglycerides and cholesterol than the LSI group, which was con-cordant with those in previous studies [8,9,13]. A remarkable decrease in body weight was also obeserved in participants of BBR group. Several studies reported that the BBR had an extreme low bioavailability of less than 1% in BBR-treated animals [25,26], therefore it was believed that BBR was not absorbable in human gastrointestinal tract and its beneficial effects on hepatic fat, insulin resistance as well as glucose and lipid metabolism mainly depended on its effect on gut microbiota[27], and all of the hepatic fat and metabolic improvements might depended on significant weight loss after BBR treatment. However, our current study found that subjects at the BBR plus LSI group lost significantly more liver fat content than the LSI group with the same degree of body weight reduction (Fig 3), which indicated that the improvement of liver steatosis after BBR treatment not only related to the significant body weight reduction. Therefore, we further analyzed the serum and urine BBR concentrations using the accurate LC-MS/MS analysis in our human study, and found that BBR was absorbed by oral administration, metabolized in the liver and excreted in urine mainly in its prototype using LC-MS/MS analysis, which suggested its direct effect on the liver.
To further explore the possible mechanism underlying BBR’s direct effect on NAFLD in human beings, we measured the distribution of BBR (and its metabolites) after BBR treatment in the HFD-induced animal model of NAFLD. As compared to its concentration in blood, BBR (and its metabolites) favored to locate in liver with a concentration 50 times higher than that in the plasma (Table 4). In fact the phenomena of liver-selective enrichment have been reported in BBR[20,28] and other botanic medicinal alkaloids[29].
Table 5. Phenotype of HFD-induced NAFLD rats after treating with single-dose BBR.
HFD-0h HFD-4h HFD-8h HFD-12h HFD-24h HFD-48h P for trend
Body weight (g) 428.50±20.79 391.00±20.15 400.00±39.59 426.67±21.96 429.00±35.38 402.50±31.50 0.103
Liver weight (g) 13.96±0.90 12.42±1.26 13.13±1.50 13.96±1.28 14.46±2.46 12.09±1.79 0.096 Brown fat (g) 0.47±0.14 0.31±0.07 0.39±0.16 0.41±0.10 0.42±0.08 0.37±0.06 0.227 Epididymal fat (g) 6.38±3.11 4.46±0.67 5.34±1.73 5.72±1.75 6.09±1.78 5.40±1.51 0.587
TC 1.64±0.34 1.73±0.24 1.89±0.46 1.69±0.51 2.04±0.36 2.12±0.32 0.177
TG 0.36±0.08 0.70±0.23 0.49±0.19 0.34±0.09 0.70±0.28 0.83±0.17 <0.001 HDL-c 0.90±0.19 0.93±0.19 1.09±0.28 0.97±0.31 1.09±0.21 1.08±0.19 0.551 ALT 92.67±52.79 47.17±5.91 39.33±7.23 46.17±6.59 79.17±18.71 75.67±17.0 0.002
AST 376.67±197.57 143.83±13.18 126.17±24.26 139.17±24.98 270.33±41.00 297.83±89.60 <0.001
Fig 5. A-E) Altered expression of genes closely related to glucose and lipid metabolism in liver of SD rats. The samples were examined within 48h after single-dosing of BBR in oral route. Real-time quantitative PCR was used to detect the liver A) MTTP, B) CPT-1α, C) GCK, D) LDLR and E) LPK mRNA expression at different time courses. F) Quantification of the MTTP, CPT-1, C) GCK, D) LDLR and E) LPK mRNAes were examined within 48h after single-dosing of BBR in oral route. liMTTP, microsomal triglyceride transfer protein; CPT-1α, carnitine palmitoyltransferase-1α; GCK, glucokinase; LDLR, low density lipoprotein receptor; LPK, liver pyruvate kinase.
However, the liver-selective enrichment of BBR is possibly the hepatic first-pass effect, which does not mean a bioactivity on glucose and lipid metabolism, so we examined hepatic expression of a group of energy metabolism related genes MTTP, CPT-1a and GCK at 0, 4, 8, 12, 24 and 48h after oral administration of a single dose of BBR. The expression of these genes in liver was significantly up-regulated after BBR treatment, with no significant change of body weight at each time point, indicating a direct effect of BBR on hepatic expression of metabolism related genes. MTTP was for the assembly and secretion of apoB-containing lipoproteins (VLDL and LDL)[15], CPT-1a was a part of the outer membrane fatty acid transfer complex and catalyzed the primary regulated step in overall mitochondrial fatty acid oxidation[30]. The up-regulation of these genes after BBR treatment might promote the export andβ-oxidation of liver fat, and partially account for its therapeutic effect in its therapeutic effect in improving liver steatosis. GCK was for regulation of glucose metabolism rate[31], and also increased after BBR treatment. It has been reported that BBR could decrease insulin resistance by activating liver AMPK [32], and hepatic GCK up-regulation might relate to the activation of hepatic AMPK pathway[33]. Therefore, BBR may have multiple effects on liver genes associated with lipid or glucose metabolism. It is likely that the significant anti-NAFLD effect of BBR is related to its favorite location in liver and its direct effects on multiple hepatic genes that links to energy metabolism.
The limitation of this study is that none of these patients was examined by liver biopsy because of the ethics concern, and the effects of BBR on human hepatic histological inflamma-tion, fibrosis as well as the genes related to energy metabolism need to be further studied.
Conclusion
Oral administration of BBR significantly reduced HFC, body weight, and improved metabolic profile for lipid and glucose in patients with NAFLD. The therapeutic efficacy of BBR on NAFLD and its related glucose and lipid metabolism related to its favorite location in liver and its direct effects on multiple hepatic genes that links to energy metabolism. Therefore, BBR is a promising agent to treat NAFLD, as well as their related metabolic diseases.
Supporting Information
S1 ARRIVE Checklist. NC3Rs ARRIVE Guidelines. (PDF)
S1 CONSORT Checklist. CONSORT Checklist. (DOC)
S1 Fig. Design schematic of the clinical trial. (TIF)
S1 Protocol. Trial Protocol (English). (DOCX)
S2 Protocol. Trial Protocol (Chinese). (DOC)
S1 Table. Compliance of lifestyle intervention and medication in the three groups. (DOCX)
S1 Text. Detailed description of the methods of real-time quantitative polymerase-chain-reaction (PCR) analysis, Western blot analysis, and measurement of BBR and its metabo-lites in the liver tissue using a shimadzu triple-quadruple MS (LC–MS/MS 8040; Shimadzu
Corporation, Kyoto Japan) in animal model. (DOCX)
Acknowledgments
The authors thank Professor Pu XIA (Zhongshan Hospital, Fudan University) for critical read-ing of the manuscript.
Author Contributions
Conceived and designed the experiments: XG JJ WJ HY. Performed the experiments: HY MX YW XC XY SR MZ YT RF JL. Analyzed the data: WD MX YW. Contributed reagents/materi-als/analysis tools: XY SR MZ RF. Wrote the paper: XG JJ MX HY.
References
1. de Alwis NM, Day CP. Non-alcoholic fatty liver disease: the mist gradually clears. J Hepatol 2008; 48 (Suppl 1): S104–12. doi:10.1016/j.jhep.2008.01.009PMID:18304679
2. Farrell GC, Larter CZ. Nonalcoholic fatty liver disease: from steatosis to cirrhosis. Hepatology. 2006; 43 (2 Suppl 1):S99–S112. PMID:16447287
3. Anstee QM, Targher G, Day CP. Progression of NAFLD to diabetes mellitus, cardiovascular disease or cirrhosis. Nat Rev Gastroenterol Hepatol. 2013; 10:330–44. doi:10.1038/nrgastro.2013.41PMID: 23507799
4. Adams LA, Waters OR, Knuiman MW, Elliott RR, Olynyk JK. NAFLD as a risk factor for the develop-ment of diabetes and the metabolic syndrome: an eleven-year follow-up study. Am J Gastroenterol. 2009; 104:861–67. doi:10.1038/ajg.2009.67PMID:19293782
5. Belfort R, Harrison SA, Brown K, Darland C, Finch J, Hardies J, et al. A placebo-controlled trial of piogli-tazone in subjects with nonalcoholic steatohepatitis. N Engl J Med. 2006; 355:2297–307. PMID: 17135584
6. Sanyal AJ, Chalasani N, Kowdley KV, McCullough A, Diehl AM, Bass NM, et al. Pioglitazone, vitamin E, or placebo for nonalcoholic steatohepatitis. N Engl J Med; 362:1675–85. doi:10.1056/
NEJMoa0907929PMID:20427778
7. Aithal GP, Thomas JA, Kaye PV, Lawson A, Ryder SD, Spendlove I, et al. Randomized, placebo-con-trolled trial of pioglitazone in nondiabetic subjects with nonalcoholic steatohepatitis. Gastroenterology 2008; 135:1176–84. doi:10.1053/j.gastro.2008.06.047PMID:18718471
8. Yin J, Xing H, Ye J. Efficacy of berberine in patients with type 2 diabetes mellitus. Metabolism.2008; 57:712–7. doi:10.1016/j.metabol.2008.01.013PMID:18442638
9. Kong W, Wei J, Abidi P, Lin M, Inaba S, Li C, et al. Berberine is a novel cholesterol-lowering drug work-ing through a unique mechanism distinct from statins. Nat Med. 2004; 10: 1344–51. PMID:15531889 10. Cameron J, Ranheim T, Kulseth MA, Leren TP, Berge KE. Berberine decreases PCSK9 expression in HepG2 cells. Atherosclerosis. 2008; 201: 266–73. doi:10.1016/j.atherosclerosis.2008.02.004PMID: 18355829
11. Lu SS, Yu YL, Zhu HJ, Liu XD, Liu L, Liu YW, et al. Berberine promotes glucagon-like peptide-1 (7–36) amide secretion in streptozotocin-induced diabetic rats. Journal of Endocrinology. 2009; 200:159–65. doi:10.1677/JOE-08-0419PMID:18996945
12. Kong WJ, Zhang H, Song DQ, Xue R, Zhao W, Wei J, et al. Berberine reduces insulin resistance through protein kinase C-dependent up-regulation of insulin receptor expression. Metabolism: Clinical and Experimental. 2009; 58:109–19.
13. Zhang Y, Li X, Zou D, Liu W, Yang J, Zhu N, et al. Treatment of type 2 diabetes and dyslipidemia with the natural plant alkaloid berberine. J Clin Endocrinol Metab. 2008; 93:2559–65. doi: 10.1210/jc.2007-2404PMID:18397984
15. Chang X, Yan H, Fei J, Jiang M, Zhu H, Lu D, et al. Berberine reduces methylation of the MTTP pro-moter and alleviates fatty liver induced by a high-fat diet in rats. J Lipid Rese. 2010; 51: 2504–15. 16. Szczepaniak LS, Nurenberg P, Leonard D, Browning JD, Reingold JS, Grundy S, et al. Magnetic
reso-nance spectroscopy to measure hepatic triglyceride content: prevalence of hepatic steatosis in the gen-eral population. Am J Physiol Endocrinol Metab. 2005; 288:E462–8. PMID:15339742
17. Farrell GC, Chitturi S, Lau GK, Sollano JD, Asia-Pacific Working Party on NAFLD. Guidelines for the assessment and management of nonalcoholic fatty liver disease in the Asia-Pacific region: executive summary. J Gastroenterol Hepatol 2007; 22:775–7. PMID:17565629
18. Cho E. Berberini hydrochloride. in Pharmacopoeia of the People’s Republic of China 2, 1990;437–439. 19. Astrup A, Carraro R, Finer N, Harper A, Kunesova M, Lean ME, et al. Safety, tolerability and sustained
weight loss over 2 years with the once-daily human GLP-1 analog, liraglutide. Int J Obes (Lond). 2012; 36:843–54.
20. Tan XS, Ma JY, Feng R, Ma C, Chen WJ, Sun YP, et al. Tissue distribution of berberine and its metabo-lites after oral administration in rats. PLoS One. 2013;31; 8:e77969. doi:10.1371/journal.pone. 0077969PMID:24205048
21. Bian H, Yan H, Zeng M, Rao S, Yao X, Zhou J, et al. Increased liver fat content and unfavorable glucose profiles in subjects without diabetes. Diabetes Technol. Ther. 2011; 13: 149–55. doi:10.1089/dia. 2010.0101PMID:21284482
22. Ma JY, Feng R, Tan XS, Ma C, Shou JW, Fu J, et al. Excretion of berberine and its metabolites in oral administration in rats. J Pharm Sci. 2013; 102:4181–92. doi:10.1002/jps.23718PMID:24006193 23. Belfort R, Harrison SA, Brown K, Darland C, Finch J, Hardies J, et al. A placebo-controlled trial of
piogli-tazone in subjects with nonalcoholic steatohepatitis. N Engl J Med. 2006; 355:2297–307. PMID: 17135584
24. Takihata M, Nakamura A, Tajima K, Inazumi T, Komatsu Y, Tamura H, et al. Comparative study of sita-gliptin with pioglitazone in Japanese type 2 diabetic patients: the COMPASS randomized controlled trial. Diabetes Obes Metab. 2013; 15:455–62. doi:10.1111/dom.12055PMID:23279373
25. Chen W, Miao YQ, Fan DJ, Yang SS, Lin X, Meng LK, et al. Bioavailability study of berberine and the enhancing effects of TPGS on intestinal absorption in rats. Aaps Pharmscitech 2011; 12: 705–11. doi: 10.1208/s12249-011-9632-zPMID:21637946
26. Hua W, Ding L, Chen Y, Gong B, He J, Xu G. Determination of berberine in human plasma by liquid chromatography-electrospray ionization-mass spectrometry. J Pharm Biomed Anal. 2007; 44:931–7. PMID:17531424
27. Xie W, Gu D, Li J, Cui K, Zhang Y. Effects and action mechanisms of berberine and Rhizoma coptidis on gut microbes and obesity in high-fat diet-fed C57BL/6J mice. PLoS One. 2011; 6:e24520. doi:10. 1371/journal.pone.0024520PMID:21915347
28. Liu YT, Hao HP, Xie HG, Lai L, Wang Q, Liu CX, et al. Extensive intestinal first-pass elimination and predominant hepatic distribution of berberine explain its low plasma levels in rats. Drug Metab Dispos. 2010; 38:1779–84. doi:10.1124/dmd.110.033936PMID:20634337
29. Liu J, Huang X, Xue M, Jiang Z, Zhang L, Ma S. Tissue distribution of 4 alkaloids of Compound Matrine Injection in rats. Pharmacology and Clinics of Chinese Materia Medica. 2011; 27: 74–8.
30. Lee K, Kerner J, Hoppel CL. Mitochondrial carnitine palmitoyltransferase 1a (CPT1a) is part of an outer membrane fatty acid transfer complex. J Biol Chem. 2011; 286:25655–62. doi:10.1074/jbc.M111. 228692PMID:21622568
31. Reiling E, van 't Riet E, Groenewoud MJ, Welschen LM, van Hove EC, Nijpels G, et al. Combined effects of single-nucleotide polymorphisms in GCK, GCKR, G6PC2 and MTNR1B on fasting plasma glucose and type 2 diabetes risk. Diabetologia. 2009; 52:1866–70. doi:10.1007/s00125-009-1413-9 PMID:19533084
32. Lee YS, Kim WS, Kim KH, Yoon MJ, Cho HJ, Shen Y, et al. Berberine, a natural plant product, activates AMP-activated protein kinase with beneficial metabolic effects in diabetic and insulin-resistant states. Diabetes. 2006; 55:2256–64. PMID:16873688