The association of vitamin D deficiency with
non-alcoholic fatty liver disease
Metin Ku¨c¸u¨kazman,INaim Ata,II Ku¨rs¸at Dal,IIAbdullah O¨ zgu¨r Yeniova,IAys¸e Kefeli,ISebahat Basyigit,I Bora Aktas,I Kadir Okhan Akin,III Kadir Ag˘ladiog˘lu,IVO¨ znur Sari U¨re,II Firdes Topal,VYas¸ar Nazligu¨l,I Esin Beyan,IIDerun Taner ErtugrulVI
IKecioren Teaching and Research Hospital, Department of Gastroenterology, Kecioren, Ankara, Turkey.IIKecioren Teaching and Research Hospital,
Department of Internal Medicine, Kecioren, Ankara, Turkey.IIIKecioren Teaching and Research Hospital, Department of Clinical Biochemistry, Kecioren, Ankara, Turkey.IVKecioren Teaching and Research Hospital, Department of Radiology, Kecioren, Ankara, Turkey.VAnkara Oncology Teaching and Research Hospital, Department of Gastroenterology, Ankara, Turkey.VIKecioren Teaching and Research Hospital, Department of Endocrinology and Metabolism, Kecioren, Ankara, Turkey.
OBJECTIVE: Vitamin D deficiency has been related to diabetes, hypertension, hyperlipidemia and peripheral vascular disease. In this study, we aimed to investigate the role of vitamin D status in non-alcoholic fatty liver disease.
METHODS:We included 211 consecutive subjects to examine the presence of non-alcoholic fatty liver disease. Of these subjects, 57 did not have non-alcoholic fatty liver disease and 154 had non-alcoholic fatty liver disease. RESULTS:The non-alcoholic fatty liver disease group had significantly higher fasting blood glucose (p= 0.005),
uric acid (p= 0.001), aspartate aminotransferase (p,0.001), alanine aminotransferase (p,0.001), c
-glutamyl-transferase (p,0.0001), alkaline phosphatase (p= 0.028), HbA1c (p,0.001), ferritin (p,0.001), insulin (p= 0.016), C-peptide (p= 0.001), HOMA-IR (p= 0.003), total cholesterol (p= 0.001), triglyceride (p= 0.001) and
white blood cell (p= 0.04) levels. In contrast, the non-alcoholic fatty liver disease group had significantly lower
25(OH)D levels (12.3¡8.9 ng/dl,p,0.001) compared with those of the control group (20¡13.6 ng/dl). CONCLUSIONS:In this study, we found lower serum 25(OH)D levels in patients with non-alcoholic fatty liver disease than in subjects without non-alcoholic fatty liver disease. To establish causality between vitamin D and non-alcoholic fatty liver disease, further interventional studies with a long-term follow-up are needed.
KEYWORDS: Vitamin D; Non-Alcoholic Fatty Liver Disease; Hepatosteatosis.
Ku¨c¸u¨kazman M, Ata N, Dal K, Yeniova AO, Kefeli A, Basyigit S, et al. The association of vitamin D deficiency with non-alcoholic fatty liver disease. Clinics. 2014;69(8):542-546.
Received for publication onJanuary 13, 2014;First review completed onFebruary 5, 2014;Accepted for publication onMarch 14, 2014
E-mail: [email protected]
Tel.: 90 312 3569000
& INTRODUCTION
Although the main function of vitamin D is to regulate bone metabolism, its deficiency has been related to many other organ systems. Vitamin D deficiency was previously shown to be associated with an increase in the prevalence of diabetes, hypertension, hyperlipidemia and peripheral vascular disease (1). Vitamin D levels were also highly associated with coronary artery disease, myocardial infarc-tion, heart failure, stroke and incident death (1). Vitamin D levels have been additionally associated with obesity, inflammation and insulin resistance (2). Furthermore, it
was shown that vitamin D administration decreases free fatty acid (FFA)-induced insulin resistance in experimental models (3).
Previous studies have shown that non-alcoholic fatty liver disease (NAFLD) is frequently associated with abdominal obesity, dyslipidemia, insulin resistance and type 2 diabetes and may indeed be another component of metabolic syndrome (4). NAFLD has also been associated with an increased risk of cardiovascular disease among type 2 diabetic patients, independent of glycemic control and the presence of metabolic syndrome (5).
The very few studies that have examined the possible effect of vitamin D on NAFLD (6,7), which is also related to diabetes mellitus, obesity, dyslipidemia and insulin resis-tance, have yielded contradictory results. No interventional studies have investigated the possible effect of vitamin D supplementation on the progression of NAFLD. In the present study, we aimed to investigate the association of vitamin D status, insulin resistance and the urinary albumin/creatinine ratio with NAFLD in winter.
Copyrightß2014CLINICS– This is an Open Access article distributed under
the terms of the Creative Commons Attribution Non-Commercial License (http:// creativecommons.org/licenses/by-nc/3.0/) which permits unrestricted non-commercial use, distribution, and reproduction in any medium, provided the original work is properly cited.
No potential conflict of interest was reported.
& MATERIALS AND METHODS
The work was performed in accordance with the Declaration of Helsinki.
Population
In this study, we included 232 consecutive subjects who were referred to our endocrinology and gastroenterology outpatient clinics between November 2010 and March 2011. The patients who were diagnosed with NAFLD comprised the patient group and the subjects without NAFLD comprised the control group. The inclusion criteria were no history of excessive alcohol consumption, defined as an average consumption of alcohol of.30 g/day in men and
,20 g/day in women; negativity for hepatitis B surface antigen and antibodies to hepatitis C virus (HCV); and an absence of cirrhosis. Other chronic liver diseases, such as autoimmune hepatitis, Wilson’s disease and hemochroma-tosis were excluded by analyzing autoimmune markers of hepatitis, serum ceruloplasmin and ferritin levels, respec-tively. Antinuclear antibody (ANA), anti-smooth muscle antibody (ASMA), anti-mitochondrial antibody (AMA) and anti-liver-kidney microsomal-1 antibody (anti-LKM-1) were used to distinguish autoimmune liver diseases. In total, 16 patients with HBsAg (+), 3 patients with anti-HCV antibody
(+) and 2 patients with autoimmune hepatitis antibodies
were excluded from the study. After these patients were excluded, 211 patients were included in the study.
Patients taking vitamin supplements and wearing head-scarves were excluded. Anthropometric measurements were recorded for each subject. The study protocol was in accordance with the Declaration of Helsinki and was approved by the local ethics committee. Each patient gave written informed consent before enrollment and the study was conducted according to the rules of good clinical practice.
Serum samples
Fasting blood samples were obtained after a 12-hour fast by venipuncture of the large antecubital veins without stasis. The samples were then centrifuged immediately, and the plasma was separated and stored at -80˚C. To avoid variation, all samples were studied on the same day using the same kit.
Biochemical analysis
Fasting serum insulin and C-peptide levels were mea-sured by a Liaison Immunoluminometric Assay (DiaSorin Inc., Stillwater, MN, USA). HbA1c analyses were performed using an automated Tosoh G7 HbA1c Analyzer (Tosoh Corporation, Tokyo, Japan). Urine microalbumin levels were measured by a Beckman Coulter Immage nephelo-metric tool (Immage Immunohistochemistry System, CA, USA). The levels of 25(OH)D were measured using a 25OH-VIT.D3-RIA-CT kit (Catalog No.: KIP1961) (Biosource, Neville, Belgium) from RIA (normal range: 30-100 ng/ml).
NAFLD evaluation
Liver ultrasonography (US) was performed to assess the degree of steatosis. All US was performed by the same operator, who was unaware of the aims of the study and was blinded to the laboratory values using a General Electric Logic 5 apparatus equipped with a convex 3.5 MHz probe. Liver steatosis was scored semiquantitatively on a
scale of 0-3: 0: absent; 1: mild; 2: moderate; and 3: severe. Steatosis was graded based on the description by Saverymuttu et al., in which abnormal intensity, high-level echoes arising from the hepatic parenchyma, a liver-kidney difference in echo amplitude, echo penetration into the deep portion of the liver and clarity of the liver blood vessel structures were assessed (8).
Statistics
Statistical Package for the Social Sciences (SPSS) version 15.0 was used for the analysis. The distribution of the data was assessed using a one-sample Kolmogorov-Smirnov test. Normally distributed continuous variables were expressed as the mean ¡ SD, skew-distributed continuous variables were expressed as the median (minimum-maximum) and categorical variables were expressed as the number and percentage. For comparison of categorical variables, Fisher’s exact test or a chi-square test was used. Differences between numeric variables were tested with Student’s t-test or a Mann-Whitney U-test, where appropriate. Correlations were tested with Spearman’s rank-order or Pearson’s correlation coefficient. The possible factors identified in the univariate analyses were entered into a logistic regres-sion analysis to determine the independent predictors of hepatosteatosis. Hosmer-Lemeshow goodness-of-fit statis-tics were used to assess model fit.P,0.05 was considered to be statistically significant.
& RESULTS
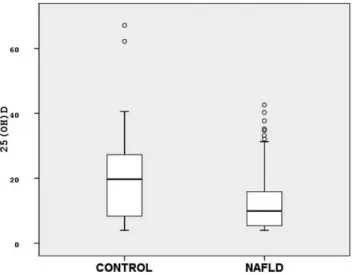
A total of 211 subjects were included in the study. Of these subjects, 57 did not have NAFLD (the control group) and 154 had NAFLD. Within the NAFLD group, 48 patients had grade 1, 69 patients had grade 2 and 37 patients had grade 3 hepatosteatosis. The NAFLD and control groups did not differ in terms of gender, age or BMI. The NAFLD group had significantly higher fasting blood glucose (FBG) (p= 0.005), uric acid (p= 0.001), aspartate aminotrans-ferase (AST) (p,0.0001), alanine aminotransferase (ALT) (p,0.0001), c-glutamyltransferase (GGT) (p,0.0001), alka-line phosphatase (ALP) (p= 0.028), HbA1c (p,0.0001), ferritin (p,0.0001), insulin (p= 0.016), C-peptide (p= 0.001), HOMA-IR (p= 0.003), total cholesterol (p= 0.001), triglycer-ide (TG) (p= 0.001) and white blood cell (WBC) (p= 0.04) levels. In contrast, the NAFLD group had significantly lower 25(OH)D levels (p,0.0001) compared with those of the control group (Figure 1).
There was no significant difference in other measure-ments between the two groups. The demographic features and laboratory measurements of the subjects are shown in Table 1.
There was a gradual decline in the mean 25(OH)D levels as the grade of NAFLD increased. However, 25(OH)D levels did not differ significantly between the 3 grades of NAFLD. Uric acid (p,0.0001), AST (p= 0.04), ALT (p= 0.001), and HOMA-IR (p= 0.004) levels were significantly different between the 3 grades of NAFLD. The urinary albumin/ creatinine ratio differed significantly between the NAFLD grades and the controls (p= 0.01). Among the 3 grades, only patients with grade 3 NAFLD had a significantly higher urinary albumin/creatinine ratio than did the controls (p= 0.002).
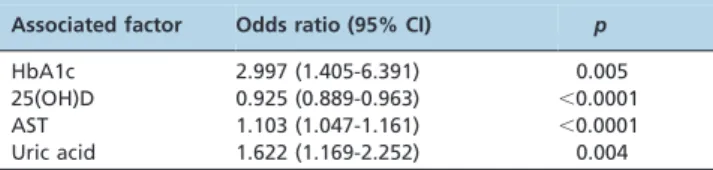
the urinary albumin/creatinine ratio (r = -0.267, p= 0.001), FBG levels (r = -0.151, p= 0.03), the erythrocyte sedimenta-tion rate (ESR) (r = -0.321, p,0.0001), uric acid levels (r = 0.159, p= 0.022), total cholesterol levels (r = -0.239, p= 0.001), LDL-C levels (r = -0.199, p= 0.004) and HDL-C levels (r = -0,193, p= 0.005). The results of the logistic regression analysis are shown in Table 2.
& DISCUSSION
This study showed that individuals with NAFLD have significantly lower serum 25(OH)D levels compared with those of individuals without NAFLD. However, we failed to
demonstrate a difference in serum 25(OH)D levels between the three grades of NAFLD.
Several studies have investigated the role of vitamin D status in NAFLD. Jablonski et al. investigated the role of 25(OH)D in NAFLD patients in an integrated healthcare delivery system in the U.S. These researchers matched the NAFLD group with a presumably healthy population that did not undergo liver US. They found a strong inverse relationship between NAFLD and 25(OH)D levels (9). Rhee et al. found a minor but significant difference in 25(OH)D levels between patients with and without NAFLD (38.7¡9.0
vs. 39.7¡9.7 nmol/l)(10). In another study, plasma vitamin D concentrations were quantified in 148 consecutive biopsy-proven NAFLD patients and 39 controls. The researchers found that vitamin D levels were significantly lower in NAFLD patients compared with healthy controls. Higher NAFLD activity scores were associated with lower plasma concentrations of vitamin D(6). Targher et al. studied 60 consecutive patients with NAFLD and 60 clinically healthy volunteers during the winter months (11). The researchers performed a liver biopsy to confirm NAFLD. They found significantly lower levels of serum 25(OH)D in NAFLD patients than in controls. Additionally, 25(OH)D concentra-tions were inversely related to the degrees of steatosis, necroinflammation and fibrosis. The researchers chose lean, healthy subjects as the control group, so the difference in vitamin D levels may also have been influenced by obesity per se. In our study, there was no significant difference between the subjects with NAFLD and without NAFLD regarding BMI. Therefore, we think that we can eliminate the effect of obesity on the levels of 25(OH)D. In our study, although there was a gradual decline in the mean levels of 25(OH)D as the grade of NAFLD increased, this decline did not reach significance.
Barchetta et al. investigated vitamin D status in NAFLD patients diagnosed by ultrasonographic evaluation (12). Figure 1 - Comparison of 25(OH)D levels (ng/dl) between the
NAFLD and the control groups.
Table 1 -General characteristics and laboratory measurements among the groups.
Control (n = 57)
NAFLD
(n = 154) p
Age (years) 48.9¡11.0 46.3¡10.7 NS
Sex (n, %) =:27 (47.4%),R:30 (52.6%) =:66 (42.9%),R:88 (57.1%) NS
BMI (kg/m2) 31.9¡4.3 31.7¡7.6 NS
25(OH)D (ng/dl) 20¡13.6 12.3¡8.9 ,0.0001
FBG (mg/dl) 90.7¡12.5 98.9¡20.4 0.005
BUN (mg/dl) 26.3¡7.6 25.1¡.,4 NS
Creatinine (mg/dl) 0.8¡0.15 1.02¡0.18 NS
Uric acid (mg/dl) 4.8¡1.3 5.5¡1.3 0.001
AST (IU/l) 22.5¡6.5 34.5¡18.1 ,0.0001
ALT (IU/l) 21.3¡8.2 47.3¡34.0 ,0.0001
GGT (IU/l) 24.5¡21.7 41.3¡29.9 ,0.0001
ALP (IU/l) 81.2¡49.1 92¡53 0.028
Total protein (g/dl) 7.3¡0.4 7.4¡0.4 NS
Albumin (g/dl) 4.2¡0.4 4.2¡0.3 NS
HbA1c (%) 5.6¡0.5 6.0¡0.7 ,0,0001
Ferritin (ng/ml) 39.0¡33.3 66.7¡52.3 ,0.0001
Insulin (mIU/ml) 12.6¡11.5 13.7¡9.6 0.016
C-peptide (ng/ml) 2.54¡1.70 3.10¡1.81 0.001
HOMA-IR 2.85¡2.73 3.45¡3.29 0.003
ESR (mm/hour) 15.2¡14.0 18.4¡15.3 NS
Urinary albumin/creatinine ratio (g/mg) 7.0¡10.5 13.3¡37.8 NS
Total cholesterol (mg/dl) 180.3¡29.1 199.9¡40.5 0.001
HDL-C (mg/dl) 45.0¡10.1 44.9¡12.7 NS
LDL-C (mg/dl) 115.8¡26.9 122.8¡37.7 NS
TG (mg/dl) 108.1¡57.3 152.6¡99.6 0.001
They found a significant correlation between the fatty liver index and 25(OH)D levels. However, they did not mention the months during which the serum samples were collected and did not compare the 25(OH)D levels between the 3 grades of NAFLD. Our study is in accordance with Targher’s and Barchetta’s studies, except that 25(OH)D levels did not differ significantly between the 3 grades of NAFLD, although there was a gradual decline in the levels of 25(OH)D. This discrepancy may stem from different UV light exposure in the different seasons during which these studies were conducted. In our country, dairy products are not enriched with vitamin D. However, in the above-mentioned studies, the researchers did not mention whether dairy products are enriched with vitamin D in their countries. In the first study, both the NAFLD and the control subjects had mean 25(OH)D levels above normal levels. In the second study, the control subjects had normal mean 25(OH)D levels. In our study, only the control subjects had mean 25(OH)D levels higher than the lower normal limit (20 ng/ml). In this study, we also performed specific blood tests to exclude other chronic liver diseases, such as autoimmune hepatitis, Wilson’s disease and hemochromatosis. Previous studies did not address these possible causes of chronic liver disease in which vitamin D metabolism may also be altered.
In our study, vitamin D levels were negatively correlated with total cholesterol levels. It was previously shown that vitamin D directly regulates the metabolism of FFAs via its action on peroxisome proliferator-activated receptor gamma (PPAR-c)(12). There may be a link between vitamin D and
lipid metabolism in the liver; theoretically, increased FFAs in the blood may increase fat storage in the liver, resulting in NAFLD. Apolipoprotein E (APOE) is a plasma protein that is involved in lipid transport and metabolism. Three alleles,e2,e3 ande4, at the APOE locus on chromosome 19
determine three isoforms: APOE2, APOE3 and APOE4, respectively. Sazci et al. have found that the APOE e3
allele was overrepresented in non-alcoholic steatohepatitis (NASH) patients (e3 = 97.37% in NASH vs. 82.45% in
controls)(13). In that study, APOE polymorphism was also significantly associated with NASH. It was previously shown that the APOEe4 allele was associated with higher
serum vitamin D levels in mice and that APOE2 and APOE3 mice had lower 25(OH)D levels compared with those of APOE4 mice (14). We can hypothesize that patients carrying the APOE e3 allele might have both hepatosteatosis and
vitamin D deficiency due to a combined mechanism. It is known that vitamin D has immunomodulatory effects. In LPS-stimulated murine macrophages, 1.25(OH)2D3 upre-gulates the inhibitor of NF-kB (IkB-a) by increasing mRNA
stability and decreasing IkB-aphosphorylation. This increase
in IkB-alevels leads to a reduction in the nuclear
transloca-tion of NF-kB, thereby causing a decline in activity. Given the
key role of NF-kB as a transcription factor for inflammatory
mediators, it could be suggested that 1.25(OH)2D3 has
anti-inflammatory action in macrophages (15). In the liver, vitamin D suppresses fibroblast proliferation and collagen production and it was recently shown that vitamin D deficiency was associated with a low rate of sustained virological responses in patients affected by HCV under interferon-alpha therapy (16,17). In the present study, inflammatory markers such as ferritin and WBC levels were found to be significantly higher in patients with NAFLD and vitamin D levels were negatively correlated with the ESR. It is possible that vitamin deficiency stimulates inflammation, together with hyperlipidemia and insulin resistance, thus leading to NAFLD.
The main limitation of this study is the determination of hepatosteatosis by US, without liver biopsy. We also could not follow the patients after vitamin D replacement to determine whether their hepatosteatosis did return to normal.
In conclusion, in this study, we found lower serum 25(OH)D levels in NAFLD patients than in subjects without NAFLD. However, we did not find a significant relationship between the severity of steatosis and 25(OH)D levels. This finding may have been related to low UV light exposure in the winter months or to genetic differences between different cultures. It is not known whether vitamin D supplementation would decrease NAFLD. Interventional experimental and prospective clinical studies are required to establish the causality between vitamin D status and NAFLD.
& AUTHOR CONTRIBUTIONS
Ku¨c¸u¨kazman M and Ertugrul DT designed the study, contributed to the analysis and interpretation of the data and manuscript drafting and review. Ata N, Dal K, Yeniova AO, Kefeli A, Basyigit S, Aktas B, and Topal F contributed to patient enrollment. Ag˘ladiog˘lu K performed the ultrasono-graphy on the patients. Akin KO performed the biochemical measure-ments. Nazligu¨l Y and Beyan E contributed to the analysis and interpretation of the data and to the manuscript drafting and review. All of the authors declare that they participated sufficiently in the work to take public responsibility.
& REFERENCES
1. Anderson JL, May HT, Horne BD, Bair TL, Hall NL, Carlquist JF, et al. Relation of vitamin D deficiency to cardiovascular risk factors, disease status, and incident events in a general healthcare population. Am J Cardiol. 2010;106(7):963-8, http://dx.doi.org/10.1016/j.amjcard. 2010.05.027.
2. Chagas CE, Borges MC, Martini LA, Rogero MM. Focus on vitamin D, inflammation and type 2 diabetes. Nutrients. 2012;4(1):52-67, http://dx. doi.org/10.3390/nu4010052.
3. Zhou QG, Hou FF, Guo ZJ, Liang M, Wang GB, Zhang X. 1,25-Dihydroxyvitamin D improved the free fatty-acid-induced insulin resistance in cultured C2C12 cells. Diabetes Metab Res Rev. 2008; 24(6):459-64, http://dx.doi.org/10.1002/dmrr.873.
4. McCullough AJ. The clinical features, diagnosis and natural history of nonalcoholic fatty liver disease. Clin Liver Dis. 2004;8(3):521-33, viii, http://dx.doi.org/10.1016/j.cld.2004.04.004.
5. Targher G, Bertolini L, Poli F, Rodella S, Scala L, Tessari R, et al. Nonalcoholic fatty liver disease and risk of future cardiovascular events among type 2 diabetic patients. Diabetes. 2005;54(12):3541-6, http://dx. doi.org/10.2337/diabetes.54.12.3541.
6. Dasarathy J, Periyalwar P, Allampati S, Bhinder V, Hawkins C, Brandt P, et al. Hypovitaminosis D is associated with increased whole body fat mass and greater severity of non-alcoholic fatty liver disease. Liver Int. 2013. doi: 10.1111/liv.12312.
7. Li L, Zhang L, Pan S, Wu X, Yin X. No significant association between vitamin D and nonalcoholic fatty liver disease in a Chinese population. Dig Dis Sci. 2013;58(8):2376-82, http://dx.doi.org/10.1007/s10620-013-2658-1.
8. Saverymuttu SH, Joseph AE, Maxwell JD. Ultrasound scanning in the detection of hepatic fibrosis and steatosis. Br Med J (Clin Res Ed). 1986;292(6512):13-5, http://dx.doi.org/10.1136/bmj.292.6512.13. Table 2 -Results of the logistic regression analysis
performed for NAFLD.
Associated factor Odds ratio (95% CI) p
HbA1c 2.997 (1.405-6.391) 0.005
25(OH)D 0.925 (0.889-0.963) ,0.0001
AST 1.103 (1.047-1.161) ,0.0001
9. Jablonski KL, Jovanovich A, Holmen J, Targher G, McFann K, Kendrick J, et al. Low 25-hydroxyvitamin D level is indepen-dently associated with non-alcoholic fatty liver disease. Nutr Metab Cardiovasc Dis. 2013;23(8):792-8, http://dx.doi.org/10.1016/j.numecd. 2012.12.006.
10. Rhee EJ, Kim MK, Park SE, Park CY, Baek KH, Lee WY, et al. High serum vitamin D levels reduce the risk for nonalcoholic fatty liver disease in healthy men independent of metabolic syndrome. Endocr J. 2013; 60(6):743-52, http://dx.doi.org/10.1507/endocrj.EJ12-0387.
11. Targher G, Bertolini L, Scala L, Cigolini M, Zenari L, Falezza G, et al. Associations between serum 25-hydroxyvitamin D3 concentrations and liver histology in patients with non-alcoholic fatty liver disease. Nutr Metab Cardiovasc Dis. 2007;17(7):517-24, http://dx.doi.org/10.1016/j. numecd.2006.04.002.
12. Barchetta I, Angelico F, Del Ben M, Baroni MG, Pozzilli P, Morini S, et al. Strong association between non alcoholic fatty liver disease (NAFLD) and low 25(OH) vitamin D levels in an adult population with normal serum liver enzymes. BMC Med. 2011;9:85, http://dx.doi.org/10.1186/ 1741-7015-9-85.
13. Sazci A, Akpinar G, Aygun C, Ergul E, Senturk O, Hulagu S. Association of apolipoprotein E polymorphisms in patients with non-alcoholic steatohepatitis. Dig Dis Sci. 2008;53(12):3218-24, http://dx.doi.org/10. 1007/s10620-008-0271-5.
14. Huebbe P, Nebel A, Siegert S, Moehring J, Boesch-Saadatmandi C, Most E, et al. APOE epsilon4 is associated with higher vitamin D levels in targeted replacement mice and humans. FASEB J. 2011;25(9):3262-70, http://dx.doi.org/10.1096/fj.11-180935.
15. Cohen-Lahav M, Shany S, Tobvin D, Chaimovitz C, Douvdevani A. Vitamin D decreases NFkappaB activity by increasing IkappaBalpha levels. Nephrol Dial Transplant. 2006;21(4):889-97.
16. Garciade Leon Mdel C, Montfort I, Tello Montes E, Lopez Vancell R, Olivos Garcia A, Gonzalez Canto A, et al. Hepatocyte production of modulators of extracellular liver matrix in normal and cirrhotic rat liver. Exp Mol Pathol. 2006;80(1):97-108, http://dx.doi.org/10.1016/j.yexmp.2005.03.008. 17. Petta S, Camma C, Scazzone C, Tripodo C, Di Marco V, Bono A, et al.