S E Biotechnol. Agron. Soc. Environ. 2014 18(1), 19-31
Isolation of an amylolytic chrysophyte,
Poterioochromonas
sp., from the digestive tract of the termite
Reticulitermes
santonensis
Cédric Tarayre
(1), Julien Bauwens
(2), Catherine Brasseur
(3), Christel Mattéotti
(4),
Jacqueline Destain
(1), Micheline Vandenbol
(4), Daniel Portetelle
(4), Edwin De Pauw
(3),
Éric Haubruge
(2), Frédéric Francis
(2), Philippe Thonart
(5)(1) Univ. Liege - Gembloux Agro-Bio Tech. Bio-Industries Unit. Passage des Déportés, 2. B-5030 Gembloux (Belgium). E-mail: Cedric.Tarayre@ulg.ac.be
(2) Univ. Liege - Gembloux Agro-Bio Tech. Functional and Evolutionary Entomology Unit. Passage des Déportés, 2. B-5030 Gembloux (Belgium).
(3) Univ. Liege. Mass Spectrometry Laboratory. Allée de la Chimie, 3. B-4000 Liege 1 (Belgium). (4) Univ. Liege - Gembloux Agro-Bio Tech. Microbiology and Genomics Unit. Avenue Maréchal Juin, 6. B-5030 Gembloux (Belgium).
(5) Univ. Liege. Industrial Biochemistry and Microbiology Unit. Boulevard du Rectorat, 29. B-4000 Liege 1 (Belgium).
Received on January 3, 2013; accepted on December 11, 2013.
The aim of this work was the isolation and cultivation of amylolytic protists living in the digestive tract of the termite Reticulitermes santonensis (Feytaud). A chrysophyte identiied as Poterioochromonas sp. was isolated in a special medium containing rice grains as a source of carbon and nitrogen. Then, the protist was grown in a medium containing starch as a carbon source, tryptone, and a phosphate buffer at different pH values (5, 6 and 7). Yeast extract was added or not. Ciproloxacin was used to avoid the bacterial development. Other antibiotics were also tested but showed an inhibitive effect on the growth of Poterioochromonas sp. Yeast extract allowed reaching 1.9 (pH 5), 2.3 (pH 6) and 2.2 (pH 7) times higher inal cell concentrations, and 2.8 (pH 5), 2.8 (pH 6) and 2.2 (pH 7) times higher biomass yields. The starch concentration did not decrease in the medium until 3 and 4 days of culture, with and without yeast extract, respectively. Eight days of culture were necessary for hydrolyzing the starch completely, with and without yeast extract. Maltose and maltotriose were detected in the culture media and were hydrolyzed progressively. Maximal maltose concentrations were 0.68, 0.66 and 0.51 g.l-1 in the medium containing yeast extract. Maltotriose concentrations were only 0.17, 0.14 and 0.12 g.l-1. Other glucose oligomers were also detected but in lower quantities. It was determined that the protist developed a weak amylase activity, particularly at a weakly acidic pH (5-6). Such a pH also allowed a better growth of the protist. A maximal amylase activity of 112 nkat.l-1 was measured with yeast extract at pH 5. No other enzymatic activity (protease, cellulase or xylanase) was detected except amylase. The degradation products of starch, which were obtained by enzymatic hydrolysis, allow the identiication of α-amylase, amyloglucosidase and possibly β-amylase activities.
Keywords. Amylases, Chrysophyceae, in vitro culture, culture media, protista, Reticulitermes.
20 Biotechnol. Agron. Soc. Environ. 2014 18(1), 19-31 Tarayre C., Bauwens J., Brasseur C. et al.
1. INTRODUCTION
The symbiotic microorganisms living in the wood-feeding termite gut are necessary to lignocellulose digestion and nitrogen metabolism (Brune et al., 2010). Termites are classiied into two groups: lower termites, which harbor different kinds of protists in their guts, and higher termites, which do not contain any protists (Ohkuma, 2008). Lower termites can degrade lignocellulose by the action of their own enzymes combined with microbial enzymes (Brune et al., 2010).
The digestive tract of termites is divided into three parts: foregut, midgut and hindgut. The hindgut of lower termites is a bioreactor containing numerous packed symbionts: bacteria, molds, archaea and protists (Ohkuma, 2008). It is known that the termite hindgut harbors specialized microorganisms, which help the insect to degrade wood ibers by secreting cellulases and hemicellulases (Nation, 2008). Protists are thought to play a role in hydrolysis of cellulose and are associated with bacteria in complex symbioses (Odelson et al., 1985a). The main lagellates living in the termite gut belong to three groups: Oxymonadida, Trichomonodida and Hypermastigida. The last two groups belong to the class of Parabasalia. These protozoa are only found in the termite gut (Nakashima et al., 2002). Those symbiotic microorganisms are thought to be necessary to the survival of termites (Moriya et al., 1998).
Although poorly described in literature, amylases can also be produced by protists. Alpha-amylase activity was detected from the host gut tissue and hindgut symbionts (Tartar et al., 2009). Also, amylase activity was found in Trichomitopsis termopsidis (Cleveland) (Odelson et al., 1985b). The termites Macrotermes michaelseni (Sjöstedt), Macrotermes bellicosus (Smeathman), Macrotermes barneyi (Light) and Pseudacanthotermes militaris (Hagen) also contain amylase activity in the mid- and hindgut (Rouland-Lefèvre, 2000). Little is known about the protist metabolism because their culture is far from being easy (Inoue et al., 2007).
There are few cases of protist isolations. The aim of this work is to isolate amylolytic protists from the
gut of the termite Reticulitermes santonensis. Here, we suggest a method of isolation of amylolytic protists from the termite gut with rice grains, providing starch as a carbon source and proteins. An antibiotic puriication is also necessary to prevent bacterial contaminations.
2. MATERIALS AND METHODS
2.1. Organisms
Reticulitermes santonensis (Feytaud) was obtained from the Island of Oleron (France). Trees showing characteristics of termite infestation (death or galleries) were cut into sections. Contaminated pieces were packed and transported in thick plastic bags. The termites were cultivated in darkness for 6 months at 27 °C with a relative humidity level of 70%. They were fed with pine wood, which was gradually replaced by poplar wood.
2.2. Dissection of termites
The contents of digestive tracts from 25 termites were introduced into a tube containing 2 ml of medium. The termites were washed in ethanol, water and held with two dissection forceps. One of them was used to hold the head and the other to remove the cuticle at the back of the termite. The digestive tracts were then extirpated and inserted into the tube. A sterile needle was used to pierce the digestive tracts before putting the contents of the tube in a lask containing 150 ml of isolation medium.
2.3. Isolation medium
The choice of the isolation medium was based on a previous study (Nola et al., 2003). It consisted of mineral water containing Ca2+ 65 mg.l-1, Mg2+
18 mg.l-1, Na+ 44 mg.l-1, K+ 2.5 mg.l-1, SO
42- 40 mg.l-1,
HCO3- 305 mg.l-1 and sterile rice grains (100 rice
grains.l-1). The lasks used for isolation contained
150 ml of medium and were incubated at 30 °C and stirred 60 rpm. Different antibiotics (Table 1) were hydrolysés. Les concentrations maximales en maltose ont atteint 0,68, 0,66 et 0,51 g.l-1 dans le milieu contenant l’extrait de levure. Les concentrations en maltotriose étaient seulement de 0,17, 0,14 et 0,12 g.l-1. D’autres oligomères de glucose ont aussi été détectés, mais en quantités plus faibles. Il a été montré que le protiste a développé une faible activité amylase, particulièrement à pH légèrement acide (5-6). Un tel pH a aussi permis une meilleure croissance du protiste. Une activité amylase maximale de 112 nkat.l-1 a été mesurée à pH 5 en présence d’extrait de levure. Aucune autre activité enzymatique (protéase, cellulase, xylanase) n’a été détectée, à l’exception de l’amylase. Les produits de dégradation de l’amidon qui ont été obtenus par hydrolyse enzymatique permettent d’identiier des activités enzymatiques de type α-amylase, amyloglucosidase et, éventuellement, β-amylase.
used to obtain pure cultures of protists. All of the antibiotic experiments were made in lasks containing culture medium. Antibiotic solutions were prepared at high concentrations, ilter-sterilized and added to the lasks to reach a inal volume of 150 ml. Antibiotic concentrations were chosen further based on the analysis of the results of antibiograms done on the two contaminant bacterial strains and involving a normalized method which led to the determination of Minimal Inhibitory Concentrations. Each antibiotic was tested at twice the concentration of the MIC value (for contaminating bacteria 1 or 2) and was added to the culture medium.
Putative phylogenetic afiliation of the protist isolated. DNA was extracted from a 7-day culture sample of protist cells with the Wizard Genomic DNA Puriication Kit (Promega Benelux BV Branch Ofice, Schipholweg 1, 2316 XB Leiden, The Netherlands). The method of DNA extraction from tissue culture cells was modiied: Trypsin was not used and, after adding Nuclei Lysis Solution, the samples followed a speciic
temperature program (10 min at -800 °C, 10 min at 800 °C, 5 min at -800 °C, 5 min at 800 °C). The other steps were not modiied. The primers used were ITS1 and ITS4 (ampliication of 5.8S ribosomal DNA - large subunit), and two further primers were used to amplify 18S ribosomal DNA – small subunit (Primer
1: 5’-TGATCCTTCTGCAGGTTCACCTAC-3’
[Medlin et al., 1988]; Primer 2:
5’-CTTTCGATGGTAGTGTATTGGACTAC-3’ [Karnati et al., 2003]). Cycling conditions were: 2 min of denaturation (94 °C), 35 cycles of ampliication composed of 1 min at 94 °C, 65 sec at 37 °C, 3 min at 72 °C, and a inal extension step of 6 min at 72 °C (Karnati et al., 2003). PCR products were sequenced by the Sanger method of the irm Progenus (Gembloux, Belgium). The sequences were aligned with the Vector NTI® program and compared with the GenBank database. A phylogenetic tree was designed with the MEGA 5.0® software using the Neighbor-Joining method. Bootstrap values were expressed as percentages of 1,000 replicates. The tree was drawn to scale and the distance bar indicates the number of base substitutions per site. The tree was developed with the sequences of 18S rDNA of Chrysophyceae available on GenBank. The 18S rDNA sequences of protists extracted from the gut of termites were also added to the tree.
2.4. Culture conditions
Two media were used to investigate the growth of protozoa:
– Culture Medium 1: 10 g.l-1 soluble starch (Sigma
Aldrich), 5.5 g.l-1 tryptone (Organotechnie, La
Courneuve, France), 1.34 g.l-1 NaH
2PO4.2H2O and
30 mg.l-1 ciproloxacin (ilter-sterilized before
addition, Sigma-Aldrich), pH was adjusted to 4, 5, 6, 7, 8, 9 with H3PO4 1 M or NaOH 1 M;
– Culture Medium 2: 10 g.l-1 soluble starch, 5.5 g.l-1
tryptone, 1,34 g.l-1 NaH
2PO4.2H2O, 4 g.l-1 yeast
extract (Organotechnie, La Courneuve, France) and 30 mg.l-1 ciproloxacin (ilter-sterilized before
addition), pH adjusted to 4, 5, 6, 7, 8, 9.
The ciproloxacin concentration was chosen in accordance with the results of the antibiograms. The lasks were illed with 150 ml of medium, inoculated at an initial concentration of 5.104 cells.ml-1 and agitated
(60 rpm) at a temperature of 30 °C. All the quantitative results obtained from protist cultures (cell, glucose, maltose, maltotriose and starch concentrations) were analyzed with the MINITAB16® statistical software, and all the measurements were performed in triplicate. Normality tests and tests for equal variances were applied to all the series of data before achieving a variance analysis.
Table 1. Minimal Inhibitory Concentrations (M.I.C.) for the two main contaminant bacterial strains of the culture medium — Concentrations Minimales Inhibitrices (C.M.I.) relatives aux deux principales souches bactériennes contaminant le milieu de culture.
Antibiotic used M.I.C. for
strain 1 (mg.l-1) M.I.C. for strain 2 (mg.l-1)
Penicillin 512 < 0.25
Gentamycin < 0.25 128
Ciproloxacin 16 < 0.25
Streptomycin 0,5 8
Vancomycin 128 0.25
Kanamycin 0.25 < 0.25
Tetracyclin 2 64
Erythromycin 64 < 0.25
Chloramphenicol 16 8
Rifampicin 2 16
Ampicillin 256 256
22 Biotechnol. Agron. Soc. Environ. 2014 18(1), 19-31 Tarayre C., Bauwens J., Brasseur C. et al.
2.5. Quantiication of glucose, glucose oligomers and starch
Glucose and glucose oligomers were quantiied using a High-Performance Anion Exchange Chromatograph coupled with a Pulsed Amperometric Detector. The apparatus was a Dionex DX500 chromatographic system operating at 1 ml.min-1. The stationary phase
consisted of a CarboPac PA 100 column (250 x 4 mm) with a pre-column PA 100 (50 x 4 mm) (DIONEX Corp, Sunnyvale, USA). The volume injected was always 25 µl. Temperature was set to 35 °C. Four mobile phases were used: NaOH 100 mM (Solvent A), NaOH 100 mM + sodium acetate buffer 600 mM (Solvent B), NaOH 500 mM (Solvent C) and H2O
MilliQ (Solvent D). An acetate gradient was used to elute the glucose oligomers (from 100 to 70% of Solvent A, from 0 to 30% of Solvent B) for 10 min. The column was washed with 50% of Solvent B and 50% of Solvent C for 9.9 min. Finally, conditioning was performed with 50% of Solvent A and 50% of Solvent D for 9.9 min. Maltose and maltotriose were chosen as calibration oligomers. Higher mass glucose oligomers were measured with a mass spectrometer. A matrix of 2,5-dihydroxybenzoic acid (DHB) was used at 20 mg.ml-1 in acetonitrile/water 0.1% triluoroacetic
acid. Samples were prepared with a mixture of 1 µl of hydrolysate solution and 1 µl of matrix. Measurements were taken with Ultralex II TOF/TOF (Bruker Daltonics) equipped with smartbeam. Calibration was achieved with peptide calibration standard II solution (Bruker). Starch concentrations were determined using a spectrophotometric measurement after iodine staining, using a method developed before (Jarvis et al., 1993). The degradation of starch was measured in uninoculated lasks at pH values of 5, 6, 7 and 8 to check a potential degradation. This experiment was carried out in triplicate.
2.6. Enzymatic assays
The following activities were tested: endo-1,4-β-D-xylanase, endo-1,4-β-D-glucanase, amylase and protease. The samples (80 µl of crude culture and 80 µl of a sample iltered on a cellulose acetate membrane; 0.45 µm of porosity) were dropped on Petri dishes illed with different agar media. Anti-protease (Complete, Mini, EDTA-Free Protease Inhibitor Cocktail Tablets, Roche) was added to the culture samples except for protease assays. For each Petri dish, water (80 µl, negative answer) and diluted enzyme (80 µl of concentrated endo-1,4-β-D-xylanase, cellulase, amylase or bromelain 2.5.103 nkat.ml-1, positive answers) were
both added. Enzymatic activities were calculated on the basis of the number of nkat.g-1 mentioned for each
enzyme. The following media were used:
– Endo-1,4-β-D-xylanase activity:1 g.l-1 AZCL-xylan
medium, Na acetate 25 mM (pH 4.7), 16 g.l-1 agar;
– Cellulase activity: 1 g.l-1 AZCL-HE-cellulose
medium, Na acetate 25 mM (pH 4.5), 16 g.l-1 agar;
– Amylase activity: 1 g.l-1 AZCL-amylose medium,
Na acetate 100 mM (pH 6), 16 g.l-1 agar;
– Protease activity: 1 g.l-1 AZCL-casein medium, Na
phosphate 100 mM (pH 7), 16 g.l-1 agar.
Buffers and pH values were chosen using the manufacturer’s suggestions (Megazyme International Ireland - Bray Business Park - Bray, Co. Wicklow, Ireland). Petri dishes were kept at 30 °C for one day before reading the results. The principle of AZCL media is based on azurine cross-linked polymers (xylan, cellulose, starch and casein in this case). When an enzymatic activity appears, the corresponding polymer is degraded and azurine is released. Then, big blue stains can be observed on the agar plates (Coman et al., 2008).
3. RESULTS
3.1. Protist isolation and identiication
Bacteria contaminated the culture medium at a mean concentration of 108 Colony Forming Units.ml-1. No
colonies of molds were observed, and it was necessary to inhibit bacterial contamination. Minimal Inhibitory Concentrations (MIC) are presented in table 1. The effect on bacteria and protists was almost always negative, except for ciproloxacin, which was able to allow protist growth only. The action of ciproloxacin consists in inhibiting DNA gyrase, an enzyme that allows transcription and replication of DNA. Ciproloxacin is effective on Gram+ and Gram- bacteria
(Saeb-Parsy et al., 1999). Consequently, ciproloxacin was used at a concentration of 32 mg.l-1 in the culture
medium and allowed to reach a bacterial contamination of 2-3.104 CFU.ml-1. Then, Medium 1 (see 2.4.) was
tested and allowed to reach a bacterial concentration of less than 100 CFU.ml-1 and was chosen as the culture
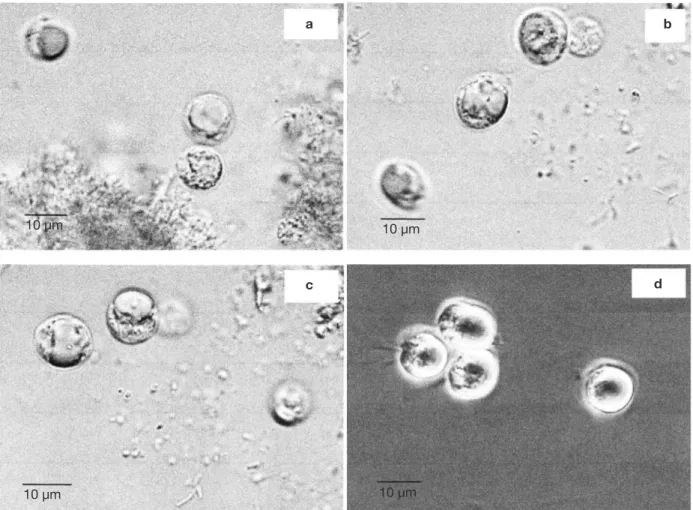
medium. Ciproloxacin led to the development of a unique protist, showing a circular shape and a size of about 10 µm (Figures 1a, 1b, 1c, 1d).
About 240 µg of DNA were extracted from 6 ml of a culture containing 5.106 cells.ml-1. The PCR
the sequences available on GenBank after aligning with the Vector NTI® program. The NCBI-BLAST program (Altschul et al., 1990) was used to identify the sequences. It appeared that the protist is related to Poterioochromonas (96% of sequence similarity for the 18S rDNA) and Ochromonas (96% of sequence similarity for the 18S rDNA) genera. The sequence of the 5.8S rDNA led to the identiication of the genus Poterioochromonas (94% of sequence similarity for the 5.8S rDNA with Poterioochromonas malhamensis [Pringsheim]). Consequently, Poterioochromonas sp. (GenBank ID: AY699607.1) was found to be the most similar microorganism to the protist in the culture medium. The phylogenetic tree based on 18S rDNA sequences is presented in igure 2.
3.2. Growth conditions of the protist
Two different media were tested to make the growth curves: Medium 1 and Medium 2 (Medium 1 added
with yeast extract, 4 g.l-1). In both media, the bacterial
contamination was less than 100 CFU.ml-1. Various
parameters were measured during the growth of protists: cell concentrations, pH, glucose concentrations, maltose and maltotriose concentrations and, inally, starch concentrations. At pH 4 and 9, no growth was observed, the starch was not consumed and no glucose was produced. However, the protist was able to survive at pH 8.
The growth observed with yeast extract was signiicantly different from the growth observed without yeast extract (p < 0.05), except for pH 7 (Figures 3a and 3b). There was also a signiicant difference between the inal cell concentrations at pH 5, 6 and 7. Indeed, pH 6 allowed the highest cell concentration to be reached, which was signiicantly different from those obtained with pH values of 5 and 7. At a speciic pH value (5, 6 or 7), yeast extract increases the inal cell concentrations signiicantly. However, the pH of the culture media was not stable.
Figure 1. a, b, c, d. Various photographs of a same sample of protist isolated from the gut of Reticulitermes santonensis growing in the rice medium after addition of ciproloxacin (pictures taken using an electron microscope, images obtained with an AxioCam camera) — Différentes prises de vue d’un même échantillon de protiste isolé du tube digestif de Reticulitermes santonensis se développant dans le milieu contenant du riz après addition de ciproloxacine (images photographiées au microscope électronique, acquises à l’aide d’une caméra AxioCam).
a
c d
b
10 µm 10 µm
24
Biotechnol.
Agr
on. Soc. Envir
on.
2014
18
(1), 19-31
Tarayre C., Bauwens J., Brasseur C. et al.
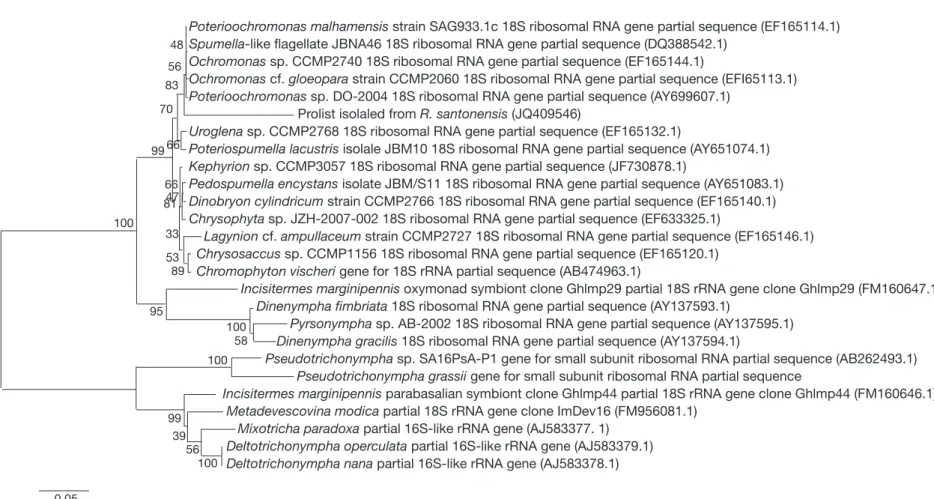
Figure 2. Phylogenetic tree showing the phylogenetic position of the protist (GenBank ID: JQ409546) — Arbre phylogénétique montrant la position du protiste (identiiant sur GenBank: JQ409546).
Protists were isolated from termites and their ribosomal SSU DNA sequences were determined and included in the tree — Les protistes issus de termites, dont les séquences ADN de la
petite sous-unité ribosomique ont été déterminées, sont inclus dans l’arbre
Poterioochromonas malhamensis strain SAG933.1c 18S ribosomal RNA gene partial sequence (EF165114.1) Spumella-like lagellate JBNA46 18S ribosomal RNA gene partial sequence (DQ388542.1)
Ochromonas sp. CCMP2740 18S ribosomal RNA gene partial sequence (EF165144.1)
Ochromonas cf. gloeopara strain CCMP2060 18S ribosomal RNA gene partial sequence (EFI65113.1) Poterioochromonas sp. DO-2004 18S ribosomal RNA gene partial sequence (AY699607.1)
Prolist isolaled from R. santonensis (JQ409546)
Uroglena sp. CCMP2768 18S ribosomal RNA gene partial sequence (EF165132.1)
Poteriospumella lacustris isolale JBM10 18S ribosomal RNA gene partial sequence (AY651074.1) Kephyrion sp. CCMP3057 18S ribosomal RNA gene partial sequence (JF730878.1)
Pedospumella encystans isolate JBM/S11 18S ribosomal RNA gene partial sequence (AY651083.1) Dinobryon cylindricum strain CCMP2766 18S ribosomal RNA gene partial sequence (EF165140.1) Chrysophyta sp. JZH-2007-002 18S ribosomal RNA gene partial sequence (EF633325.1)
Lagynion cf. ampullaceum strain CCMP2727 18S ribosomal RNA gene partial sequence (EF165146.1) Chrysosaccus sp. CCMP1156 18S ribosomal RNA gene partial sequence (EF165120.1)
Chromophyton vischeri gene for 18S rRNA partial sequence (AB474963.1)
Incisitermes marginipennis oxymonad symbiont clone Ghlmp29 partial 18S rRNA gene clone Ghlmp29 (FM160647.1) Dinenympha imbriata 18S ribosomal RNA gene partial sequence (AY137593.1)
Pyrsonympha sp. AB-2002 18S ribosomal RNA gene partial sequence (AY137595.1) Dinenympha gracilis 18S ribosomal RNA gene partial sequence (AY137594.1)
Pseudotrichonympha sp. SA16PsA-P1 gene for small subunit ribosomal RNA partial sequence (AB262493.1) Pseudotrichonympha grassii gene for small subunit ribosomal RNA partial sequence
Incisitermes marginipennis parabasalian symbiont clone Ghlmp44 partial 18S rRNA gene clone Ghlmp44 (FM160646.1) Metadevescovina modica partial 18S rRNA gene clone ImDev16 (FM956081.1)
Mixotricha paradoxa partial 16S-like rRNA gene (AJ583377. 1) Deltotrichonympha operculata partial 16S-like rRNA gene (AJ583379.1) Deltotrichonympha nana partial 16S-like rRNA gene (AJ583378.1)
0.05
48 56
56 83
70
100 99
99 95
89 53 33 8147 66
39 66
100 100
For both media, the strongest increase of pH was observed for an initial pH of 6 (Figures 4a and 4b). The dry matter was weighed at the end of ive culture periods. Therefore, it was established that 1 g of dry matter is equal to 6.1.109 ± 109 cells. Consequently,
it was possible to calculate conversion rates (biomass vs carbon source), considering glucose, maltose and maltotriose concentrations measured in the culture media. Conversion rates were 0.037 ± 0.001, 0.04 ± 0.001 and 0.0229 ± 0.0003 at pH 5, 6 and 7, respectively (Medium 1). These results show that preferential pH values for growth are at weakly acidic values. Those results were conirmed in Medium 2. Conversion rates were 0.103 ± 0.008, 0.11 ± 0.01 and 0.051 ± 0.006 at pH 5, 6 and 7, respectively. All these values were found to be signiicantly different.
3.3. Hydrolysis products of starch
Normality tests and tests for equal variances were done for each medium and each day, and were found to be positive (p > 0.05). Neither of the culture media contained any glucose at the start. For Culture Medium 1
(without yeast extract), the glucose concentration for pH 5 was signiicantly different (p < 0.05) at pH 6 after 7 days. For Culture Medium 2, there was a signiicant difference between the three pH values after day 3. In each case, pH 5 provided the highest glucose concentration (Figures 5a and 5b).
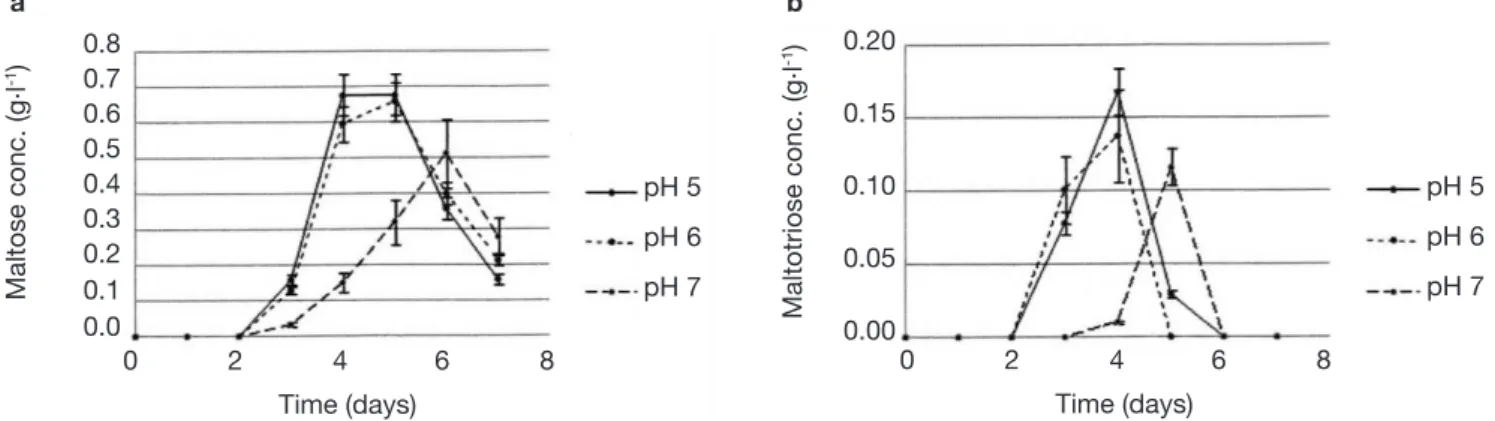
The analysis of glucose oligomers was performed on Medium 2 (added with yeast extract), which provided the best results (Figures 6a and 6b). Normality tests and tests for equal variances were achieved for each medium and each day and were positive (p > 0.05). Very low concentrations of maltotetraose and maltopentose were detected, but were not quantiiable. The highest concentrations of maltose and maltotriose were found for pH values of 5 and 6. There were no signiicant differences between the concentrations of these sugars for pH 5 and 6 (in both media). Mass spectrometry was used to identify a wide range of glucose oligomers. It was possible to detect oligomers up to a size of sixteen units of glucose. The mass spectrum was obtained from a sample of the Culture Medium 2 after 3 days at pH 5. Other spectra displayed lower peaks, although glucose oligomers were also detected (data not shown).
0 2 4 6 8
Time (days)
pH 5 pH 6 pH 7
log
10
(cell.conc.[cell
. ml -1])
8.0 7.5 7.0 6.5 6.0 5.5 5.0 4.5 4.0
0 2 4 6 8
Time (days)
pH 5 pH 6 pH 7
log
10
(cell.conc.[cell
. ml -1])
8.0 7.5 7.0 6.5 6.0 5.5 5.0 4.5 4.0
a b
Figure 3. Growth curves of Poterioochromonas sp. in the culture media 1 (a) and 2 (b) — Courbes de croissance de Poterioochromonas sp. dans les milieux de culture 1 (a) et 2 (b).
0 2 4 6 8 10 12
Time (days)
pH 5 pH 6 pH 7
pH
9.0 8.5 8.0 7.5 7.0 6.5 6.0 5.5 5.0 4.5 4.0
a
0 2 4 6 8 10 12
Time (days)
pH 5 pH 6 pH 7
pH
8.5 8.0 7.5 7.0 6.5 6.0 5.5 5.0 4.5 4.0
b
26 Biotechnol. Agron. Soc. Environ. 2014 18(1), 19-31 Tarayre C., Bauwens J., Brasseur C. et al.
The starch concentrations were also measured (Figures 7a and 7b). Each medium was submitted every single day to normality tests and tests for equal variances which proved positive (p > 0.05). There were no signiicant differences between the starch concentrations in Medium 1 (without yeast extract) for different pH values. For Medium 2 (added with yeast extract), signiicant differences were observed for days 4, 5 and 6. Starch concentrations measured at pH 7 differed (p < 0.05) from pH 5 and 6 and were higher (Figure 7b). In both media, the starch completely disappeared, but this was signiicantly quicker in the medium containing yeast extract. The degradation of starch was also measured in uninoculated medium (pH 5, 6, 7 and 8) to check the potential degradation induced by the medium components, pH or temperature. No degradation was observed in such cases.
3.4. Investigation of enzymatic activities
Agar plates added with different media were tested to investigate the enzymatic activities of the protist:
amylase, protease, cellulase and xylanase. No protease, cellulase or endo-1,4-β-D-xylanase were detected.
However, it was possible to conirm amylase activities. These assays were carried out on the protist growing in Medium 2 (added with yeast extract). Amylase activity was observed on Petri dishes, appeared on day 3 and remained in the culture medium until the end of the culture time (10 days). The contaminant bacteria were grown in the culture medium without ciproloxacin. The protist was unable to grow without antibiotics because of the development of bacteria in the culture medium. Agar plates were tested with samples collected from these cultures, and no amylase activity was detected.
Filtration of the culture medium was performed using a cellulose acetate membrane (0.45 µm of porosity) to remove the cells. Amylase activity was detected both in the crude and the membrane-iltered samples. The intensity of coloration depends on amylase activity and was found to be the same for both types of samples.
0 2 4 6 8 10 12
Time (days)
pH 5 pH 6 pH 7
a
Glucose conc. (g
. l -1)
6 5 4 3 2 1 0
0 2 4 6 8 10 12
Time (days)
pH 5 pH 6 pH 7
b
Glucose conc. (g
. l -1)
6 5 4 3 2 1 0
Figure 5. Evolution of glucose concentrations in the cultures of Poterioochromonas sp. in the culture media 1 (a) and 2 (b) — Évolution de la concentration en glucose des cultures de Poterioochromonas sp. dans les milieux de culture 1 (a) et 2 (b).
0 2 4 6 8
Time (days)
0 2 4 6 8
Time (days) pH 5
pH 6 pH 7
pH 5 pH 6 pH 7 0.8
0.7 0.6 0.5 0.4 0.3 0.2 0.1 0.0
Maltose conc. (g
. l -1)
Maltotriose conc. (g
. l -1)
a b
0.20
0.15
0.10
0.05
0.00
4. DISCUSSION
4.1. Protist identiication
The protists Ochromonas and Poterioochromonas sp. belong to the Phylum of Chrysophyta, which are unicellular microorganisms that are able to grow in fresh or salt water (Raven et al., 2003). Ochromonas and Poterioochromonas sp. are closely related as chrysomonads (Moser et al., 2011). The class of Chrysophyceae is described as a highly diversiied group (Andersen et al., 1999); chrysophytes are heterokont cells (displaying lagella of unequal length), which are able to obtain energy from photosynthesis and heterotrophy (Nicholls et al., 2003). The morphology of Ochromonas danica (Pringsheim), a typical chrysophyte, was previously described; typical cells of chrysophytes contain a nucleus, lagella, contractile vacuoles, Golgi bodies, chloroplasts, mitochondria and chrysolaminarin vesicles (Gibbs, 1981).
The bootstrap value observed in the phylogenetic tree is low. The most closely related protist was Poterioochromonas sp. (GenBank ID: AY699607.1) and the protist, which was isolated, was phylogenetically closer to Poterioochromonas than Ochromonas species. Poterioochromonas and Ochromonas genera were also found to be morphologically alike (Andersen et al., 1992), and the morphology of the present protist was also similar. However, it is generally accepted that a bootstrap value of 70-80% is enough to conirm a clade (Gibson et al., 2004). Ochromonas and Poterioochromonas species are very close phylogenetically. The phylogenetic tree obtained here can be compared with the phylogenetic trees reported before (Andersen et al., 1999). It was found that several species of Ochromonas had a polyphyletic relationship. Phylogenetic trees were designed with the genera Poterioochromonas and Ochromonas, and both were classiied in clade C. Ochromonas tuberculata (Hibberd) was the only protist to be classiied in a
different clade. However, higher bootstrap values were calculated (Andersen et al., 1999). The phylogenetic tree was also built on the basis of protists that are found in termite guts. Dinenympha and Pyrsonympha genera belong to Oxymonadidae. Pseudotrichonympha, Metadevescovina, Mixotricha and Deltotrichonympha genera belong to the class of Parabasalia. The phylogenetic tree clearly shows two groups. Those groups are perfectly deined and characterized by a bootstrap value of 100. Consequently, it is possible to conclude that oxymonads are more closely related to chrysophytes (such as Poterioochromonas sp.) than Parabasalia. Oxymonads also have a particular cellular structure. They consist of a special group that does not include any energy-generating organelles such as mitochondria or hydrogenosomes, and their intracellular membrane system is poorly developed. Another aspect is how dificult their culture is (Moriya et al., 1998). Oxymonadidae comprise ive families and include Dinenympha, Pyrsonympha and Oxymonas genera.
The cell morphology observed here is comparable with the descriptions given before (Nicholls et al., 2003). The protist is related to species belonging to the Ochromonas and Poterioochromonas genera that are morphologically close. Ochromonas cells have a size of 2 to 30 µm with one long lagellum and one short lagellum, one or two chloroplasts and occasionally a stigma. Poterioochromonas cells display the same characteristics. They also have two lagella, but the short one is protected by a chitinous lorica at the end of a stalk (Andersen et al., 1992). Although the lorica is not visible on the protist that was isolated, the morphology corresponds to a description given previously (Guo et al., 2010). In their study, the lorica structure was not observed on the strain of Poterioochromonas sp.
4.2. Protist growth and effect of yeast extract
Yeast extract allowed a better development in the culture medium, bringing more minerals, trace elements,
0 2 4 6 8 10
Time (days)
0 2 4 6 8 10
Time (days) pH 5
pH 6 pH 7
pH 5 pH 6 pH 7
a b
10 8 6 4 2 0
10 8 6 4 2 0
Star
ch conc. (g
. l -1)
Star
ch conc. (g
. l -1)
28 Biotechnol. Agron. Soc. Environ. 2014 18(1), 19-31 Tarayre C., Bauwens J., Brasseur C. et al. peptides and vitamins, and also resulted in the faster
consumption of the carbon source. A pH value of 6 seems to be optimal for the growth of protists. On the other hand, given that the pH shows a strong tendency to increase, pH 7 is also suitable, but varies too quickly. Growth curves with different pH values suggest that a weakly acidic pH is more conducive to the growth of protists than a weakly alkaline pH. The optimal pH for the growth of protozoa is generally found to be between 6 and 8 (Sumbali et al., 2009). The production of ammonia by the planktonic protists was cited before (Dolan, 1997), which can explain the increase of pH observed in the culture medium. The growth eficiency of phagotrophic protists is generally comprised between 10 and 40%, while the remaining amount of carbon source (90-60%) is lost in excretion or respiration (Sherr et al., 2011). However, the growth eficiency observed here was quite low (with a maximal biomass yield of 0.11).
Yeast extract had a signiicant effect on protist growth, biomass yields, glucose and starch concentrations. All these parameters are bound. An increase of glucose concentration is the result of starch hydrolysis, caused by the secretion of an amylase by the protist. Starch is hydrolyzed, releasing glucose units that can be assimilated through a speciic metabolism, leading to a speciic biomass yield. The inal cellular concentrations depend on the amount of starch that was consumed and glucose that was not assimilated by the protist. Yeast extract made it possible to reach 1.9 (pH 5), 2.3 (pH 6) and 2.2 (pH 7) times higher inal cell concentrations. It also led to 2.8 (pH 5), 2.8 (pH 6) and 2.2 (pH 7) times higher biomass yields. The strongest effect was observed at pH 5 and 6. A pH value of 6 seems more suitable for the protist development in regard to cell concentrations and biomass yields. The evolution of glucose and starch concentrations is more representative of amylase activity, although it is also bound to cell growth. The evolution of glucose concentrations reveals a strongest amylase activity at pH 5, with or without yeast extract. The latter causes a faster production of glucose from starch as well as higher glucose concentrations. Consequently, Poterioochromonas sp. secretes an amylase for which the optimal pH is about 5. Trace elements matter a lot as well. These metals are often used to boost enzymatic activities of bacteria and molds (Gupta et al., 2010; Mahdavi et al., 2010). In this case, trace elements are provided by yeast extract. Vitamins can also play a role in the increase of amylase activities.
4.3. Enzymatic activities of Poterioochromonassp.
Studies on amylase activities in chrysophytes are seldom. Two days were necessary to detect such amylase activity. The excretion of an amylase
produced by Ochromonas sp. was previously studied (Pringsheim, 1952). It was observed that the protist was able to ingest and digest starch, casein, oil droplets and small organisms; it was also found that Ochromonas was able to grow in a medium containing glucose, sucrose, fructose, galactose or starch. The production of an amylase by Poterioochromonas stipitata (Scherffel) was suggested on the basis of the liquefaction of a starch gel (Isenberg, 1962). Amylase activity was also revealed in the mid- and hindgut of the termite Odontotermes obesus (Rambur) (Singh, 1976). The optimal pH for the enzyme was 5.8-6.6. The highest concentrations of glucose produced by the highest activities are found for an initial pH of 5 in this case. The maximal amylase activity was observed after 5 days at an initial pH of 5 (Culture Medium 2), which relates to a pH of 5.7-5.8, and sticks to what has been observed so far. Our strain produces an extracellular amylase, taking account of the results observed on AZCL-amylose medium inoculated with both crude and iltered culture samples. Moreover, the absence of an amylase activity produced by the contaminating bacteria leads to the conclusion that this activity comes only from the protist. Amylase activities can be calculated from the glucose concentrations. One katal (kat) of amylase activity is deined as the amount of enzyme able to provide 1 mol of glucose in 1 sec. Yeast extract boosted the secretion of amylase signiicantly. With yeast extract, the maximal amylase activity was detected after 5 days of culture, with values of 112 and 59 nkat.l-1 at pH 5 and 6, respectively. At pH 7,
7 days were necessary to reach a value of 34 nkat.l-1.
However, without yeast extract, the maximal amylase activity was measured after 7 days of culture, with values of 68 and 34 nkat.l-1, at pH 5 and 7, respectively.
At pH 6, a maximal activity of 35 nkat.l-1 was reached
after 10 days.
maltotriose and some glucose oligomers of more than 3 units of glucose in low quantities. Consequently, the amylase activities developed by the protist should include amyloglucosidase, α-amylase and possibly β-amylase. Indeed, maltose should stem from a β-amylase activity or α-amylase activity hydrolyzing maltotetraose into two molecules of maltose. Maltose and maltotriose concentrations evolved in the same way. At pH 7, maltose and maltotriose needed more time to be detectable. Three days were necessary before detecting maltose and maltotriose. Maximal maltose concentrations were 0.68, 0.66 and 0.51 g.l-1 at
pH 5, 6 and 7, respectively, while maximal maltotriose concentrations were 0.17, 0.14 and 0.12 g.l-1. There
were no signiicant differences between the results found at pH 5 and 6.
Starch hydrolysis may also release isomaltose (maltose isomer), panose and isopanose (maltotriose isomers). These molecules contain α-(1,6)-linkages and come from reticulated branches of starch. In this study, starch stemmed from potatoes, usually composed of 21% amylose and 79% amylopectin. Amylose is a linear chain that mainly consists of α-1,4-linked glucose residues, although α-1,6-linkages can be observed (about one branch per 1,000 residues). Amylopectin is more branched. It is considered that approximately 5% of glucose residues have both α-1,4- and α-1,6-linkages (Mittal, 2011). Maltose (Degree of Polymerization: 2) and maltotriose (DP: 3) were used as calibration oligomers. However, a High-Performance Anion Exchange Chromatograph coupled with a Pulsed Amperometric Detector did not allow separating isomers. Consequently, the peaks also contain signals coming from minority components: isomaltose, panose and isopanose.
As far as we know, this is the irst time a chrysophyte has been extracted from the termite gut and subsequently cultivated. Mixotrophy gives the chrysophytes a real advantage relating to their ability to develop in a particular environment. There are different types of mixotrophy. Ochromonas danica and P. malhamensis can facultatively use phototrophy or phagotrophy and osmotrophy (Holen et al., 1995). The conditions of the termite gut force the protist to produce its energy using heterotrophic respiration. The termite gut is not completely anoxic; there is an oxygen gradient between the oxic gut epithelium and the anoxic gut contents (Brune et al., 1995). Although available in low quantities, oxygen can be used for respiration. The pH in the gut of R. santonensis is close to neutrality (6.8 in the midgut and 6.4 in the paunch) (Ebert et al., 1997). To our knowledge, protists belonging to the genus Poterioochromonas are not able to grow at highly acidic pH, which contrasts with Ochromonas species (Moser et al., 2011). It may sound strange to ind amylolytic protists in termite guts. Moreover, this is the
irst time that a chrysophyte has been extracted from a termite gut. Reticulitermes santonensis was grown on poplar wood in the present study. Poplar wood is mainly composed of cellulose (45%), hemicelluloses (25%) and lignin (20%) (Magel, 2001). The trees control their metabolism by sensing critical shortening of the photoperiod. When environmental conditions become too harsh, poplars alter their metabolic pathways and synthetize storage molecules, such as starch (Zawaski et al., 2012). This could explain the presence of amylolytic protists inside termite guts. Another point is that the isolated chrysophyte can metabolize glucose, composing cellulose. Another explanation may be that Poterioochromonas sp. uses glucose resulting from cellulose hydrolysis by the cellulolytic microlora. The phylogenetic tree also showed the relationship between chrysophytes and oxymonads, which are natural residents of lower termite guts.
5. CONCLUSION
Poterioochromonas sp. was isolated from the gut of the lower termite R. santonensis, which offers acceptable conditions for the development of protists. Chrysophytes, such as Poteriochromonas and Ochromonas genera, are mixotrophic, and it is the irst case of isolation of such microorganisms from the gut of termites. Poterioochromonas sp. was found to be closer to oxymonads than parabasalids. The isolation method, which was used in the present study, may induce further experiments. It is true that isolating protists is particularly dificult, and antibiotic methods may be an eficient way of reducing or doing away with bacterial contaminations. New techniques of isolation such as antibiotic treatments combined with low speed density gradient centrifugation could be tried out.
The protist grew at a pH close to neutrality and produced an extracellular amylase, which hydrolyzed starch in glucose and glucose oligomers. However, the activity was quite low. High-Performance Anion Exchange Chromatography and Mass Spectrometry identiied oligomers as being progressively hydrolyzed before being metabolized. No other enzymatic activity was detected. Another study including research of amylase genes in the protist DNA should be complementary to this work. Then, on the basis of the sequences, it may be possible to conirm the type of amylase activities.
Acknowledgements
30 Biotechnol. Agron. Soc. Environ. 2014 18(1), 19-31 Tarayre C., Bauwens J., Brasseur C. et al.
(Université de Liège) and Professor Christian Amblard (Université Blaise Pascal, Clermont-Ferrand) for their help relating to the study of the protist. We also thank Professor Michel Paquot (University of Liege, Gembloux Agro-Bio Tech, Biological and Industrial Chemistry Unit) for the materials, which he supplied. We inally thank Annick Lejeune (University of Liege, Gembloux Agro-Bio Tech, Bio-Industries Unit) for her assistance with molecular genetics.
Bibliography
Altschul S.F. et al., 1990. Basic local alignment search tool. J. Mol. Biol., 215, 403-410.
Andersen R.A. & Wetherbee R., 1992. Microtubules of the lagellar apparatus are active in prey capture of the chrysophycean alga Epipyxis pulchra. Protoplasma,
166(1-2), 1-7.
Andersen R.A. et al., 1999. Phylogenetic analysis of the SSU rRNA from members of the Chrysophyceae. Protist, 150(1), 71-84.
Brune A., Emerson D. & Breznak J.A., 1995. The termite gut microlora as an oxygen sink: microelectrode determination of oxygen and pH gradients in guts of lower and higher termites. Appl. Environ. Microb.,
61(7), 2681-2687.
Brune A. & Ohkuma M., 2010. Role of the termite gut microbiota in symbiotic digestion. In: Bignell D.E., Roisin Y. & Lo N., eds. Biology of termites: a modern synthesis. Dordrecht, The Netherlands: Springer, 439-475.
Coman G., Cotarlet M., Bahrim G. & Stougaard P., 2008. Increasing the eiciency of screening streptomycetes able to produce glucanases by using insoluble chromogenic substrates. Roumanian Biotechnol. Lett., 13(6), 20-25. Dolan J.R., 1997. Phosphorus and ammonia excretion by
planktonic protists. Mar. Geol., 139(1), 109-122. Ebert A. & Brune A., 1997. Hydrogen concentration
proiles at the oxic-anoxic interface: a microsensor study of the hindgut of the wood-feeding lower termite Reticulitermes lavipes (Kollar). Appl. Environ. Microb.,
63(10), 4039-4046.
Frénot M. & Vierling E., 2002. Biochimie des aliments : diététique du sujet bien portant. Bordeaux, France: Éditions Doin.
Gibbs S.P., 1981. The chloroplast endoplasmic reticulum: structure, function and evolutive signiicance. Int. Rev. Cytol., 72, 49-99.
Gibson G. & Muse S.V., 2004. Précis de génomique. Bruxelles : De Boeck Supérieur.
Goesaert H. et al., 2006. Enzymes in breadmaking. In: Hui Y.H. et al., eds. Bakery products: science and technology. New York, NY, USA: John Wiley and Sons, 337-364.
Guo S. & Song L., 2010. Observation on Poterioochromonas sp. (Chrysophyte). J. Water Resour.Prot., 2(6), 592-596.
Gupta A., Gautam N. & Raj Modi D., 2010. Optimization of a-amylase production from free and immobilized cells of Aspergillus niger. J. Biotechnol. Pharm. Res., 1(1), 1-8. Holen D.A. & Boraas M.E., 1995. Mixotrophy in
chrysophytes. In: Sandgren C.D., Smol J.P. & Kristiansen J., eds. Chrysophyte algae: ecology, phylogeny and development. Cambridge, UK: Cambridge University Press, 119-140.
Inoue J.I. et al., 2007. Hydrogen production by termite gut protists: characterization of iron hydrogenases of parabasalian symbionts of the termite Coptotermes formosanus. Eukaryotic Cell, 6(10), 1925-1932.
Isenberg H.D., 1962. Studies of the nutritional requirements of Poterioochromonas stipitata. J. Gen.Microbiol., 29, 373-388.
Jarvis C.E. & Walker J.R.L., 1993. Simultaneous, rapid, spectrophotometric determination of total starch, amylose and amylopectin. J. Sci. Food Agric., 63(1), 53-57.
Karnati S.K.R. et al., 2003. Technical note: speciic PCR ampliication of protozoal 18S rRNA sequences from DNA extracted from ruminal samples of cows. J. Anim. Sci., 81(3), 812-815.
Magel E., 2001. Physiology of cambial growth, storage of reserves and heartwood formation. In: Huttunen S. et al., eds. Trends in European forest tree physiology research: cost action E: EUROSILVA. Dordrecht, The Netherlands: Springer, 19-32.
Mahdavi A., Hassan Sajedi R., Rassa M. & Jafarian V., 2010. Characterization of an a-amylase with broad temperature activity from an acid-neutralizing Bacillus cereus strain. Iran. J. Biotechnol., 8(2), 103-111. Medlin L., Elwood H.J., Stickel S. & Sogin M.L., 1988. The
characterization of enzymatically ampliied eukaryotic 16S-like rRNA-coding regions. Gene, 71(2), 491-499.
Mittal V., 2011. Renewable polymers: synthesis, processing, and technology. New York, NY, USA: John Wiley and Sons.
Moat A.G., Watkins Foster J. & Spector M.P., 2002. Microbial physiology. New York, NY, USA: John Wiley and Sons.
Moriya S., Ohkuma M. & Kudo T., 1998. Phylogenetic position of symbiotic protist Dinenympha exilis in the hindgut of the termite Reticulitermes speratus inferred from the protein phylogeny of elongation factor 1α. Gene, 210(2), 221-227.
Moser M. & Weisse T., 2011. The outcome of competition between the two chrysomonads Ochromonas sp. and Poterioochromonas malhamensis depends on pH. Eur. J. Protistology, 47(2), 79-85.
Nation J.L., 2008. Alimentary canal and digestion. In: Capinera J.L., ed. Encyclopedia of entomology. 2nd ed. Dordrecht, The Netherlands: Springer, 111-118.
Nicholls K.H. & Wujek D.E., 2003. Chrysophycean algae. In: Wehr J.D. & Sheath R.G., eds. Freshwater algae of North America. New York, NY, USA: Academic Press, 471-509.
Nola M. et al., 2003. Utilisation des protozoaires ciliés (Paramecium africanum, Colpidium uncinatum, Neobursaridium gigas) pour l’épuration bactériologique des eaux polluées en microcosme. Tropicultura, 21(2), 73-78.
Odelson D.A. & Breznak J.A., 1985a. Nutrition and growth characteristics of Trichomitopsis termopsidis, a cellulolytic protozoan from termites. Appl. Environ. Microb., 49(3), 614-621.
Odelson D.A. & Breznak J.A., 1985b. Cellulase and other polymer-hydrolyzing activities of Trichomitopsis termopsidis, a symbiotic protozoan from termites. Appl. Environ. Microb., 49(3), 622-626.
Ohkuma M., 2008. Symbioses of lagellates and prokaryotes in the gut of lower termites. Trends Microbiol., 16(7), 345-352.
Pringsheim E.G., 1952. On the nutrition of Ochromonas. Q. J. Microsc. Sci., 93(1), 71-96.
Raven P.H., Evert R.F. & Eichhorn S.E., 2003. Biologie végétale. Bruxelles : De Boeck Supérieur.
Rouland-Lefèvre C., 2000. Symbiosis with fungi. In: Abe T., Bignell D.E. & Higashi M., eds. Termites: evolution, sociality, symbioses, ecology. Dordrecht, The Netherlands: Kluwer Academic Publishers, 289-306.
Saeb-Parsy K. et al., 1999. Instant pharmacology. New York, NY, USA: John Wiley and Sons.
Sherr E.B. & Sherr B.F., 2011. Microbial food webs. In: Schmidt T.M. & Schaechter M., eds. Topics in ecological and environmental microbiology. Waltham, MA, USA: Academic Press, 21-36.
Singh N.B., 1976. Studies on certain digestive enzymes in the alimentary canal of Odontotermes obesus (Isoptera: Termitidae). Entomol. Exp. Appl.,20(2), 113-122. Sumbali G. & Mehrotra R.S., 2009. Principles of
microbiology. New Delhi, India: Tata McGraw-Hill Education.
Tartar A. et al., 2009. Parallel metatranscriptome analyses of host and symbiont gene expression in the gut of the termite Reticulitermes lavipes. Biotechnol. Biofuels, 2, 1-19.
Zawaski C. et al., 2012. PHOTOPERIOD RESPONSE 1 (PHOR1)-like genes regulate shoot/root growth, starch accumulation, and wood formation in Populus. J. Exp. Bot., 63(15), 5623-5634.