ACPD
15, 27137–27175, 2015Future vegetation–climate
interactions in Eastern Siberia
A. Arneth et al.
Title Page
Abstract Introduction
Conclusions References
Tables Figures
◭ ◮
◭ ◮
Back Close
Full Screen / Esc
Printer-friendly Version Interactive Discussion
Discussion
P
a
per
|
Discussion
P
a
per
|
Discussion
P
a
per
|
Discussion
P
a
per
|
Atmos. Chem. Phys. Discuss., 15, 27137–27175, 2015 www.atmos-chem-phys-discuss.net/15/27137/2015/ doi:10.5194/acpd-15-27137-2015
© Author(s) 2015. CC Attribution 3.0 License.
This discussion paper is/has been under review for the journal Atmospheric Chemistry and Physics (ACP). Please refer to the corresponding final paper in ACP if available.
Future vegetation–climate interactions in
Eastern Siberia: an assessment of the
competing e
ff
ects of CO
2
and secondary
organic aerosols
A. Arneth1, R. Makkonen2, S. Olin3, P. Paasonen2, T. Holst3, M. K. Kajos2, M. Kulmala2, T. Maximov4, P. A. Miller3, and G. Schurgers3,5
1
Karlsruhe Institute of Technology, Institute of Meteorology and Climate
Research/Atmospheric Environmental Research, Garmisch Partenkirchen, Germany 2
Department of Physics, University of Helsinki, P.O. Box 64, University of Helsinki, 00014 Helsinki, Finland
3
Department of Physical Geography and Ecosystem Science, Lund University, Sölvegatan 12, 22362 Lund, Sweden
4
Department of Plant Ecological Physiology and Biochemistry Lab., Institute for Biological Problems of Cryolithozone SB RAS, 41, Lenin ave, 677980 Yakutsk, Russia
5
ACPD
15, 27137–27175, 2015Future vegetation–climate
interactions in Eastern Siberia
A. Arneth et al.
Title Page
Abstract Introduction
Conclusions References
Tables Figures
◭ ◮
◭ ◮
Back Close
Full Screen / Esc
Printer-friendly Version Interactive Discussion
Discussion
P
a
per
|
Discussion
P
a
per
|
Discussion
P
a
per
|
Discussion
P
a
per
|
Received: 21 August 2015 – Accepted: 22 September 2015 – Published: 7 October 2015
Correspondence to: A. Arneth ([email protected])
ACPD
15, 27137–27175, 2015Future vegetation–climate
interactions in Eastern Siberia
A. Arneth et al.
Title Page
Abstract Introduction
Conclusions References
Tables Figures
◭ ◮
◭ ◮
Back Close
Full Screen / Esc
Printer-friendly Version Interactive Discussion
Discussion
P
a
per
|
Discussion
P
a
per
|
Discussion
P
a
per
|
Discussion
P
a
per
|
Abstract
Disproportional warming in the northern high latitudes, and large carbon stocks in bo-real and (sub)arctic ecosystems have raised concerns as to whether substantial pos-itive climate feedbacks from biogeochemical process responses should be expected. Such feedbacks occur if increasing temperatures lead to e.g. a net release of CO2
5
or CH4. However, temperature-enhanced emissions of biogenic volatile organic com-pounds (BVOC) have been shown to contribute to the growth of secondary organic aerosol (SOA) which is known to have a negative radiative climate effect. Combin-ing measurements in Eastern Siberia with model-based estimates of vegetation and permafrost dynamics, BVOC emissions and aerosol growth, we assess here possible
10
future changes in ecosystem CO2balance and BVOC-SOA interactions, and discuss these changes in terms of possible climate effects. On global level, both are very small but when concentrating on Siberia and the northern hemisphere the negative forcing from changed aerosol direct and indirect effects become notable – even though the as-sociated temperature response would not necessarily follow a similar spatial pattern.
15
While our analysis does not include other important processes that are of relevance for the climate system, the CO2and BVOC-SOA interplay used serves as an example of the complexity of the interactions between emissions and vegetation dynamics that underlie individual terrestrial feedbacks and highlights the importance of addressing ecosystem-climate feedbacks in consistent, process-based model frameworks.
20
1 Introduction
Warming effects on ecosystem carbon cycling in northern ecosystems (Serreze et al., 2000; Tarnocai et al., 2009), and the potential for large climate-feedbacks from losses of CO2 or CH4 from these carbon-dense systems have been widely discussed (Khvorostyanov et al., 2008; Schuur et al., 2009; Arneth et al., 2010). Other
biogeo-25
ACPD
15, 27137–27175, 2015Future vegetation–climate
interactions in Eastern Siberia
A. Arneth et al.
Title Page
Abstract Introduction
Conclusions References
Tables Figures
◭ ◮
◭ ◮
Back Close
Full Screen / Esc
Printer-friendly Version Interactive Discussion
Discussion
P
a
per
|
Discussion
P
a
per
|
Discussion
P
a
per
|
Discussion
P
a
per
|
biogenic volatile organic compounds (BVOC) that are important precursors for tropo-spheric O3formation, affect methane lifetime and also act as precursors for secondary organic aerosol (SOA). These latter interactions with SOA have a cooling effect (Ar-neth et al., 2010; Makkonen et al., 2012b; Paasonen et al., 2013). Condensation of monoterpenes (MT), a group of BVOC with large source strength from coniferous
veg-5
etation, on pre-existing particles increases the observed particle mass, as well as the number of particles large enough to act as cloud condensation nuclei (CCN; equiva-lent to particles>∼100 nm) at boreal forest sites (Tunved et al., 2006). For present-day conditions, Spracklen et al. (2008) estimated a radiative cooling of−1.8 to−6.7 W m−2 of boreal forest area from the BVOC-SOA interplay.
10
How future changes in MT emissions affect SOA growth and climate is very uncer-tain. This is partially because of the lack of process-understanding of the various steps of aerosol formation and growth, and interactions with cloud formation (Hallquist et al., 2009; Carslaw et al., 2010), and partially because the issue of how spatial patterns of changing emissions of atmospherically rapidly reactive substances translate into a
15
changing patterns of radiative forcing, and then into a surface temperature change, has not yet been resolved (Shindell et al., 2008; Fiore et al., 2012).
The Russian boreal forest represents the largest continuous conifer region in the world. About one third of this forested area (∼730×106ha) is dominated by larch (Shv-idenko et al., 2007), in particular by theLarix gmeliniiandL. cajanderiiforests growing
20
east of the Yenisei river on permafrost soils. Despite its vast expanse, the first sea-sonal measurements of MT emissions from Eastern Siberian larch have only recently been published (Kajos et al., 2013). Leaf MT emission capacities are highly species-dependent, thus any model estimate of MT emissions from boreal larch forests that rely solely on generic BVOC emission parameterisations obtained from other conifer
25
link-ACPD
15, 27137–27175, 2015Future vegetation–climate
interactions in Eastern Siberia
A. Arneth et al.
Title Page
Abstract Introduction
Conclusions References
Tables Figures
◭ ◮
◭ ◮
Back Close
Full Screen / Esc
Printer-friendly Version Interactive Discussion
Discussion
P
a
per
|
Discussion
P
a
per
|
Discussion
P
a
per
|
Discussion
P
a
per
|
ing MT emissions and SOA formation. We use the observations and process-models to assess climate change effects on future vegetation composition, BVOC emissions and the concentration of particles of CCN size. We discuss how the climate impact of future SOA levels from changes in BVOC emissions across Eastern Siberia com-pares with changes in the regional CO2 balance. The chief goal of the study was not
5
to provide a full surface climate-feedback quantification (for which today’s global cou-pled modelling-tools are insufficient) but rather to highlight the number of potentially opposing processes that need to be covered when doing so.
2 Methods
2.1 Site description, BVOC and aerosol measurements
10
Leaf BVOC emissions fluxes, above-canopy monoterpene concentration and aerosol particle size and number concentrations were measured during the growing season 2009 at the research station Spasskaya Pad, located ∼40 km to the northeast of Yakutsk (62◦15′18.4′′N, 129◦37′07.9′′E) and centred in the Eastern Siberian larch biome (Kobak et al., 1996; Tchebakova et al., 2006). In the northern direction, no major
15
pollution sources exist within hundreds of km, the nearest mining areas are concen-trated to the south and west of Yakutsk. The predominant air flow to the site is either from southern (via Yakutsk) or northern locations. Forest fires contribute to aerosol load in summer.
An eddy covariance tower for measurements of forest-atmosphere exchange of CO2,
20
water vapour and sensible heat was established at Spasskaya Pad in the late 1990s (Ohta et al., 2001; Dolman et al., 2004) in aL. cajanderiiforest growing on permafrost soil with an understory vegetation consisting of ericaceous shrubs. The forest has an average age of ca. 185 years and canopy height is little less than 20 m. Maximum one-sided larch leaf area index in summer is around two (Ohta et al., 2001; Takeshi
25
up-ACPD
15, 27137–27175, 2015Future vegetation–climate
interactions in Eastern Siberia
A. Arneth et al.
Title Page
Abstract Introduction
Conclusions References
Tables Figures
◭ ◮
◭ ◮
Back Close
Full Screen / Esc
Printer-friendly Version Interactive Discussion
Discussion
P
a
per
|
Discussion
P
a
per
|
Discussion
P
a
per
|
Discussion
P
a
per
|
per part of the canopy from a scaffolding tower located within few hundred metres of the eddy flux tower (Kajos et al., 2013). Using a custom-made Teflon branch cham-ber, air filtered of O3 was sampled onto Tenax-TA/Carbopack-B cartridges with a flow rate of 220 mL min−1. A total of 5–12 samples were taken during the day, from two
trees on south-facing branches approximately 2 m below the tree top. The cartridge
5
samples were stored at 5◦C during the campaigns, transported afterwards to Helsinki and thermally desorbed and analysed using a thermal desorption instrument Elmer TurboMatrix 650, Waltham, USA) attached to a gas-chromatograph (Perkin-Elmer Clarus 600, Waltham, USA). For details on chamber, adsorbents and labora-tory measurements see Haapanala et al. (2009), Ruuskanen et al. (2007) or Hakola et
10
al. (2006).
Monoterpene concentrations were measured with a high-sensitive Quadrupole PTR-MS (Ionicon, Innsbruck, Austria) located in a hut at the foot of the eddy covariance tower. Sample air was drawn through a heated PFA tube using a 20 L min−1 flow from
the inlet located at 30.3 m above ground. While reporting here on monoterpenes only,
15
a range of masses, corresponding to BVOCs e.g. isoprene, methanol, acetaldehyde were sampled sequentially, with typical dwell times of 0.5 s and scanning sequences of around 4 s. Measurement set-up and quality control followed Holst et al. (2010). It was not possible to import a gas calibration standard to Spasskaya Pad due to security and customs restrictions, and thus the PTR-MS could not be calibrated on-site.
How-20
ever, the instrument had been calibrated before and after the field campaign using a gas standard mixture from Ionimed (Innsbruck, Austria) using the same detector and instrument settings as during the field campaigns.
Aerosol particles were continuously monitored with a Scanning mobility particle sizer (SMPS) located at the foot of the eddy covariance tower, connected to a
Dif-25
ACPD
15, 27137–27175, 2015Future vegetation–climate
interactions in Eastern Siberia
A. Arneth et al.
Title Page
Abstract Introduction
Conclusions References
Tables Figures
◭ ◮
◭ ◮
Back Close
Full Screen / Esc
Printer-friendly Version Interactive Discussion
Discussion
P
a
per
|
Discussion
P
a
per
|
Discussion
P
a
per
|
Discussion
P
a
per
|
across the size range of 6–600 nm were completed every 5 min. The SMPS data were used to determine occasions of aerosol particle nucleation. The growth rates were calculated from log-normal modes fitted to the measured particle size distribution fol-lowing Hussein et al. (2005). The time evolution of the diameters at which the fitted modes peaked was inspected visually, and the growth rate was determined with linear
5
least squares fitting to these peak diameters whenever a continuous increase in diam-eter was observed. In this analysis we calculated growth rates for particles from 25 to 160 nm.
The source rate for condensing vapour (Q) was determined by calculating the
con-centration of condensable vapour needed to produce the observed growth rate (CGR,
10
Nieminen et al., 2010) and the condensation sink from the particle size distribution (CS, Kulmala et al., 2001). In steady state the sources and sinks for the condensing vapour are equal, and thus we determined the source rate asQ=CGR·CS.
2.2 Modelling of dynamic vegetation processes, permafrost and BVOC emissions
15
We applied the dynamic global vegetation model LPJ-GUESS (Smith et al., 2001; Sitch et al., 2003), including algorithms to compute canopy BVOC emission follow-ing Niinemets et al. (1999), Arneth et al. (2007b) and Schurgers et al. (2009a), and permafrost as adopted from Wania et al. (2009). LPJ-GUESS simulates global and regional dynamics and composition of vegetation in response to changes in climate
20
and atmospheric CO2 concentration. Physiological processes like photosynthesis, au-totrophic and heterotrophic respiration are calculated explicitly, a set of carbon alloca-tion rules determines plant growth. Plant establishment, growth, mortality, and decom-position, and their response to resource availability (light, water) modulate seasonal and successional population dynamics arising from a carbon allocation trade-off(Smith
25
ACPD
15, 27137–27175, 2015Future vegetation–climate
interactions in Eastern Siberia
A. Arneth et al.
Title Page
Abstract Introduction
Conclusions References
Tables Figures
◭ ◮
◭ ◮
Back Close
Full Screen / Esc
Printer-friendly Version Interactive Discussion
Discussion
P
a
per
|
Discussion
P
a
per
|
Discussion
P
a
per
|
Discussion
P
a
per
|
observations on LAI, permafrost distribution and vegetation response to warming (see results). Total present-day modelled soil C pools over the top 2 m in Eastern Siberia are 216 Gt C, and 454 Gt C for circumpolar soils above 40◦N (Table 1). A recent data-base estimate was 191, 495, and 1024 Gt C in the 0–30, 0–100 and 0–300 cm soil layer, of permafrost-affected soils, respectively (Tarnocai et al., 2009). These numbers indicate
5
that the values calculated with LPJ-GUESS are lower than observation-based ones, most likely underestimating C-density in particular in the soil layers below few tenths of cm.
BVOC emissions models, whether these are linked to DGVMs or to a prescribed vegetation map, all rely on using emission potentials (E∗, leaf emissions at
standard-10
ised environmental conditions) or some derivatives in their algorithms. In LPJ-GUESS, production and emissions of leaf and canopy isoprene and monoterpenes are linked to their photosynthetic production, specifically the electron transport rate, and the re-quirements for energy and redox-equivalents to produce a unit of isoprene from triose-phosphates (Niinemets et al., 1999; Arneth et al., 2007b; Schurgers et al., 2009a).
15
A specified fraction of absorbed electrons used for isoprene (monoterpene) produc-tion (ε) provides the link to PFT-specificE∗ (Arneth et al., 2007a); in case of
monoter-penes emitted from storage an additional correction is applied to account for their light-dependent production (taking place over parts of the day) and temperature-driven (tak-ing place the entire day) emissions (Schurgers et al., 2009a).
20
Leaf BVOC emissions are stimulated in a future environment in response to warmer temperatures. Moreover, warmer temperatures and CO2-fertilisation of photosynthesis lead to enhanced vegetation productivity and leaf area, with additional positive effects on BVOC emissions. But higher CO2 concentrations have also been shown to inhibit leaf isoprene production. Even though the underlying metabolic mechanism is not yet
25
ACPD
15, 27137–27175, 2015Future vegetation–climate
interactions in Eastern Siberia
A. Arneth et al.
Title Page
Abstract Introduction
Conclusions References
Tables Figures
◭ ◮
◭ ◮
Back Close
Full Screen / Esc
Printer-friendly Version Interactive Discussion
Discussion
P
a
per
|
Discussion
P
a
per
|
Discussion
P
a
per
|
Discussion
P
a
per
|
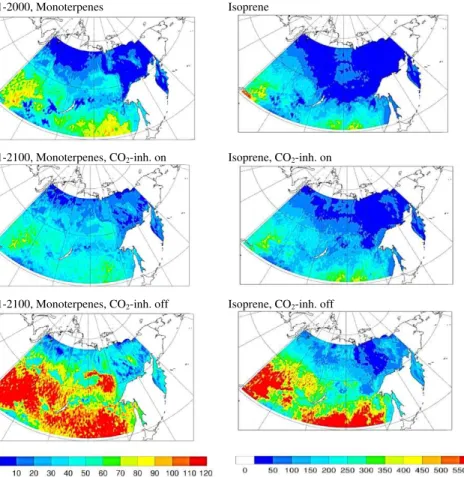
hypothesis (see Fig. A1). Multiple interacting processes can thus lead to enhanced global monoterpene emissions in future, or -if the “CO2 inhibition” is included- yield emissions that are more or less similar to present-day or even slightly smaller (Arneth et al., 2007a; Schurgers et al., 2009a) (Table 1).
Monoterpene compounds can be emitted either directly following their synthesis in
5
the chloroplast, in an “isoprene-like” fashion, or from storage pools, resulting in an emission pattern that is independent of light availability. The observed emissions of monoterpenes by larch possibly exhibit a hybrid between emission directly after syn-thesis in the chloroplast and emission from storage pools, as has also been found for other coniferous species (Schurgers et al., 2009a). The needle-level measurements
10
by Kajos et al. (2013) on larch indicated a combined light- and temperature response, even though a robust differentiation to a temperature-only model was not possible due to the limited sample size. An earlier study by Ruuskanen et al. (2007) on a 5-year old L. sibiricatree indicated a better performance of the temperature-only emission model for monoterpene species compared to the light and temperature approach. In the model
15
simulations performed here, half of the produced monoterpenes were stored, whereas the other half was emitted directly (Schurgers et al., 2009a).
LPJ-GUESS is a second generation DGVM (Fisher et al., 2010) and includes plant demography, such that forest successional dynamics and competition for water and light between individual age-cohorts are treated explicitly (Smith et al., 2001). The
for-20
est growth dynamics thus differentiate between early successional, short-lived species that invest in rapid growth and shade-tolerant trees with resource allocation aimed to-wards longer-lived growth strategies. As a result, the model’s PFTs can be mapped to tree-species when required information for model parameterisation is available. This feature provides a distinct advantage when applying the necessary BVOC emission
25
summer-ACPD
15, 27137–27175, 2015Future vegetation–climate
interactions in Eastern Siberia
A. Arneth et al.
Title Page
Abstract Introduction
Conclusions References
Tables Figures
◭ ◮
◭ ◮
Back Close
Full Screen / Esc
Printer-friendly Version Interactive Discussion
Discussion
P
a
per
|
Discussion
P
a
per
|
Discussion
P
a
per
|
Discussion
P
a
per
|
green (BNS) PFT, and for other PFTs the global parameterisation was used (Schurgers et al., 2009a).
LPJ-GUESS was recently expanded with a permafrost module following Wania et al. (2009) and Miller and Smith (2012) in which a numerical solution of the heat diff u-sion equation was introduced. The soil column in LPJ-GUESS now consists of a snow
5
layer of variable thickness, a litter layer of fixed thickness (5 cm), and a soil column of depth 2 m (with sublayers of thickness 0.1 m) from which plants can extract non-frozen water above the wilting point. A “padding” column of depth 48 m (with thicker sublayers) is also present beneath these three layers to aid in the accurate simulation of tempera-tures in the overlying compartments (Wania et al., 2009). Soil temperatempera-tures throughout
10
the soil column are calculated daily, and change in response to changing surface air temperature and precipitation input, as well as the insulating effects of the snow layer and phase changes in the soil’s water.
Here we run the model with 0.5◦ spatial resolution, using climate and atmospheric
CO2 as driving variables as described in the literature (Smith et al., 2001). Values for
15
the BNS “larch” PFT were adopted from previous studies (Sitch et al., 2003; Hickler et al., 2012; Miller and Smith, 2012), but with the degree-day cumulative temperature requirements on a five-degree basis (GDD5) to attain full leaf cover reduced from 200 to 100 (Moser et al., 2012). Minimum GDD5 to allow establishment was set to 350 re-sulting in establishment of seedlings in very cold locations. Soil thermal
conductiv-20
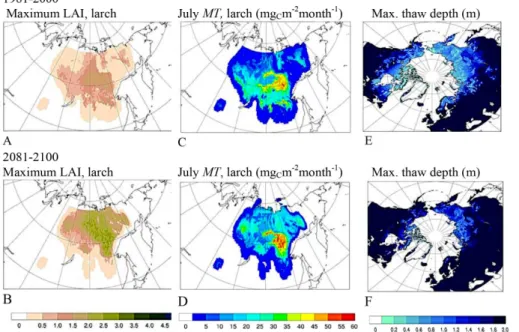
ity was 2 W m−1K−1. The modelled distribution of larch in LPJ-GUESS (Fig. 1)
com-pares well with observation-based maps (Wagner, 1997). The model was spun up for 500 years to 1900 values using CO2 concentration from the year 1900 and repeating de-trended climate from 1901–1930 from CRU (Mitchell and Jones, 2005). Historical (20th century) simulations used observed CO2concentrations and were based on
vari-25
ACPD
15, 27137–27175, 2015Future vegetation–climate
interactions in Eastern Siberia
A. Arneth et al.
Title Page
Abstract Introduction
Conclusions References
Tables Figures
◭ ◮
◭ ◮
Back Close
Full Screen / Esc
Printer-friendly Version Interactive Discussion
Discussion
P
a
per
|
Discussion
P
a
per
|
Discussion
P
a
per
|
Discussion
P
a
per
|
values interpolated to daily ones (see Ahlström et al. (2012) and references therein). These daily fields were then bias-corrected using the years 1961–1990 as reference period, as in Ahlström et al. (2012). CO2 inhibition of BVOC emissions were switched on and offin separate simulations to assess the sensitivity of our results to this pro-cess. Totals across Siberia were calculated for a grid-box that ranged from 46 to 71◦N
5
and 76 to 164◦E. Simulated changes in total carbon uptake or losses were translated into radiative forcing following IPCC (2007), assuming a 50 % uptake in oceans in case of a net loss to the atmosphere Sitch et al., 2007).
2.3 Modelling aerosols and CCN
To model the effect of BVOCs on CCN concentrations, we use the global
aerosol-10
climate model ECHAM5.5-HAM2 (Zhang et al., 2012). ECHAM5.5-HAM2 includes aerosol components black carbon, organic carbon, dust, sea salt and sulfate, and de-scribes the aerosol size distribution with seven log-normal modes. The microphysics module M7 (Vignati et al., 2004) includes nucleation, coagulation and condensation. In this study, we use the ECHAM5.5-HAM2 version with activation-type as described in
15
Makkonen et al. (2012). For simulating secondary organic aerosol, we use the recently developed SOA module (Jokinen et al., 2015). The SOA module explicitly accounts for gas-phase formation of extremely low volatility organic compounds (ELVOCs) from monoterpene oxidation. The module implements a hybrid mechanism for SOA forma-tion: ELVOCs are assumed to condense to the aerosol population according to the
20
Fuchs-corrected condensation sink, while semi-volatile organic compounds (SVOCs) are partitioned according to organic aerosol mass. While simulated ELVOCs are able to partition more effectively to nucleation and Aitken mode, hence providing growth for nucleated particles to CCN size, SVOCs primarily add organic mass to accumulation and coarse aerosol modes. A total SOA yield of 15 % from monoterpenes is assumed
25
ACPD
15, 27137–27175, 2015Future vegetation–climate
interactions in Eastern Siberia
A. Arneth et al.
Title Page
Abstract Introduction
Conclusions References
Tables Figures
◭ ◮
◭ ◮
Back Close
Full Screen / Esc
Printer-friendly Version Interactive Discussion
Discussion
P
a
per
|
Discussion
P
a
per
|
Discussion
P
a
per
|
Discussion
P
a
per
|
Whether or not BVOCs can increase the availability of cloud condensation nu-clei (CCN) depends on the availability of sub-CCN sized particles (O’Donnell et al., 2011). Anthropogenic primary emissions are introduced to the model as 60 nm parti-cles, hence condensation of sulfuric acid and organic vapours is generally needed in order to grow these particles to CCN sizes. In Siberia, the modelled primary particle
5
emissions are dominated by wildfires, which are assumed to inject large particles with 150 nm diameter. The model is using T63 spectral resolution with 31 vertical hybrid sigma levels.
ECHAM5.5-HAM2 was run with different BVOC emission scenarios in year 2000 and 2100 simulated offline with LPJ-GUESS (see previous section). The simulations
10
apply present-day oxidant fields as in Stier et al. (2005). The assumption of unchanging oxidant fields induces some uncertainty for future simulations and inconsistency with present-day simulations with varying biogenic emissions, since both anthropogenic and biogenic emissions are likely to modify the atmospheric oxidative capacity. All simula-tions are initiated with a six months spin-up, followed by 5 years of simulation for
anal-15
ysis. The model climate is nudged towards ERA-40 reanalysis year 2000 meteorology, an approach that is widely used in aerosol-climate assessments (K. Zhang et al., 2014). Nudging towards reanalysis meteorology establishes evaluation of BVOC-aerosol cou-pling with unchanged meteorological fields, but restricts the model in terms of aerosol-climate feedbacks, since e.g. nudging future aerosol-climate simulations with present-day
me-20
teorological winds is based on the assumption that e.g. cloudiness, or wind direction and – speed etc. are not changing. Present-day wildfire and anthropogenic aerosol and precursor emissions are applied for all simulations (Dentener et al., 2006). One of the foci here are BVOC, comparing present-day and future BVOC emissions with
E∗=1.9 µg C m−2(leaf) h−1, but keeping other emissions constant. The emissions of
25
dust and sea salt are modelled interactively (Zhang et al., 2012).
con-ACPD
15, 27137–27175, 2015Future vegetation–climate
interactions in Eastern Siberia
A. Arneth et al.
Title Page
Abstract Introduction
Conclusions References
Tables Figures
◭ ◮
◭ ◮
Back Close
Full Screen / Esc
Printer-friendly Version Interactive Discussion
Discussion
P
a
per
|
Discussion
P
a
per
|
Discussion
P
a
per
|
Discussion
P
a
per
|
centrations are interactively coupled to the cloud-microphysics scheme (Lohmann et al., 2007) and to the direct aerosol radiative calculation. The aerosol indirect effect is evaluated as a change in cloud radiative forcing (∆CRF). The direct aerosol effect accounts only for clear-sky short-wave forcing (∆CSDRF). The radiative effects are calculated as differences from two time-averaged 5-year simulations as
5
∆CRF=CRF (BVOC2100)−CRF (BVOC2000)
∆CSDRF=CSDRF (BVOC2100)−CSDRF (BVOC2000) .
3 Results
3.1 Present-day BVOC emissions
The dynamic global vegetation model LPJ-GUESS reproduces the present-day
circum-10
polar permafrost distribution (Fig. 1; shown as circumpolar map for comparison with Tarnocai et al., 2009) and, with the exception of the Kamchatka peninsula, simulates also the expanse of the larch-dominated forests in Eastern Siberia (Fig. 1; Miller and Smith, 2012; Wagner, 1997). Maximum leaf area index (LAI) calculated by the model for the Spasskaya Pad forest (62◦15′18.4′′N, 129◦37′07.9′′E, 220 m a.s.l), where the
15
BVOC measurements were obtained, was 2.0 (averaged over years 1981–2000; not shown), and is in good agreement with the measured values during that period (1.6; Takeshi et al., 2008). For the “larch” plant functional type in LPJ-GUESS (Schurgers et al., 2009a), an emission potential ofE∗
=2.4 µg C m−2(leaf) h−1was adopted in
pre-vious simulations from Guenther et al. (1995), a recommendation that at that time did
20
not include observations from any larch species.
Kajos et al. (2013) measured for the first time MTE∗ fromL. cajanderii. Their
mea-surements, taken over an entire growing season at Spasskaya Pad, suggested values of E∗ ranging from 1.9 µg C m−2(leaf) h−1 at the lower end, to 9.6 µg C m−2(leaf) h−1
at the upper. Applying a weighted measured-averageE∗ of 6.2 µg C m−2(leaf) h−1,
ACPD
15, 27137–27175, 2015Future vegetation–climate
interactions in Eastern Siberia
A. Arneth et al.
Title Page
Abstract Introduction
Conclusions References
Tables Figures
◭ ◮
◭ ◮
Back Close
Full Screen / Esc
Printer-friendly Version Interactive Discussion
Discussion
P
a
per
|
Discussion
P
a
per
|
Discussion
P
a
per
|
Discussion
P
a
per
|
creased simulated total present-day MT emissions across the Siberian larch biome from 0.11 Tg Ca−1 (as in Schurgers et al., 2009a) to 0.21 Tg Ca−1, or to 0.42 Tg Ca−1
when the maximumE∗ was used (Table 1). The observed range inE∗, and the
calcu-lated range in total emissions across Siberia, might reflect variability in tree microcli-mate or genetic variability, or was induced by (undetected) mechanic or biotic stress
5
during the time of measurements (Staudt et al., 2001; Bäck et al., 2012; Kajos et al., 2013). While our data are insufficient to make a finite suggestion ofL. cajanderiE∗, the
measurements provide evidence for potentially substantially higher MT emissions from Siberian larch than previous estimates.
3.2 Present-day aerosols, and links to BVOC
10
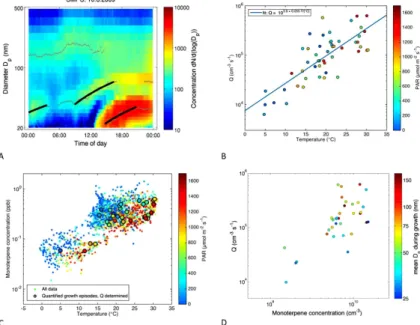
New particle formation events (Fig. 2a) were observed regularly. The calculated volu-metric source rates of condensing vapours (Q), the product of vapour concentration re-quired for the observed particle growth rate and particle loss rate (Kulmala et al., 2005), increased exponentially with temperature (Fig. 2b). MT concentrations increased with temperature as well, with a slope relatively similar to that found for theQ vs.T
rela-15
tionship (Fig. 2c). Consequently, a positive relationship emerged betweenQ and MT
concentration (Fig. 2d), which supports previous field and laboratory evidence that MT and their oxidation products are a main precursor to the observed particle formation and growth.
Figure 2d shows the connection between the BVOC concentration and the formation
20
rate of vapours causing the growth of the aerosol particles. Even though the monoter-pene concentrations were measured above and the aerosol growth rates below the canopy, the observed correlation indicates that BVOC concentration is an important contributor to the regional aerosol growth and supports the theory that the conden-sation of organic vapour is largely responsible for the formation of secondary organic
25
ACPD
15, 27137–27175, 2015Future vegetation–climate
interactions in Eastern Siberia
A. Arneth et al.
Title Page
Abstract Introduction
Conclusions References
Tables Figures
◭ ◮
◭ ◮
Back Close
Full Screen / Esc
Printer-friendly Version Interactive Discussion
Discussion
P
a
per
|
Discussion
P
a
per
|
Discussion
P
a
per
|
Discussion
P
a
per
|
on pre-existing aerosol particles, whereas the nucleation rate of new aerosol particles seems not to be dominated by the landscape-scale emissions and surface concen-trations of BVOCs. For instance, most nucleation events in a Scots pine dominated landscape in Finland have been found in spring, when measured monoterpene con-centrations in the near-surface were about one tenth of the summer time maximum
5
(∼60 ppt, vs. up to 500 ppt; Haapanala et al., 2007; Lappalainen et al., 2009). We found here MT concentrations of similar magnitude to these.
By contrast to temperature and BVOC concentrations, levels of radiation, which can be considered a surrogate for the concentration of the OH radical (OH.), did not af-fectQ(Fig. 2b), even though OH.has been considered an important player for aerosol
10
formation. Rohrer and Berresheim (2006) showed a strong correlation between solar ultraviolet radiation and OH. concentration at the Hohenpeissenberg site in Germany. Furthermore, Hens et al. (2014) demonstrated that the day-time OH. concentrations in (especially) boreal forest depend on solar radiation. Hence, the poor relation between the source rate of condensing vapour and levels of radiation (Fig. 2b) indicates that
15
OH-radical concentration did not have a major impact onQ. This agrees with the
find-ings by Ehn et al. (2014) that ozone instead of OH. is an important, if not the main, atmospheric agent oxidising organic vapours into a chemical form that condenses on particle surfaces. Thus, our results indicate that factors and processes besides the concentrations of SO2and OH. seem to limit aerosol production in non-polluted
envi-20
ronments (Kulmala et al., 2005).
3.3 Future carbon pools, vegetation distribution and BVOC emissions in Siberia
In a warmer environment with higher atmospheric CO2levels, the simulations indicated drastically reduced area of permafrost in Siberia (Fig. 1). Total net primary productivity
25
ACPD
15, 27137–27175, 2015Future vegetation–climate
interactions in Eastern Siberia
A. Arneth et al.
Title Page
Abstract Introduction
Conclusions References
Tables Figures
◭ ◮
◭ ◮
Back Close
Full Screen / Esc
Printer-friendly Version Interactive Discussion
Discussion
P
a
per
|
Discussion
P
a
per
|
Discussion
P
a
per
|
Discussion
P
a
per
|
be necessary to assess changing methane emissions) at the end of the 21st century was calculated from the shrinking Siberian areas of permafrost (Table 1). However, warming and higher levels of atmospheric CO2led also to increasing LAI, and to larch-dominated areas showing the expected north- and north-eastwards shift (Fig. 1) com-pared to present-day climate (Miller and Smith, 2012). The carbon uptake in expanding
5
vegetation into permafrost-free areas, combined with enhanced productivity across the simulation domain overcompensates for the losses from C-pools in permafrost areas (Table 1).
Future MT emissions were enhanced directly as a result of warmer leaves, and aug-mented by the future higher LAI of larch and evergreen conifers (Figs. 1d and A1;
10
Table 1). Since the emissions scale with the emission factors applied, the proportional increase between present-day and future climate conditions is independent of the value ofE∗. Whether or not leaf MT emissions are inhibited by increasing atmospheric CO2
levels to similar degree to what was found for isoprene is difficult to assess from today’s limited number of studies (e.g. Niinemets et al. (2010) and references therein).
Simi-15
larities in the leaf metabolic pathways of isoprene and MT production suggest such an inhibition, but possibly this effect does not become apparent in plant species where produced MT are stored, unless the storage pools become measurably depleted by the reduced production. By contrast, species emitting MT in an “isoprene-like” fash-ion immediately after productfash-ion should more directly reflect CO2inhibition. Evergreen
20
conifers typically emit most MT from storage pools, although recent experiments have shown that some light-dependent emissions also contribute to total emission fluxes. Accordingly, based on the leaf-level measurements, larch could follow a hybrid pat-tern between emission after production and from storage (Kajos et al., 2013). Without accounting for CO2inhibition, MT emissions across the model domain more than
dou-25
ACPD
15, 27137–27175, 2015Future vegetation–climate
interactions in Eastern Siberia
A. Arneth et al.
Title Page
Abstract Introduction
Conclusions References
Tables Figures
◭ ◮
◭ ◮
Back Close
Full Screen / Esc
Printer-friendly Version Interactive Discussion
Discussion
P
a
per
|
Discussion
P
a
per
|
Discussion
P
a
per
|
Discussion
P
a
per
|
4 Discussion
Boreal vegetation has been shown to respond to the recent decades’ warming and increasing atmospheric CO2levels with a prolonged growing season and higher max-imum LAI, similar to patterns in our simulations (Piao et al., 2006). The calculated enhanced biomass growth is in-line with experimental evidence of higher C in plant
5
biomass in warming plots at tundra field sites (Elmendorf et al., 2012; Sistla et al., 2013). In Siberian mountain regions, an upward movement of vegetation zones has been recorded already (Soja et al., 2007), while the analysis of evergreen coniferous undergrowth abundance and age shows spread of evergreen species, especiallyPinus siberia, into Siberian larch forest (Kharuk et al., 2007). These observations thus
sup-10
port the modelled shift in vegetation zones, and change in vegetation type composition and productivity. Likewise, other models with dynamic vegetation also have shown a strong expansion of broadleaved forests at the southern edge of the Siberian region in response to warming (Shuman et al., 2015).
Warming and thawing of permafrost soils is being observed at global monitoring
15
network sites, including in Russia (Romanovsky et al., 2010). Estimates of carbon losses from northern wetland and permafrost soils in response to 21st century warm-ing range from a few tens to a few hundreds Pg C, dependwarm-ing on whether processes linked to microbial heat production, thermokarst formation and surface hydrology, win-ter snow cover insulation, dynamic vegetation, C–N inwin-teractions, or fire are considered
20
(Khvorostyanov et al., 2008; Schuur et al., 2009; Arneth et al., 2010; Koven et al., 2011; Schneider von Deimling et al., 2012). For instance, a modelled range of 0.07– 0.23 W m−2 forcing associated with a 33–114 Pg CO
2-C loss from permafrost regions
was found for a simulation study that was based on the RCP8.5 climate and CO2 sce-narios, but excluding full treatment of vegetation dynamics (Schneider von Deimling et
25
ACPD
15, 27137–27175, 2015Future vegetation–climate
interactions in Eastern Siberia
A. Arneth et al.
Title Page
Abstract Introduction
Conclusions References
Tables Figures
◭ ◮
◭ ◮
Back Close
Full Screen / Esc
Printer-friendly Version Interactive Discussion
Discussion
P
a
per
|
Discussion
P
a
per
|
Discussion
P
a
per
|
Discussion
P
a
per
|
our simulation, the CO2-C loss from the decreasing Siberian permafrost region would be equivalent to a 0.13 additional Wm−2forcing in 2100 (see methods). Likely, this
num-ber is too low since the model does not include thermokarst processes, which can facil-itate rapid thaw (Schaefer et al. (2014) and references therein). The modelled carbon loss was offset when taking into account vegetation dynamics and processes across
5
the entire Siberian study-domain (Table 1), including a shift in PFT composition, and enhanced productivity especially in the southern regions, such that the overall carbon uptake including enhanced net primary productivity and expanding woody vegetation resulted in a small negative (−0.09 W m−2) e
ffect.
The temperature-dependency of monoterpene emissions, especially those from
10
stored pools, is a well-established response on the short-term. However, a change in concentrations and hence partial pressure in the storage pools, for instance in re-sponse to long-term warming, would affect emission capacities. Changes in measured
E∗ when investigated over the course of a growing season have been reported and
could be related to a changing production rate (Niinemets et al., 2010). Likewise,
ob-15
served profiles of E∗ within tree canopies appear not only related to changes in leaf
area-to-weight ratios along the canopy light and temperature gradients, but also to varying production rates (Niinemets et al., 2010). Emission capacities inQ. ilexleaves adapted to warm growth environment were notably enhanced (Staudt et al., 2003), but the experimental basis for an acclimation response of BVOC emissions to
temper-20
ature remains remarkably poor (Penuelas and Staudt, 2010) and is indicative of the general lack of global modelling studies accounting for possibly acclimation of process responses to environmental changes (Arneth et al., 2012). In our simulations we aim to provide a range of a possible plastic BVOC-CO2 response by switching the direct CO2 inhibition on and offfor both isoprene and monoterpene, but we do not account
25
for other acclimation processes.
ACPD
15, 27137–27175, 2015Future vegetation–climate
interactions in Eastern Siberia
A. Arneth et al.
Title Page
Abstract Introduction
Conclusions References
Tables Figures
◭ ◮
◭ ◮
Back Close
Full Screen / Esc
Printer-friendly Version Interactive Discussion
Discussion
P
a
per
|
Discussion
P
a
per
|
Discussion
P
a
per
|
Discussion
P
a
per
|
into a response in the climate system is highly non-linear and poorly understood (Shin-dell et al., 2008; Fiore et al., 2012). Based on a synthesis of measured aerosol number concentrations and size distribution combined with boundary layer growth modelling Paasonen et al. (2013) estimated a growing-season indirect radiative cloud albedo feedback of −0.5 W m−2K−1 for the Siberian larch region. The observation-based
in-5
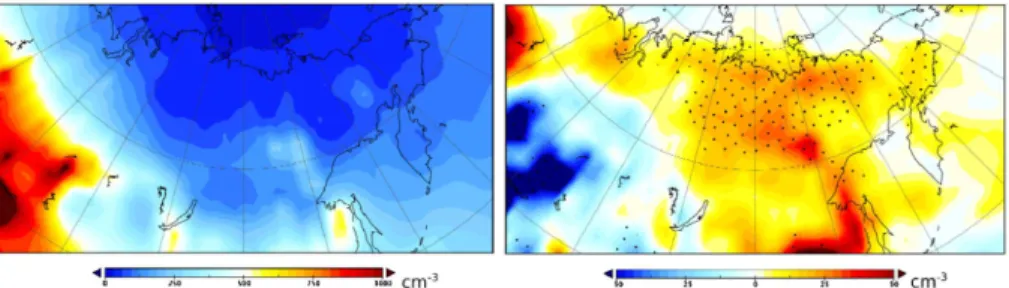
direct feedback factors exceeded direct ones by roughly an order of magnitude (Paa-sonen et al., 2013), but a simple extrapolation based on the region’s growing season temperature increases of∼5.5 K simulated at the end of the 21st century in our study with the ECHAM GCM does not account for the important non-linearities in the sys-tem. Present-day CCN (1.0 %) concentration over Siberia was estimated to vary from
10
extremely low values of less than 50 cm−3north of 60◦N to a few hundred per cc in the
southern part of Siberian domain (Fig. 3). Over the larch-dominated area (Fig. 1) the sensitivity of CCN to E∗ was 5–10 %. In the future, a scenario of decreasing
anthro-pogenic emissions led to a strong decrease in calculated atmospheric SO2 concen-trations and also of particle nucleation (Makkonen et al., 2012a). What is more, SOA
15
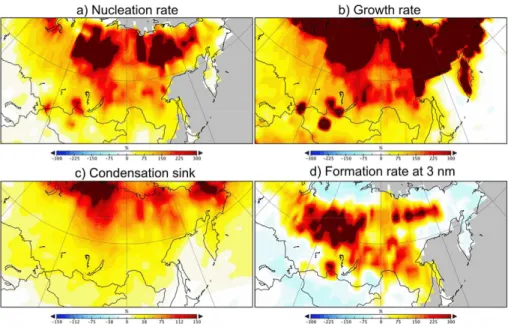
formation only partly enhances the survival of small particles by providing additional growth (Makkonen et al., 2012a), but partly also suppresses it by increasing the co-agulation sink for small particles (Fig. A2, lower left panel; see also O’Donnell et al., 2011). When only BVOC emissions were changed between present day and 2100, the relatively higher emission of BVOC under ambient and future conditions leads to
sub-20
stantially increased aerosol growth rates (GR) over a large part of the Siberian domain. However, increased aerosol mass due to increased SOA formation led to an increase in the condensation sink and eventually to decreased particle formation rates in some regions (Fig. A2, lower right panel). These competing effects of increased growth and increased sink are essential for quantifying the importance of the cloud albedo forcing
25
ACPD
15, 27137–27175, 2015Future vegetation–climate
interactions in Eastern Siberia
A. Arneth et al.
Title Page
Abstract Introduction
Conclusions References
Tables Figures
◭ ◮
◭ ◮
Back Close
Full Screen / Esc
Printer-friendly Version Interactive Discussion
Discussion
P
a
per
|
Discussion
P
a
per
|
Discussion
P
a
per
|
Discussion
P
a
per
|
applied future scenarios, Siberian wildfire intensity was assumed to increase (Makko-nen et al., 2012a). When separated for areas of low and high wildfire emissions (Fig. 4) it becomes clear that in areas of low wildfire activity, the increase in SOA formation was proportionally high (60 %) in nucleation mode (dp<10 nm), and the relative increases
in SOA formation in Aitken, accumulation and coarse modes were 50, 31 and 40 %,
5
respectively. However, the distribution of BVOC oxidation products was rather different in areas of high wildfire activity. SOA formation in coarse mode was more than doubled, while SOA in nucleation mode decreased by 30 %. It is clear that the effect of increased BVOC emission on particle population has distinct effects depending on existing back-ground aerosol distribution. Averaged over Siberian areas of low wildfire activity, the
10
median (mean) increase of CCN (0.2 %) was calculated to be 1 % (7 %) due to BVOC emissions changes from year 2000 to year 2100, while areas of high wildfire emission lead to median (mean) increase of 0.3 % (0.5 %).
Even though the Siberian MT emissions more than double until 2100 (Table 1), the increasing wildfire emissions and decreasing new particle formation due to reductions
15
in anthropogenic SO2 largely offset the effect of increased BVOC emissions on CCN concentration. In wildfire plumes, the simulated CCN concentrations were high even without BVOC-induced growth of smaller particles. The radiative effect due to BVOC emission change between years 2000 and 2100 was estimated from ECHAM-HAM simulations averaged over 5 years. The increase in BVOC emission leading to
ad-20
ditional secondary organic aerosol induces a −0.2 W m−2 change in direct clear-sky
aerosol forcing over the Siberian domain until the year 2100. Furthermore, the in-crease in CCN concentrations leads to a strengthening of the cloud radiative effect by −0.5 W m−2 (Table 2). These changes in radiative fluxes only take into account
the changing BVOC emission, and the potential concurrent changes in anthropogenic
25
ACPD
15, 27137–27175, 2015Future vegetation–climate
interactions in Eastern Siberia
A. Arneth et al.
Title Page
Abstract Introduction
Conclusions References
Tables Figures
◭ ◮
◭ ◮
Back Close
Full Screen / Esc
Printer-friendly Version Interactive Discussion
Discussion
P
a
per
|
Discussion
P
a
per
|
Discussion
P
a
per
|
Discussion
P
a
per
|
5 Implications, limitations and future progress
Up to now, studies that investigate the role of terrestrial vegetation dynamics and car-bon cycle in the climate system typically account solely for CO2, while studies that look at BVOC-climate interactions often ignore other processes, especially interactions with vegetation dynamics or the CO2-balance of ecosystems. However, for
understand-5
ing the full range of interactions between atmospheric composition, climate change and terrestrial processes we need a much more integrative perspective. Our analysis seeks to provide an example of how to quantify a number of climatically relevant ecosystem processes in the large Eastern Siberian region in a consistent observational and mod-elling framework that accounts for the multiple interactions between emissions,
vegeta-10
tion and soils. It poses a challenge to combine effects of well mixed greenhouse gases and locally constrained, short-lived substances. On global-scale level, the opposing estimates in radiative effects from ecosystem-CO2 and BVOC–SOA interactions are miniscule but it is to be expected that some of the forcing effects from SOA could lead to a notable change in regional temperatures. Clearly, our numbers are uncertain
15
but they pinpoint the necessity for assessing surface–atmosphere exchange processes comprehensively in climate feedback analyses. While doing so, we are aware of the fact that a number of additional processes are not included in our analysis. For instance, it remains to be investigated whether a similar picture would emerge when additional feedback mechanisms are taken into consideration, e.g. SOA formation from isoprene
20
(Henze and Seinfeld, 2006) or effects of atmospheric water vapour on reaction rates and aerosol loads, or that some of the SOA might like to partition more to the gas-phase in a warmer climate. Likewise, neither the albedo effect of northwards migrating vegetation (Betts, 2000; W. Zhang et al., 2014), changes in the hydrology (which affects CH4 and N2O vs. CO2 fluxes), nor changes in C–N interactions (Zaehle et al., 2010)
25
ACPD
15, 27137–27175, 2015Future vegetation–climate
interactions in Eastern Siberia
A. Arneth et al.
Title Page
Abstract Introduction
Conclusions References
Tables Figures
◭ ◮
◭ ◮
Back Close
Full Screen / Esc
Printer-friendly Version Interactive Discussion
Discussion
P
a
per
|
Discussion
P
a
per
|
Discussion
P
a
per
|
Discussion
P
a
per
|
globally or regionally, with consistent model frameworks that account for the manifold interactions is not yet possible with today’s modelling tools.
Acknowledgements. A. Arneth acknowledges support from Swedish Research Council VR, and the Helmholtz Association ATMO Programme, and its Initiative and Networking Fund. The study was also supported by the Finnish Academy, grant 132100. The EU FP7 Bacchus project
5
(grant agreement 603445) is acknowledged for financial support. P. A. Miller acknowledges support from the VR Linnaeus Centre of Excellence LUCCI, R. M. Makkonen acknowledges support from the Nordic Centre of Excellence CRAICC. This study is a contribution to the Strategic Research Area MERGE.
10
The article processing charges for this open-access publication were covered by a Research Centre of the Helmholtz Association.
References
Ahlström, A., Schurgers, G., Arneth, A., and Smith, B.: Robustness and uncertainty in terrestrial ecosystem carbon response to cmip5 climate change projections, Environ. Res. Lett., 7,
15
044008, doi:10.1088/1748-9326/7/4/044008, 2012.
Arneth, A., Miller, P. A., Scholze, M., Hickler, T., Schurgers, G., Smith, B., and Prentice, I. C.: CO2inhibition of global terrestrial isoprene emissions: Potential implications for atmospheric chemistry, Geophys. Res. Lett., 34, L18813, doi:10.1029/2007GL030615, 2007a.
Arneth, A., Niinemets, Ü., Pressley, S., Bäck, J., Hari, P., Karl, T., Noe, S., Prentice, I. C., Serça,
20
D., Hickler, T., Wolf, A., and Smith, B.: Process-based estimates of terrestrial ecosystem isoprene emissions: incorporating the effects of a direct CO2-isoprene interaction, Atmos. Chem. Phys., 7, 31–53, doi:10.5194/acp-7-31-2007, 2007b.
Arneth, A., Schurgers, G., Hickler, T., and Miller, P. A.: Effects of species composition, land surface cover, CO2concentration and climate on isoprene emissions from European forests,
25
Plant Biol., 10, 150–162, doi:10.1055/s-2007-965247, 2008.
Arneth, A., Harrison, S. P., Zaehle, S., Tsigaridis, K., Menon, S., Bartlein, P. J., Feichter, J., Korhola, A., Kulmala, M., O’Donnell, D., Schurgers, G., Sorvari, S., and Vesala, T.: Terrestrial biogeochemical feedbacks in the climate system, Nat. Geosci., 3, 525–532, doi:10.1038/ngeo1905, 2010.
ACPD
15, 27137–27175, 2015Future vegetation–climate
interactions in Eastern Siberia
A. Arneth et al.
Title Page
Abstract Introduction
Conclusions References
Tables Figures
◭ ◮
◭ ◮
Back Close
Full Screen / Esc
Printer-friendly Version Interactive Discussion
Discussion
P
a
per
|
Discussion
P
a
per
|
Discussion
P
a
per
|
Discussion
P
a
per
|
Arneth, A., Schurgers, G., Lathiere, J., Duhl, T., Beerling, D. J., Hewitt, C. N., Martin, M., and Guenther, A.: Global terrestrial isoprene emission models: sensitivity to variability in climate and vegetation, Atmos. Chem. Phys., 11, 8037–8052, doi:10.5194/acp-11-8037-2011, 2011. Arneth, A., Mercado, L., Kattge, J., and Booth, B. B. B.: Future challenges of representing
land-processes in studies on land-atmosphere interactions, Biogeosciences, 9, 3587–3599,
5
doi:10.5194/bg-9-3587-2012, 2012.
Bäck, J., Aalto, J., Henriksson, M., Hakola, H., He, Q., and Boy, M.: Chemodiversity of a scots pine stand and implications for terpene air concentrations, Biogeosciences, 9, 689–702, doi:10.5194/bg-9-689-2012, 2012.
Betts, R. A.: Offset of the potential carbon sink from boreal forestation by decreases in surface
10
albedo, Nature, 408, 187–190, 2000.
Carslaw, K. S., Boucher, O., Spracklen, D. V., Mann, G. W., Rae, J. G. L., Woodward, S., and Kulmala, M.: A review of natural aerosol interactions and feedbacks within the Earth system, Atmos. Chem. Phys., 10, 1701–1737, doi:10.5194/acp-10-1701-2010, 2010.
Carslaw, K. S., Lee, L. A., Reddington, C. L., Pringle, K. J., Rap, A., Forster, P. M., Mann,
15
G. W., Spracklen, D. V., Woodhouse, M. T., Regayre, L. A., and Pierce, J. R.: Large contribution of natural aerosols to uncertainty in indirect forcing, Nature, 503, 67–71, doi:10.1038/nature12674, 2013.
Dentener, F., Kinne, S., Bond, T., Boucher, O., Cofala, J., Generoso, S., Ginoux, P., Gong, S., Hoelzemann, J. J., Ito, A., Marelli, L., Penner, J. E., Putaud, J.-P., Textor, C., Schulz, M.,
20
van der Werf, G. R., and Wilson, J.: Emissions of primary aerosol and precursor gases in the years 2000 and 1750 prescribed data-sets for AeroCom, Atmos. Chem. Phys., 6, 4321– 4344, doi:10.5194/acp-6-4321-2006, 2006.
Dolman, A. J., Maximov, T. C., Moors, E. J., Maximov, A. P., Elbers, J. A., Kononov, A. V., Waterloo, M. J., and van der Molen, M. K.: Net ecosystem exchange of carbon dioxide and
25
water of far eastern Siberian Larch (Larix cajanderii) on permafrost, Biogeosciences, 1, 133– 146, doi:10.5194/bg-1-133-2004, 2004.
Ehn, M., Thornton, J. A., Kleist, E., Sipila, M., Junninen, H., Pullinen, I., Springer, M., Rubach, F., Tillmann, R., Lee, B., Lopez-Hilfiker, F., Andres, S., Acir, I. H., Rissanen, M., Jokinen, T., Schobesberger, S., Kangasluoma, J., Kontkanen, J., Nieminen, T., Kurten, T., Nielsen, L.
30
ACPD
15, 27137–27175, 2015Future vegetation–climate
interactions in Eastern Siberia
A. Arneth et al.
Title Page
Abstract Introduction
Conclusions References
Tables Figures
◭ ◮
◭ ◮
Back Close
Full Screen / Esc
Printer-friendly Version Interactive Discussion
Discussion
P
a
per
|
Discussion
P
a
per
|
Discussion
P
a
per
|
Discussion
P
a
per
|
T. F.: A large source of low-volatility secondary organic aerosol, Nature, 506, 476–479, doi:10.1038/nature13032, 2014.
Elmendorf, S. C., Henry, G. H. R., Hollister, R. D., Bjork, R. G., Boulanger-Lapointe, N., Cooper, E. J., Cornelissen, J. H. C., Day, T. A., Dorrepaal, E., Elumeeva, T. G., Gill, M., Gould, W. A., Harte, J., Hik, D. S., Hofgaard, A., Johnson, D. R., Johnstone, J. F., Jonsdottir, I. S.,
5
Jorgenson, J. C., Klanderud, K., Klein, J. A., Koh, S., Kudo, G., Lara, M., Levesque, E., Magnusson, B., May, J. L., Mercado-Diaz, J. A., Michelsen, A., Molau, U., Myers-Smith, I. H., Oberbauer, S. F., Onipchenko, V. G., Rixen, C., Schmidt, N. M., Shaver, G. R., Spasojevic, M. J., Porhallsdottir, P. E., Tolvanen, A., Troxler, T., Tweedie, C. E., Villareal, S., Wahren, C. H., Walker, X., Webber, P. J., Welker, J. M., and Wipf, S.: Plot-scale evidence of tundra
10
vegetation change and links to recent summer warming, Nat. Clim. Change, 2, 453–457, doi:10.1038/nclimate1465, 2012.
Fiore, A. M., Naik, V., Spracklen, D. V., Steiner, A., Unger, N., Prather, M., Bergmann, D., Cameron-Smith, P. J., Cionni, I., Collins, W. J., Dalsoren, S., Eyring, V., Folberth, G. A., Ginoux, P., Horowitz, L. W., Josse, B., Lamarque, J.-F., MacKenzie, I. A., Nagashima, T.,
15
O’Connor, F. M., Righi, M., Rumbold, S. T., Shindell, D. T., Skeie, R. B., Sudo, K., Szopa, S., Takemura, T., and Zeng, G.: Global air quality and climate, Chem. Soc. Rev., 41, 6663-6683, doi:10.1039/c2cs35095e, 2012.
Fisher, R., McDowell, N., Purves, D., Moorcroft, P., Sitch, S., Cox, P., Huntingford, C., Meir, P., and Woodward, F. I.: Assessing uncertainties in a second-generation dynamic
veg-20
etation model caused by ecological scale limitations, New Phytologist, 187, 666–681, doi:10.1111/j.1469-8137.2010.03340.x, 2010.
Guenther, A., Hewitt, C. N., Erickson, D., Fall, R., Geron, C., Graedel, T., Harley, P., Klinger, L., Lerdau, M., McKay, W. A., Pierce, T., Scholes, B., Steinbrecher, R., Tallamraju, R., Taylor, J., and Zimmermann, P.: A global model of natural volatile organic compound emissions, J.
25
Geophys. Res., 100, 8873–8892, 1995.
Haapanala, S., Ekberg, A., Hakola, H., Tarvainen, V., Rinne, J., Hellén, H., and Arneth, A.: Mountain birch – potentially large source of sesquiterpenes into high latitude atmosphere, Biogeosciences, 6, 2709–2718, doi:10.5194/bg-6-2709-2009, 2009.
Hakola, H., Tarvainen, V., Bäck, J., Ranta, H., Bonn, B., Rinne, J., and Kulmala, M.: Seasonal
30
ACPD
15, 27137–27175, 2015Future vegetation–climate
interactions in Eastern Siberia
A. Arneth et al.
Title Page
Abstract Introduction
Conclusions References
Tables Figures
◭ ◮
◭ ◮
Back Close
Full Screen / Esc
Printer-friendly Version Interactive Discussion
Discussion
P
a
per
|
Discussion
P
a
per
|
Discussion
P
a
per
|
Discussion
P
a
per
|
Hallquist, M., Wenger, J. C., Baltensperger, U., Rudich, Y., Simpson, D., Claeys, M., Dommen, J., Donahue, N. M., George, C., Goldstein, A. H., Hamilton, J. F., Herrmann, H., Hoffmann, T., Iinuma, Y., Jang, M., Jenkin, M. E., Jimenez, J. L., Kiendler-Scharr, A., Maenhaut, W., McFiggans, G., Mentel, Th. F., Monod, A., Prévôt, A. S. H., Seinfeld, J. H., Surratt, J. D., Szmigielski, R., and Wildt, J.: The formation, properties and impact of secondary organic
5
aerosol: current and emerging issues, Atmos. Chem. Phys., 9, 5155–5236, doi:10.5194/acp-9-5155-2009, 2009.
Hens, K., Novelli, A., Martinez, M., Auld, J., Axinte, R., Bohn, B., Fischer, H., Keronen, P., Ku-bistin, D., Nölscher, A. C., Oswald, R., Paasonen, P., Petäjä, T., Regelin, E., Sander, R., Sinha, V., Sipilä, M., Taraborrelli, D., Tatum Ernest, C., Williams, J., Lelieveld, J., and
10
Harder, H.: Observation and modelling of HOx radicals in a boreal forest, Atmos. Chem.
Phys., 14, 8723–8747, doi:10.5194/acp-14-8723-2014, 2014.
Henze, D. and Seinfeld, J. H.: Global secondary organic aerosol from isoprene oxidation, Geo-phys. Res. Lett., 33, L09812, doi:10.1029/2006GL025976, 2006.
Hickler, T., Vohland, K., Feehan, J., Miller, P. A., Smith, B., Costa, L., Giesecke, T., Fronzek, S.,
15
Carter, T. R., Cramer, W., Kuhn, I., and Sykes, M. T.: Projecting the future distribution of Euro-pean potential natural vegetation zones with a generalized, tree species-based dynamic veg-etation model, Global Ecol. Biogeogr., 21, 50–63, doi:10.1111/j.1466-8238.2010.00613.x, 2012.
Holst, T., Arneth, A., Hayward, S., Ekberg, A., Mastepanov, M., Jackowicz-Korczynski, M.,
Fri-20
borg, T., Crill, P. M., and Bäckstrand, K.: BVOC ecosystem flux measurements at a high latitude wetland site, Atmos. Chem. Phys., 10, 1617–1634, doi:10.5194/acp-10-1617-2010, 2010.
Hussein, T., Dal Maso, M., Petäjä, T., Koponen, I. K., Paatero, P., Aalto, P. P., Hämeri, K., and Kulmala, M.: Evaluation of an automatic algorithm for fitting the particle number size
25
distributions, Boreal Environ. Res., 10, 337–355, 2005.
IPCC: Climate Change 2007: The Physical Science Basis, Summary for Policymakers, in: Con-tribution of Working Group I to the Fourth Assessment Report of the Intergovernmental Panel on Climate Change, Cambridge University Press, Cambridge, 2007.
Jokinen, T., Berndt, T., Makkonen, T., Kerminen, V.-M., Junninen, H., Paasonen, P.,
Strat-30
ACPD
15, 27137–27175, 2015Future vegetation–climate
interactions in Eastern Siberia
A. Arneth et al.
Title Page
Abstract Introduction
Conclusions References
Tables Figures
◭ ◮
◭ ◮
Back Close
Full Screen / Esc
Printer-friendly Version Interactive Discussion
Discussion
P
a
per
|
Discussion
P
a
per
|
Discussion
P
a
per
|
Discussion
P
a
per
|
Measured yields and atmospheric implications, P. Natl. Acad. Sci. USA, 112, 7123–7128, doi:10.1073/pnas.1423977112, 2015.
Kajos, M. K., Hakola, H., Holst, T., Nieminen, T., Tarvainen, V., Maximov, T., Petäjä, T., Arneth, A., and Rinne, J.: Terpenoid emissions from fully grown East SiberianLarix cajanderitrees, Biogeosciences, 10, 4705–4719, doi:10.5194/bg-10-4705-2013, 2013.
5
Kharuk, V., Ranson, K., and Dvinskaya, M.: Evidence of Evergreen Conifer Invasion into Larch Dominated Forests During Recent Decades in Central Siberia, Euras. J. Forest Res., 10, 163–171, 2007.
Khvorostyanov, D. V., Ciais, P., Krinner, G., and Zimov, S. A.: Vulnerability of east Siberia’s frozen carbon stores to future warming, Geophys. Res. Lett., 35, L10703,
10
doi:10.1029/2008GL033639, 2008.
Kobak, K. I., Turchinovich, I. Y., Kondrasheva, N. Y., Schulze, E. D., Schulze, W., Koch, H., and Vygodskaya, N. N.: Vulnerability and adaptation of the larch forest in eastern Siberia to climate change, Water Air Soil Poll., 92, 119–127, 1996.
Koven, C. D., Ringeval, B., Friedlingstein, P., Ciais, P., Cadule, P., Khvorostyanov, D., Krinner,
15
G., and Tarnocai, C.: Permafrost carbon-climate feedbacks accelerate global warming, P. Natl. Acad. Sci. USA, 108, 14769–14774, doi:10.1073/pnas.1103910108, 2011.
Kulmala, M., Dal Maso, M., Makela, J. M., Pirjola, L., Vakeva, M., Aalto, P., Miikkulainen, P., Hameri, K., and O’Dowd, C. D.: On the formation, growth and composition of nucleation mode particles, Tellus B, 53, 479–490, doi:10.1034/j.1600-0889.2001.530411.x, 2001.
20
Kulmala, M., Petäjä, T., Mönkkönen, P., Koponen, I. K., Dal Maso, M., Aalto, P. P., Lehtinen, K. E. J., and Kerminen, V.-M.: On the growth of nucleation mode particles: source rates of condensable vapor in polluted and clean environments, Atmos. Chem. Phys., 5, 409–416, doi:10.5194/acp-5-409-2005, 2005.
Lappalainen, H. K., Sevanto, S., Bäck, J., Ruuskanen, T. M., Kolari, P., Taipale, R., Rinne, J.,
25
Kulmala, M., and Hari, P.: Day-time concentrations of biogenic volatile organic compounds in a boreal forest canopy and their relation to environmental and biological factors, Atmos. Chem. Phys., 9, 5447–5459, doi:10.5194/acp-9-5447-2009, 2009.
Makkonen, R., Asmi, A., Kerminen, V. M., Boy, M., Arneth, A., Guenther, A., and Kulmala, M.: BVOC-aerosol-climate interactions in the global aerosol-climate model ECHAM5.5-HAM2,
30