Printed in Brazil - ©2005 Sociedade Brasileira de Química 0103 - 5053 $6.00+0.00
A
r
ti
c
le
* e-mail: [email protected]
Estimation of Rosuvastatin in Human Plasma by HPLC Tandem Mass Spectroscopic
Method and its Application to Bioequivalence Study
Sonu Sundd Singh*, Kuldeep Sharma, Harshvardhan Patel , Manish Jain, Hiten Shah, Sapna Gupta, Purav Thakkar, Nimesh Patel , Shri Prakash Singh and B. B. Lohray
Zydus Research Centre, Sarkhej-Bavla N.H. No. 8A, Moraiya, Ahmedabad-382213, India
Um método empregando LC-MS/MS foi desenvolvido para a análise de rosuvastatina em plasma humano, usando atorvastatina como padrão interno. Rosuvastatina é um fármaco para redução de lipídeos e prescrita para o tratamento do hipercolesterolemia e de dislipidimia. A extração em fase sólida (SPE) foi usada para purificação e pré-concentração do analito a partir da matriz do plasma humano. A separação cromatográfica foi conseguida em 6.0 min empregando fase móvel composta de 0.2% de ácido fórmico em água e acetonitrila (40: 60,v/v, na vazão de 1.0 mL min-1 e coluna YMC J’sphere ODS H-80, 150 x 4.6 mm, partículas de 4.0 μm. Na saída da coluna, a fase móvel foi dividida, sendo que 200 μL foram dirigidos para o espectrômetro de massas e 800 μL para o descarte. Pelo Monitoramento de Reação Múltipla (MRM), as transições foram medidas no modo positivo em m/z 482 - 258 para rosuvastatina e m/z 559 – 440 para o padrão interno, respectivamente. Uma validação detalhada do método foi realizada seguindo as recomendações do FDA americano e as curvas analíticas foram lineares no intervalo de 1.00 ng mL-1 a 50.00 ng mL-1 com coeficiente de correlação médio maior que 0.99. A recuperação absoluta foi maior que 50.14% para rosuvastatina e 54.65% para o padrão interno. Rosuvastatina foi estável por 138 dias a -70 ± 5 °C e por 24 horas à temperatura ambiente. Após a extração do plasma, as amostras reconstituídas de rosuvastatina permaneceram estáveis no auto injetor, a 10 °C, por 8 horas. Depois de submetidas a três ciclos de congelamento/descongelamento, não houve mudanças na recuperação do analito. O método é simples, específico, sensível, preciso, exato e apropriado para aplicações em bioequivalência e estudos farmacocinéticos. Foi aplicado com sucesso em um estudo piloto de bioequivalência da rosuvastatina, comprimidos – Zydus, Cadila, India versus comprimidos - Crestor, Astra Zeneca, EUA, em voluntários sadios do sexo masculino.
A LC-MS/MS method has been developed for the estimation of rosuvastatin in human plasma using atorvastatin as internal standard. Rosuvastatin is a lipid-lowering drug prescribed for the treatment of hyper-cholestrolemia and dyslipidimia. Solid phase extraction (SPE) was used for the purification and pre-concentration of analyte from human plasma matrix. The chromatographic separation was achieved within 6.0 min by an isocratic mobile phase containing 0.2% formic acid in water and acetonitrile (40: 60, v/v), flowing through YMC J’ Sphere ODS H-80, 150 x 4.6 mm, 4.0 μm analytical column, at a flow rate of 1.0 mL min-1 with split of 200 μL to mass spectrometer and 800 μL to waste. Multiple reaction monitoring (MRM) transitions were measured in the positive mode at m/z 482 and 258 for rosuvastatin and m/z 559 and 440 for internal standard respectively. A detailed validation of the method was performed as per USFDA guidelines and the standard curves were found to be linear in the range 1.0 ng mL-1 to 50.0 ng mL-1 with the mean correlation coefficient more than 0.99. The absolute recovery was more than 50.14% for rosuvastatin and 54.65% for internal standard. In human plasma, rosuvastatin was stable for 138 days at –70 ± 5 °C and for 24 hours at ambient temperature. After extraction from plasma, the reconstituted samples of rosuvastatin were stable in auto sampler at 10 °C for 8 hours. Upon subjecting to three freeze thaw cycles, there was no change in the recovery of the analyte. The method was simple, specific, sensitive, precise, accurate and suitable for bioequivalence and pharmacokinetic studies. It was successfully applied to the pilot bioequivalence study of rosuvastatin 20 mg tablets of M/s Zydus Cadila health care Ltd. India versus 20 mg Crestor tablet of M/s Astra Zeneca, USA; in male human subjects.
Introduction
Rosuvastatin is a lipid-lowering drug.1,2 It inhibits the
enzyme 3-hydroxy-3 methyl glutaryl Coenzyme A (HMG-CoA) reductase, the rate limiting enzyme that converts HMG-CoA to mevalonate a precursor of cholesterol and thereby checks the synthesis of cholesterol. Rosuvastatin reduces total cholesterol, low density lipoprotein (LDL) cholesterol and triglycerides (TG) and increases high density lipoprotein (HDL) in patients with hypercholestrolemia and dyslipidimia.
Several LC-MS methods have been reported for the estimation of rosuvastatin3-8 and its metabolite9 in biological
matrices. Amongst them the LC-MS/MS method3 used for
the analysis of human plasma samples derived from clinical trials of Crestor tablets is the most sensitive one, with a limit
of quantitation of 0.1 ng mL-1. The method employed
deutrated rosuvastatin as an internal standard. The sample purification and pre-concentration were performed by solid phase extraction (SPE). Chromatographic separation was performed with a mobile phase (methanol: 0.2% formic acid in water 70:30 v/v) flowing through a Luna C18 column
5mm (4.6 mm I.D 5 150 mm) at a flow rate of 1.0 mL min-1
with split of 200 mL to mass spectrometer and 800 mL to waste. The calibration curves were linear in the range of 0.1 ng mL-1 to 30.0 ng mL-1.
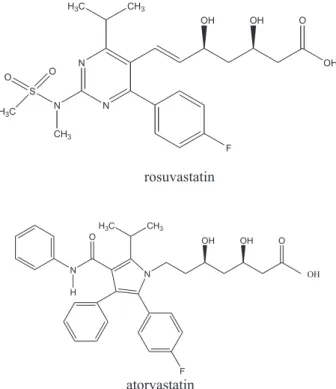
The scope of the present investigation was limited to the quantification of rosuvastatin (Figure 1) in a single dose
bioequivalence study of 20 mg rosuvastatin tablets of M/s
Zydus Cadila versus Crestor tablet of M/s Astra Zeneca.
Therefore, we opted for a cheaper and readily available internal standard atorvastatin (Figure 1) instead of deuterated
rosuvastatin. Based on the Cmax value of rosuvastatin, a
suitable linearity range of 1.0 ng mL-1 to 50.0 ng mL-1 was
selected. Instead of Luna column used by earlier workers,3
the present method was developed on a YMC J’ Sphere ODS H-80 column 4 mm (4.6 mm I.D 5150 mm) which was readily available and the mobile phase was modified accordingly to achieve the desired separation within 6.0 min (Figure 2). Tandem mass spectrometric detection allowed the
quantification of rosuvastatin up to 1.0 ng mL-1. Although
the chromatographic run time is almost similar in both the
methods the reconstitution volume of the reported method3
was 130 μL with an injection volume of 100.0 μL, which
would not allow re-injection of the samples in case of any disaster. The method reported in the present investigation is
Figure 1. Structures of rosuvastatin and internal standard atorvastatin.
Figure 2. a)Representative LC-MS/MS chromatogram of blank
devoid of any such draw back with a reconstitution volume
of 250 μL and injection volume of 50 μL. Moreover if
required the method has the flexibility of lowering the LLOQ
to 0.25 ng mL-1 by increasing the injection volume to 100
µL and decreasing the reconstitution volume to 125 μL. No
pretreatment of plasma was performed in the present method
as compared to reported method3 where all the plasma
samples were diluted two fold with acetate buffer (0.1 mol L-1, pH 4) prior to assay rendering the effective concentration as 0.2 ng mL-1,4 instead of 0.1 ng mL-1. The present method
employs a cheaper version of SPE cartridges 20-position extraction manifold instead of 96 well plate format used by
the innovators.3 The present method appears to be more
economical and suitable for routine bioequivalence studies. A detailed validation of analytical method was performed
in accordance with USFDA guidelines10 to yield reliable
results that could satisfactorily interpret the outcome of the bioequivalence study in male human subjects.
Materials and Methods
Chemicals and reagents
Working standards of rosuvastatin (batch No. RST-Ca / 052 / 082, purity 99.25%) and internal standard atorvastatin (batch No. WS080C0, purity 99.58%) were prepared in house (Cadila Health Care Ltd., Ahmedabad, India). Acetonitrile and methanol (HPLC grade) were obtained from Merck, Darmstadt, Germany. Formic acid and glacial acetic acid was supplied by E. Merck (India) Ltd. Human plasma was obtained from Gujarat Blood Bank, Ahmedabad, India. Q Water from Millipore’s Milli-Q System was used throughout the analysis.
Stock solutions and standards
Stock and working solutions of rosuvastatin and atorvastatin were prepared by dissolving an appropriate amount of the drug with a mixture of water and methanol (1:1, v/v) and were stored at 2 to 8 ºC. Eight non-zero
calibration standards ranging from 1.00 to 50.00 ng mL-1
were prepared by adding 50 μL of a known working
solution of rosuvastatin and 50 μL of internal standard
solution to 450 μL of drug free human plasma containing
EDTA as anticoagulant. The quality control samples (QC) were prepared in the manner similar to the calibration standard at three concentration levels – low, medium (mid)
and high (3.0, 15.0 and 45.0 ng mL-1). During each run, six
replicates of QC samples were extracted along with the calibration standards to verify the reproducibility, repeatability and integrity of the method.
Sample preparation
After adding 50 μL of internal standard to 500 μL of
plasma samples obtained from human subjects, solid phase
extraction (SPE) was performed using Water’s Oasis® HLB
1cc (30 mg) cartridges and 20 position extraction manifold. The SPE cartridges were conditioned with 1.0 mL methanol followed by equilibration with 1.0 mL water. Thereafter,
500 μL plasma sample spiked with internal standard were
loaded on the conditioned cartridge. In order to remove water-soluble interference, washing was performed with 2.0 mL water. The analytes of interest were finally eluted from SPE cartridge with 1.0 mL of eluent (0.5% glacial acetic acid in methanol). The eluent was evaporated to dryness in a thermostatically controlled water-bath maintained at 40 ºC under the stream of nitrogen for about 25 min. After drying,
the residue was reconstituted in 250 μL of diluent
(acetonitrile: 0.5% glacial acetic acid in water (1:1 v/v)) and injected in liquid chromatograph.
Chromatographic and MS / MS conditions
Chromatographic separation was performed with a mobile phase (acetonitrile: 0.2% formic acid in water 60: 40 v/v) flowing through a YMC J Sphere ODS H-80 column
4 μm (4.6 mm I.D 5150mm) maintained at 30 °C, with a
flow rate of 1.0 mL min-1 with split of 200 μL to mass
spectrometer and 800 μL to waste. Under these conditions,
the retention time for rosuvastatin and the internal standard were around 2.50 min and 4.36 min (Figure 2). The
injection volume was 50 μL and the injector needle wash
solvent was acetonitrile: water (50:50, v/v).
The API 3000-LC-MS/MS system, PE Sciex, Foster City California, USA was operated in the positive ion mode with Turbo ion spray heater set at 250 °C. Multiple Reaction Monitoring (MRM) transitions measured for rosuvastatin
were m/z 482 and 258 for rosuvastatin and m/z 559 and
440 for internal standard respectively with a 400 ms dwell time of for both .The ion spray voltage was set at +5800 V, the ring voltage at 195 V, and the orifice voltage at 70 V. The nebuliser gas (zero air) pressure was 10 and the Turbo
ion spray gas flow rate at 6.0 L min-1 (zero air). The
collision gas (nitrogen) was set at 8 and the curtain gas (nitrogen) was set at 12. The deflector was set at –400 V and the channel electron multiplier at 2900 V.Collision
energy (RO2-Q0) was –45.0 V. Quantitation of the analytes
in human plasma was based on the peak area ratio of
rosuvastatin versus internal standard. The data acquisition
Validation
Linearity. To establish the linearity, a series of calibration standards (1.0, 2.0, 5.0, 10.0, 30.0, 40.0 and
50.0 ng mL-1) were prepared by adding 50 μL of respective
working solution of rosuvastatin and 50 μL of 500 ng mL-1
of internal standard solution to 450 μL of drug free human
plasma and analyzed. Five linearity curves containing eight non-zero concentrations were analyzed. A correlation of more than 0.99 was desirable. The lowest standard on the
calibration curve was to be accepted10 as the lower limit of
quantitation (LLOQ) if the analyte response in the standard was five times more than that of drug free (blank) plasma. In addition, the analyte peak in LLOQ sample should be identifiable, discrete, and reproducible with a precision of ±20.0% and accuracy within 80.0% to 120.0%. The deviation of standards other than LLOQ from the nominal concentration should not be more than ±15.0%. It was desirable that a minimum of six non-zero standards, including LLOQ, met the above criteria.
Specificity. At least six randomly selected control drug free human plasma samples were processed by the similar solid phase extraction procedure and analyzed to determine the extent to which endogenous plasma components may contribute to the interference at retention time of analyte and internal standard.
Recovery (extraction efficiency) from plasma matrix. Recovery of rosuvastatin was evaluated by comparing the mean peak responses of six extracted quality control (QC) samples of low, medium and high concentrations to mean peak responses of six plain standards of equivalent concentration. Similarly, the recovery of internal standard
was also evaluated. As per the acceptance criteria10 the
recovery of the analyte need not be 100.0%, but the extent of recovery of an analyte should be consistent, precise and reproducible.
Accuracy and precision (inter and intra day). Intra day accuracy and precision were evaluated by replicate analysis of rosuvastatin at different concentrations in human plasma. The run consisted of a calibration curve plus six replicates of each lower limit of quantification (LLOQ), low, medium and high quality control (QC) samples. The inter day accuracy and precision were assessed by analysis of LLOQ, low, medium and high quality control samples for rosuvastatin on minimum of four separate occasions. The precision of the method was determined by calculating the percent coefficient of variation (% CV) for the concentrations obtained for different determinations. For the evaluation of precision, the deviation of each concentration level from the nominal concentration was expected to be within ±15.0% except
for the LLOQ, for which it should not be more than
± 20.0%.10 Similarly, the mean accuracy should not deviate
by ± 15.0% of the nominal concentration except for the LLOQ where it should not deviate by more than ± 20.0% of the nominal concentration
Stability.Six aliquots of each, low and high QC samples were stored in deep freezer at –70 ± 5 °C for 138 days. The samples were processed along with precision and accuracy batch and concentrations obtained were compared with nominal concentrations to determine the long-term stability of rosuvastatin in human plasma.
In order to determine the short-term stability of plasma samples six aliquots each of the low and high-unprocessed QC samples were kept at ambient temperature (23-30 °C) for 24.0 hours. After 24 hours the samples were processed, analyzed and compared with nominal concentrations.
Autosampler stability was determined by analyzing six aliquots each of low and high QC samples that were processed and reconstituted before storing at 10 °C for 8.0 hours. After completion of 8.0 hours, samples were reanalyzed and concentrations compared with the freshly prepared control samples. For determining the solution
stability of rosuvastatin working solutions of 15.0 ng mL-1
were kept at 2 to 8 °C for 138 days. Thereafter, the mean area of rosuvastatin from three replicate chromatographic runs was compared to theoretical concentration.
Effect of freeze and thaw cycles on stability of plasma samples after three freeze and thaw cycles was also was determined. Six aliquots each of low and high-unprocessed quality control samples were stored at – 70 ± 5 °C and subjected to three freeze thaw cycles. After the completion of third cycle the samples were processed, analysed and results were compared with nominal values. All the stability samples were considered stable if the deviation from the nominal concentration was within ±15%.
Study design. The above method was applied to compare the single dose oral relative bioavailability and to establish bioequivalance of 20 mg rosuvastatin tablets of M/s. Cadila Healthcare Ltd., India, with that of Crestor tablets of M/s. Astra Zeneca, USA, in healthy, adult, male, human subjects under fasting condition.
The study was conducted using an experimental
design11 of two way crossover single blind and randomized
Research) and USFDA guidelines.11 Blood samples were withdrawn at 0, 1, 2, 3, 4, 5, 6, 7, 8, 10, 14, 24, 48, and 96 hours after the oral administration of the dose. Samples were centrifuged and plasma was separated and stored at – 70 ± 5 °C until analysis was performed using a previously validated LC-MS/MS method.
The pharmacokinetic parameters namely maximum
plasma concentration (Cmax), time point of maximum
plasma concentration (Tmax), area under the plasma
concentration-time curve from 0 hr to the last measurable
concentration (AUC0-t), area under the plasma
concentration-time curve from 0 h to infinity (AUC0-∞),
elimination rate constant (λZ) and half-life of drug
elimination during the terminal phase (t1/2) were calculated
for rosuvastatin in test and reference formulations using non-compartmental model of WinNonlin Professional Software version 4.0.1 (Pharsight Corporation, USA). The mean pharmacokinetic parameters obtained for the test and reference formulation are presented in Table 5. The statistical analysis of pharmacokinetic parameters was
performed using SAS ® Release 8.2 (SAS Inc. USA).
Based on the statistical results of 90% confidence intervals for the ratios of the means of ln-transformed
pharmacokinetic parameters, namely Cmax, AUC0-t and
AUC0-∞, conclusions were drawn as to whether the test
formulation was bioequivalent to the reference formulation. Bioequivalence was to be concluded if the 90% confidence interval fell within the bioequivalence
range12 of 80.0 to 125.0% for C
max, AUC0-t and AUC0-∞.
Results and Discussion
Bio-analytical method validation
Linearity and limit of quantitation .Calibration curves were found to be linear and precise over the calibration
range of 1.0 to 50.0 ng mL-1. The lower limit of quantitation
was 1.0 ng mL-1 (lowest standard level) with coefficient of
variation of 4.46% and accuracy of 102.45%. The upper
limit of quantitation was 50.0 ng mL-1 with coefficient of
variation of 2.97% and accuracy 96.08%. Results are presented in Table 1. The correlation coefficient ranged between 0.9950 to 0.9985 with an average value of 0.9972 (Table 1). Back calculations were made from the calibration curves to determine accuracy of each calibration standard
Specificity. There was no significant interference at the retention times for rosuvastatin or internal standard from six different batches of drug free human plasma used for analysis.
Recovery (extraction efficiency) from plasma matrix. The mean recovery for rosuvastatin in human plasma ranged between 50.14 to 52.41% and data are presented in Table 2. The mean recovery for internal standard was 54.65% with a coefficient of variation of ±12.14%.
Accuracy and precision (inter and intra day).The coefficient of variation for (Intra-day) accuracy was between 2.85 to 5.78% and the accuracy values were found to be between 96.23% to 113.90% in human plasma as presented in Table 3. Inter day accuracy was between 96.08 to 108.17% with coefficient of variation of 8.92 to 15.48% (Table 3).
Stability. Rosuvastatin was stable at –70 ± 5 °C for 138 days (long term stability) in human plasma. The percent changes (bias) in rosuvastatin concentration over the stability-testing period of 138 days in deep freezer at –70 ± 5°C were -1.65% and –2.40% at the concentrations of
3.0 ng mL-1 and 45.0 ng mL-1 respectively.
Rosuvastatin was found to be stable over 24.0 hours in human plasma at room temperature (23-30 °C). The percent bias observed were 3.92 and –3.32 at the concentration of
3.0 ng mL-1 and 45.0 ng mL-1 (i.e. LQC and HQC)
respectively (Table 4). In the auto-sampler at 10 °C, reconstituted samples of rosuvastatin were stable for 8.0 hours after sample processing. Percent bias for reconstituted
Table 1. Summary of rosuvastatin calibration standards in human plasma
Concentration Mean Concentration SD CV Accuracy n
added (ng mL-1) found (ng mL-1) (%) (%)
1.0 1.02 0.05 4.46 102.45 5
2.0 1.92 0.03 1.75 95.99 5
5.0 5.24 0.17 3.21 104.72 5
10.0 10.59 0.45 4.20 105.88 5
20.0 18.73 0.54 2.90 93.63 5
30.0 30.36 1.18 3.89 101.19 5
40.0 39.50 1.73 4.38 98.74 5
50.0 48.04 1.43 2.97 96.08 5
Mean Correlation coefficient 0.9972 0.015
Mean Y intercept 0.0442 0.0132
samples after 8.0 hours were –4.3 and –7.69 at LQC and HQC levels (Table 4). Frozen plasma samples containing rosuvastatin were found to be stable even after subjecting to three-freeze thaw cycles. The percent bias observed were -11.18 and –11.48 at the two concentrations studied, as shown in Table 4. Working solutions of rosuvastatin and internal standard were found to be stable for 138 days at 2 °C to 8 °C.
Table 5. Mean pharmacokinetic parameters and 90.0% confidence interval for rosuvastatin, after the administration of an oral dose of 20 mg
of test and reference formulations to healthy human volunteers
Pharmacokinetic parameters Reference formulation (Mean ± SD) Test formulation (Mean ± SD) confidence limit 90.0%
Tmax(h) 2.69 ±1.60 2.69 ± 1.79
-Cmax (ng mL-1) 29.48 ± 18.42 33.75 ± 20.94 91.45%-114.24%
AUC0-t (ng h mL-1) 232.28 ± 124.49 257.96± 209.60 84.88%-122.25%
AUC0-∞(ng h mL-1) 254.83± 137.33 282.54 ± 233.58 86.40%-119.29%
T1/2 (h) 6.28 ± 1.66 6.77 ± 2.34
-λZ (1/h) 0.118 ± 0.03 0.112 ± 0.03
-Table 4. Summary of stability of rosuvastatin in human plasma
Stability Conc. added Mean Conc. found SD CV Bias n
(ng mL-1) (ng mL-1)
Long Term 3.0 2.74 0.34 12.31 -1.65 6
(138 days) 45.0 39.31 0.58 1.48 -2.40 6
short term 3.0 3.42 0.56 16.44 3.92 6
(24 h) 45.0 44.81 2.93 6.55 -3.32 6
Auto sampler 3.0 3.15 0.76 24.13 -4.30 6
(8 h) 45.0 42.78 2.37 5.54 -7.69 6
freeze 3.0 2.92 0.16 5.63 -11.48 6
thaw 45.0 41.16 2.14 5.20 -11.18 6
Table 3. Intra day and inter day accuracy of rosuvastatin in human plasma
Accuracy QC Conc. Mean Conc. SD CV Accuracy n
and Samples added found (%) (%)
Precision (ng mL-1) (ng mL-1)
Intra day LLOQ 1 1.14 0.05 4.74 113.9 6
Low 3 2.89 0.08 2.85 96.23 6
Mid 1 5 16.75 0.62 3.72 111.68 6
High 4 5 43.84 2.53 5.78 97.41 6
Inter day LLOQ 1 1.08 0.17 15.48 108.17 2 4
Low 3 3.17 0.38 11.88 105.73 2 4
Mid 1 5 15.72 1.79 11.41 104.77 2 4
High 4 5 43.24 3.85 8.92 96.08 2 4
Table 2. Recovery of rosuvastatin in human plasma
QC Conc. Mean CV n
Samples Added (ng mL-1) Recovery (%) (%)
Low 03.0 50.14 14.59 6
Mid 15.0 52.41 14.43 6
High 45.0 50.78 04.29 6
Statistical evaluation of pharmacokinetic parameters
The pharmacokinetic comparison between the two
formulations was made in terms of extent (AUC 0-t and
AUC 0-∞) and rate (Cmax and Tmax )of absorption. The mean pharmacokinetic parameters for the test and reference formulation are presented in Table 5.
Rate of absorption. The mean Cmax for the reference
and test formulation were 29.48 ± 18.42 ng mL-1 and 33.75
± 20.94 ng mL-1 respectively (TABLE 5). The two
one-sided 90% confidence interval for the ratio of the
ln-transformed means of Cmax was found to be
91.45%-114.24% (Table 5). This interval was within the acceptance limit of 80.0 to 125.0%, required for the conclusion of
bioequivalence. The mean Tmax for reference and test
Extent of absorption. The mean AUC0-t and AUC0-∞ for
the referenceand test formulation are presented in Table 5.
The two one-sided 90% confidence interval for the ratios
of the ln-transformed means of AUC0-t and AUC0-∞ was found
to be 84.88% to 122.25% and 86.40% to 119.29% respectively. These intervals were within the acceptance limits of 80.0 to 125.0%, as required for the conclusion of bioequivalence.
These observations confirm that the test product (rosuvastatin tablets containing 20 mg rosuvastatin manufactured by Cadila Healthcare Ltd., India) was bioequivalent to the reference product (Crestor tablet containing 20 mg of rosuvastatin M/s Astra Zeneca, USA) in terms of rate and extent of absorption. The mean
concentration versus time graphs for the two formulations
are shown in Figure 3. In addition, there were no reports of any adverse events during the conduct of the study.
Conclusions
The statistical analysis of pharmacokinetic parameters confirmed that the test product of M/s. Cadila Healthcare Ltd., India, when compared with the reference product Crestor tablet of M/s. Astra Zeneca, USA, were bioequivalent in terms of rate and extent of absorption.
The bio-analytical methodology described in this manuscript was specific, sensitive accurate and precise enough to be successfully applied to bioequivalence study. The method employed sample preparation by solid phase extraction (SPE) with adequate recovery, followed by isocratic HPLC coupled with tandem mass spectrometric
detection (LC-MS/MS). The LC-MS/MS method was
capable of estimating rosuvastatin up to 1.0 ng mL-1
accurately in human plasma with accuracy and precision.
References
1. Crestor Product monograph and Product leaflet. http://www.hc-sc.gc.ca/hpfb-dgpsa/tpd-dpt/crestor2_hpc_e.html, accessed in June 3, 2005.
2. Hanefled, M.; Int. J. Clin. Pract.2001, 55, 399.
3. Hull, C. K.; Penman, A. D.; Smith, C. K.; Martin, P. D.; J. Chromatogr. B2002, 772, 219.
4. Cooper, K.J.; Martin, P.D.; Dane, A.L.; Warwick, M.J.; Raza, A.; Schneck, D.W.; British Journal of Clinical Pharmacology
2003, 55, 94.
5. Prueksaritanont, T.; Tang, C.; Qui, Y.; Mu, L.; Subramanian, R.; Lin, J. H.; Drug Metab. Dispos. 2002, 30, 1280. 6. Prueksaritanont, T.; Subramanian, R.; Fang, X.; Ma, B.; Qui,Y.;
Lin, J. H.; Pearson, P.G .; Baillie, T.A.; Drug Metab. Dispos.
2002, 30, 505.
7. Prueksaritanont, T.; Zhao, J.; Ma, B.; Roadcap, B.; Tang, C.; Qui,Y.; Liu, L.; Lin, J.H.; Pearson, P.G.; Baillie, T.A.; J. Pharmacol. Exp. Ther.2002,301, 1042.
8. Kosoglu, T.; Statkevich, P.; Yang, B.; Suresh, R.; Zhu,Y.; Boutros, T.; Maxwell, S.E.; Tiessen, R.; Cutler, D.L.; Curr. Med. Res. Opin. 2004, 20, 1185.
9. Hull, C.K.; Martin, P.D.; Warwick, M.J.; Thomas, E.; Journal of Pharmaceutical and Biomedical Analysis2004, 35, 609. 10.Guidance for Industry: Bioanalytical Method Validation, U.S.
Department of Health and Human Services, Food and Drug Administration Centre for Drug Evaluation and Research (CDER), Centre for Veterinary Medicine (CVM), May 2001 BP, http://www.fda.gov/cder/guidance/index.htm, 2004. 11.FDA Guidance for Industry: Biaoavaliability Studies for Orally
Administered Drug – Products-General Considerations, US Department of Health and Human Services, Food and Drug Administration, Centre for Drug Evaluation and Research (CDER), 2000, http://www.fda.gov/cder/guidance/index.htm, 2004.
12.FDA Guidance for Industry: Statistical Approaches to Establishing Bioequivalence, US Department of Health and Human Services, Food and Drug Administration, Centre for Drug Evaluation and Research (CDER), 2001, http:// www.fda.gov/cder/guidance/index.htm, 2004.
Received: June 14, 2004
Published on the web: July 27, 2005
Figure 3. Mean plasma concentration versus time curves of