Article
Printed in Brazil - ©2013 Sociedade Brasileira de Química 0103 - 5053 $6.00+0.00
A
*e-mail: [email protected]
Distributions of Trace Metals in Sediment Cores from a
Hypertrophic Reservoir in Northeast Brazil
Izaias S. Santos, Carlos A. B. Garcia, Elisangela A. Passos and Jose P. H. Alves*
Laboratório de Química Analítica Ambiental, Departamento de Química, Universidade Federal de Sergipe, 49100-000 São Cristóvão-SE, Brazil
As distribuições de Al, Cu, Co, Cr, Fe, Mn, Ni, Pb e Zn foram investigadas em dois sítios de sedimentos do reservatório Macela, Nordeste do Brasil. A análise de componentes principais (PCA) separou nitidamente os sítios de sedimentos coletados e as suas diferentes seções. Cu, Cr, Mn e Zn apresentaram as maiores concentrações nas seções do topo (0-20 cm) e mostraram correlações significativas com o conteúdo de carbono orgânico total (Corg). As concentrações de
Co, Pb e Ni foram maiores nas seções do fundo (25-45 cm) e mostraram fortes correlações com alumínio. Cu, Cr, Mn e Zn foram provenientes do aporte antropogênico, enquanto que Co, Ni e Pb foram de origem natural. As toxicidades avaliadas com base nos valores do nível limiar de efeitos (TEL) e nível provável de efeitos (PEL) listados no Sediment Quality Guidelines (SQG) canadense mostraram que Cu, Pb e Zn raramente exercem efeitos adversos aos organismos, enquanto que para o Ni, esses efeitos biológicos ocorrem frequentemente à biota do reservatório. A toxicidade do Cr foi incerta.
The distributions of Al, Cu, Co, Cr, Fe, Mn, Ni, Pb and Zn were measured in two sediment cores obtained from the Macela Reservoir in Northeast Brazil. Principal component analysis (PCA) clearly separated both the cores and the sections corresponding to different depths. The concentrations of Cu, Cr, Mn and Zn were highest in the upper sections (0-20 cm), and were significantly correlated with the total organic carbon (Corg) content. The concentrations of Co,
Pb and Ni were highest in the lower sections (25-45 cm), and showed strong correlations with aluminum. Cu, Cr, Mn and Zn were derived from anthropogenic sources, while Co, Ni and Pb were of natural origin. Toxicity assessment based on the threshold effect level (TEL) and probable effect level (PEL) values listed in the Canadian Sediment Quality Guidelines (SQG) showed that Cu, Pb and Zn rarely cause any adverse effects, while Ni was likely to cause frequent effects in the biota of the reservoir. The toxicity of Cr was uncertain.
Keywords: reservoir sediment, trace metals, PCA, bioavailability, toxicity
Introduction
Lakes are stationary bodies of water occupying hydrographic basins that have no connection to the ocean, and their contents of dissolved ions are low compared to those found in seawater. These aquatic systems include artificial lakes (reservoirs), which are of considerable importance due to their multiplicity of uses. However, reservoirs can be adversely affected by discharges of domestic, industrial and agricultural wastes that can cause problems including eutrophication, increased sediment deposition and higher concentrations of metals and other potentially toxic species.1
In recent years, there has been an increase in the number of investigations of metals in sediments. These deposited materials are no longer considered only as stores of chemical substances, but rather as an active aquatic compartment that fulfills a fundamental role in redistributing these substances to biota.2-4
temperature, pH and dissolved organic carbon content of the water.8,9
The question of availability (and consequently the toxicity) of metals in sediments has resulted in environmental control agencies worldwide that establish quality standards for these pollutants. In North America, the management of sediment quality is based on the Sediment Quality Guidelines (SQG) for freshwater and coastal marine ecosystems. These guidelines provide information concerning the relationships between the concentrations of pollutants in the sediment and any adverse effects resulting from exposure of biota to the contaminants.4,10,11
SQG serve as a basis for determining the quality of the sediment in terms of the presence of chemical substances that might be toxic to biota,10 and although they were originally developed for use in North America, the criteria set out in the SQG have been used to evaluate concentrations of contaminants in sediments in various regions of the world.12-17 These criteria use sediment as an indicator of pollution, and can aid in understanding the quality of sediments in regions where measurements are scarce.12,15,18-20
The present work presents the vertical distributions of the metals Al, Cu, Co, Cr, Fe, Mn, Ni, Pb and Zn in two sediment cores from the Macela Reservoir, located in Sergipe State in Northeast Brazil. Principal component analysis (PCA) was applied to the profiles of the measured chemical parameters in order to identify groupings between the parameters and/or the core sections. Potential factors that might control the distribution and mobility of the metals in the sediments were also investigated. Possible toxicity associated with the presence of metals in the sediments was evaluated by comparison of measured concentrations with the SQG reference values.
Experimental
Study region
The Macela Reservoir is located in the municipality of Itabaiana City in Sergipe State, Northeast Brazil (latitude 10º40’08” S, longitude 37º24’35” W, altitude ca. 222 m). The reservoir is a shallow body of water, with a maximum depth of around 7 m, constructed during 1953-1957 by damming the Fuzil Creek in the hydrographic basin of the Sergipe River. The area and water storage capacity of the reservoir are 14 km2 and 2.7 × 10⁶ m3, respectively, and the local population is 76813 inhabitants. The reservoir was projected to supply water to irrigate 156 ha of agricultural land.21
The economic activities in the region surrounding the reservoir include small food, footwear, drink, ceramics and
furniture industries, as well as agricultural cultivation and cattle ranching. Most residences have no sewage treatment systems, and some have no supply of treated water or other basic services. For this reason, the Macela Reservoir is highly eutrophicated, and the main point source discharges of N and P into the reservoir are domestic sewage and the effluents from a variety of small industries.21
Sampling and sample preparation
Collection of the sediment samples was undertaken in November 2008 at two locations, one upstream (core 1; 10º40’20.06” S, 37º25’19.31” W), at the mouth of the Fuzil Creek, and the other downstream (core 2; 10º40’9.11” S, 37º24’76.77” W), close to the reservoir dam (Figure S1 in the Supplementary Information (SI) section).
Two sediment cores, each to a depth of approximately 45 cm, were collected using a core sampler consisting of a cellulose acetate-butyrate tube. In the field, each core was divided into 5 cm sections, which were placed into previously decontaminated plastic containers and stored in ice in insulated polystyrene foam boxes during transport to the laboratory. All equipment used during sampling was non-metallic in order to avoid any possibility of contamination of the samples. In the laboratory, the sediments were dried to a constant mass at 50 oC for 72 h in a forced air circulation oven. They were then carefully broken up and sieved (< 2.0 mm) to separate out fragments of wood and gravel, and transferred to decontaminated flasks for storage prior to analysis.
Reagents
All reagents used were high purity grade (obtained from Merck). Ultrapure water (18.2 MΩ cm) was used throughout. Stock 1000 mg L-1 standard solutions of Al, Cu, Co, Cr, Fe, Mn, Ni, Pb and Zn were prepared from ampoules of Tritisol metal standards (Merck). The dilute solutions used to construct the analytical curves were prepared from the stock solutions at the time of analysis. The LKSD-1/ CCRPM/Canada lake sediment standard reference material (SRM) was used to evaluate the extraction recoveries achieved for the metals and organic carbon.
Instrumentation
absorbance readings were made in triplicate. The organic carbon contents of the samples were measured using an elemental analyzer (Flash ES 1112). The sediment samples were digested using a digester block (Tecnal TE007A) equipped with polytetrafluoroethylene (PTFE) reaction vessels.
Extraction procedure for determination of total metal concentrations
Approximately 0.6 g portions of each dry sediment sample were transferred to the PTFE reaction vessels. A combination of acids (HCl + HNO3 + HF) was then added, and the mixture was heated at 140 ºC for 2 h. The extract obtained was filtered prior to determination of the metals using FAAS.22
The efficiency of the extraction technique was measured by analysis of three replicates of the lake sediment SRM. The measured metal concentrations varied between 92 ± 8 (Fe) and 117 ± 12% (Co) of the certified values, with no significant differences (at the 95% confidence level). The accuracy of the technique was therefore considered to be satisfactory, especially considering the complexity of the matrix. The limits of detection (LOD) were calculated from ten readings of the blank solution, made on different days, and varied between 0.04 ± 0.01 (Cr and Mn) and 0.32 ± 0.04 µg g-1 (Al), showing that there was no significant contamination.
Extraction procedure for determination of partial metal concentrations
Partial metal extractions were performed using EPA method 200.8. Around 1 g of dry sediment was transferred to a PTFE reactor and treated with an acidic solution containing dilute HNO3 and HCl. The mixture was heated on the digester block for 30 min at 95º C, and the extract obtained was then filtered prior to determination of the metal concentrations using FAAS.9 The lake sediment SRM was analyzed together with the samples in order to ensure the quality of the partial metal extraction. The agreement between measured and certified values varied between 89 ± 8 (Zn) and 99 ± 3% (Pb). The LOD values varied between 0.03 (Cr and Mn) and 0.30 µg g-1 (Al).
Organic carbon determination
The total carbon contents of the samples were determined by combustion at 900 oC, using an elemental analyzer. The organic carbon content was then calculated from the difference between the values obtained before and
after sample calcination at 550 oC for 1 h.22 Quality control of the carbon analyses was achieved by analyzing the lake sediment SRM alongside the samples, and 96.3 ± 4.2% agreement between measured and certified values was achieved (using 3 replicates).
Statistical analysis of the data
Analysis of variance (one-way ANOVA) was applied to the data using Tukey’s multiple comparison test (p < 0.05). Correlation calculations and PCA were performed using Statistica software for Windows version 6.0 (StatSoft Inc., USA). In all the tests, the critical value of α corresponded to a confidence level of 95%.
Results and Discussion
Chemical characteristics of the sediments
The concentrations of the trace metals and organic carbon in the sediments are provided in Table 1. PCA was applied to these data in order to identify trends in the vertical distributions of the different variables in the two sediment cores, as well as groupings between the variables and/or the sections. The PCA technique has previously been successfully applied to aquatic sediment data for this purpose.4,9,22-25
The data matrix was composed of 18 measurements (lines) and 10 variables (columns). The measurements were the concentrations of the different parameters in each section of the two sediment cores (9 sections for each core), and the variables were the measured parameters (Cu, Cr, Co, Mn, Ni, Pb, Zn, Al, Fe and total organic carbon (Corg) content). In order to ensure that the relative influences of the different variables in the model were independent of the units used, the columns of the data matrix were auto-scaled, so that the new variable had a mean of zero and a variance of 1. Only values with weightings above 0.60 and with a confidence level of 95% were considered to be significant.
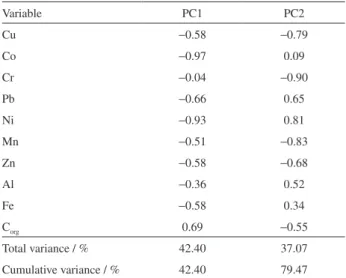
Two principal components were extracted, representing together 79.47% (PC1 42.40%; PC2 37.07%) of the information contained in the initial variables. Based on the weighting of the contribution of each variable (Table 2), it can be seen that Co, Pb and Ni (negative weightings) and Corg (positive weighting) were strongly associated with the first component (PC1), and that Cr, Cu, Mn and Zn (negative weightings) and Ni and Pb (positive weightings) were associated with the second component (PC2).
using only two variables enabled clearer visualization of the groupings. PCA separated the cores into two groups. In PC1, cores I and II were located in the positive and negative regions, respectively, demonstrating that the two cores were statistically different. The main distinguishing features
were the lower concentrations of Co, Pb and Ni, and higher concentration of Corg, in core I compared to core II (Table 2). PC2 separated the upper sediment sections (in the negative region of PC2) from the lower sections (positive region of PC2). This separation was due to greater concentrations of Cu, Cr, Mn and Zn in the upper sections (0-20 cm), and
Table 1. Total metal concentrations and organic carbon (Corg) contents in the sediment cores from the Macela Reservoir (n = 3, mean ± standard deviation)
Section Depth / cm Cu / (µg g-1) Co / (µg g-1) Cr / (µg g-1) Pb / (µg g-1) Ni / (µg g-1) Mn / (µg g-1) Zn / (µg g-1) Al / % Fe / % C org / %
Core I
1A 00-05 41.9 ± 0.4 22.5 ± 0.1 286.9 ± 0.6 37.4 ± 0.3 145.9 ± 0.1 659.9 ± 3.0 83.9 ± 0.2 2.9±0.1 2.8 ± 0.1 14.2 ± 0.2 1B 05-10 42.5 ± 0.1 24.0 ± 0.1 289.6 ± 0.6 38.1 ± 0.2 153.9 ± 0.8 684.1 ± 7.9 85.9 ± 0.5 2.7 ± 0.1 2.6 ± 0.1 15.3 ± 0.2 1C 10-15 43.7±0.2 23.2 ± 0.1 298.6 ± 2.5 38.5±0.1 157.7 ± 0.4 660.0 ± 3.0 78.1 ± 0.3 3.1 ± 0.0 2.4 ± 0.2 10.8 ± 0.2 1D 15-20 41.1 ± 0.3 23.3 ± 0.1 274.2 ± 0.5 39.7 ± 0.2 151.6 ± 0.6 651.7±3.6 76.3 ± 0.4 3.6 ± 0.1 2.8 ± 0.0 12.3 ± 0.2 1E 20-25 38.1 ± 0.2 25.4 ± 0.1 273.2 ± 0.4 40.2 ± 0.4 156.9 ± 0.4 641.6 ± 13 74.3 ± 0.4 2.9 ± 0.2 2.4 ± 0.0 6.3 ± 0.1 1F 25-30 38.0 ± 0.6 26.2 ± 0.4 269.8 ± 0.4 40.9 ± 0.1 160.7 ± 0.4 633.5 ± 11 71.1 ± 0.2 3.9 ± 0.1 2.7 ± 0.1 6.4 ± 0.1 1G 30-35 36.1 ± 0.1 27.3 ± 0.3 262.4 ± 1.3 41.2 ± 0.1 161.2 ± 1.3 627.9 ± 4.9 69.4 ± 0.2 3.8 ± 0.1 2.8 ± 0.1 6.0 ± 0.1 1H 35-40 37.9 ± 0.1 25.8 ± 0.1 259.7 ± 0.5 42.3 ± 0.1 163.3 ± 3.9 627.7 ± 3.3 68.2 ± 0.3 4.1 ± 0.1 3.0 ± 0.2 7.1 ± 0.1 1I 40-45 37.7 ± 0.4 26.4 ± 0.2 257.2 ± 0.6 44.1 ± 0.4 175.0 ± 0.1 614.2 ± 5.6 67.5 ± 0.1 4.2 ± 0.1 2.9 ± 0.1 6.1 ± 0.1 Mean ± standard deviation 39.7 ± 2.7 24.9 ± 1.7 274.6 ± 14.4 49.3 ± 2.1 158.5 ± 8.2 644.5 ± 21.5 74.9 ± 6.7 3.5 ± 0.6 2.7 ± 0.2 9.4 ± 3.8 Core II
2A 00-05 52.5 ± 0.1 29.0 ± 0.2 301.7 ± 1.3 40.1 ± 0.4 172.2 ± 0.4 676.5 ± 0.8 97.1 ± 0.4 3.0 ± 0.1 2.9 ± 0.1 7.2 ± 0.1 2B 05-10 53.1 ± 0.3 31.0 ± 0.2 326.9 ± 3.5 40.6 ± 0.4 181.2 ± 1.6 701.0 ± 1.4 100.8 ± 0.8 2.7 ± 0.1 2.7 ± 0.1 7.2 ± 0.1 2C 10-15 53.2 ± 0.1 32.0 ± 0.0 289.3 ± 0.6 40.7 ± 0.1 190.5 ± 1.3 694.3 ± 6.8 108.4 ± 0.3 2.9 ± 0.1 2.4 ± 0.1 7.5 ± 0.1 2D 15-20 52.2 ± 0.2 33.3 ± 0.1 288.4 ± 1.4 41.3 ± 0.5 195.8 ± 0.4 689.9 ± 6.0 93.8 ± 0.4 3.2 ± 0.1 2.3 ± 0.1 6.7 ± 0.1 2E 20-25 49.5 ± 0.6 33.2 ± 0.6 270.4 ± 0.8 42.1 ± 0.2 186.7 ± 1.2 685.5 ± 2.8 89.4 ± 0.4 2.9 ± 0.1 2.9 ± 0.1 4.8 ± 0.1 2F 25-30 45.0 ± 0.2 32.7 ± 0.0 267.9 ± 3.6 45.0 ± 0.1 208.3 ± 2.7 677.8 ± 3.2 88.8 ± 0.3 3.4 ± 0.2 2.6 ± 0.0 4.8 ± 0.1 2G 30-35 43.0 ± 0.3 33.8 ± 0.3 262.8 ± 3.0 46.7 ± 0.4 219.8 ± 0.4 670.0 ± 4.5 88.0 ± 0.1 3.8 ± 0.1 2.9 ± 0.1 4.6 ± 0.1 2H 35-40 40.3 ± 0.2 35.0 ± 0.4 260.5 ± 1.3 48.0 ± 0.1 207.9 ± 2.8 651.9 ± 3.0 85.8 ± 0.1 4.0 ± 0.1 2.7 ± 0.1 4.7 ± 0.1 2I 40-45 39.9 ± 0.3 34.9 ± 0.0 258.0 ± 0.3 49.2 ± 1.1 224.2 ± 1.2 637.7 ± 2.8 84.9 ± 0.0 3.9 ± 0.1 3.0 ± 0.1 3.8 ± 0.1 Mean ± standard deviation 47.6 ± 5.6 32.8 ± 1.9 280.7 ± 22.9 43.8 ± 3.5 198.5 ± 17.7 676.1 ± 20.4 93.0 ± 7.8 3.3 ± 0.4 2.7 ± 0.2 5.7 ± 1.4
Table 2. Principal component loadings obtained for the metals and total organic carbon (Corg) content
Variable PC1 PC2
Cu −0.58 −0.79
Co −0.97 0.09
Cr −0.04 −0.90
Pb −0.66 0.65
Ni −0.93 0.81
Mn −0.51 −0.83
Zn −0.58 −0.68
Al −0.36 0.52
Fe −0.58 0.34
Corg 0.69 −0.55
Total variance / % 42.40 37.07
Cumulative variance / % 42.40 79.47
greater concentrations of Pb and Ni in the lower sections (25-45 cm).
It can therefore be concluded from the PCA results that the distributions of the trace metals differed between sediment sections. Higher concentrations of Cu, Cr, Mn and Zn were found in the upper sections, while concentrations of Co, Pb and Ni were higher in the lower sections. The metals Al and Fe were present at elevated concentrations that varied little with depth, as expected for elements that are major components of sediments.
Profiles of the distributions of metals in the sediment cores
Copper, chromium, manganese and zinc
Figure 2 illustrates the distribution profiles of Cu (a), Cr (b), Mn (c) and Zn (d) in the cores. The ranges of concentrations found were (in µg g-1) 36.1-53.2 (Cu), 257.2-326.9 (Cr), 614.2-701.0 (Mn) and 67.5-108.4 (Zn). The profiles were similar, with concentrations increasing from the bottom to the top of the cores. The highest concentrations were obtained in the region 0-20 cm, with a maximum at around 10-15 cm. This trend was confirmed using one-way ANOVA (p < 0.05), which showed that there was a significant variation of metal concentration according to the depth. The similarities between the profiles, together with the occurrence of the maximum concentrations at the same depth, suggested that the metals were co-deposited simultaneously. Similar enrichments of these metals in the upper sediment layers have been reported previously.23,26-30
The highest metal concentrations were measured in core II (Figure 2a-2d). This core was collected in a region surrounded mainly by plantations, and was therefore affected by discharges of agricultural effluents, as well as by the effluent from a ceramics factory. Core I was obtained in a region directly affected by discharges of domestic sewage as well as the effluent from a tannery that closed in September 2008, resulting in high inputs of organic matter. These effluents were probably the main sources of Cu, Cr, Mn and Zn in the region studied.
According to Mendil and Uluozlu,31 Cu, Mn and Zn are marker elements for domestic effluents. Ramalho et al.32 reported that the use of agrochemicals in regions of intensive agricultural activity contributes significantly to increased concentrations of metals in soils and sediments, especially in the case of Cu, Mn and Zn, which are present in fertilizers, insecticides, fungicides and herbicides. According to Brito et al.,33 one of the main anthropogenic sources of chromium is the leather industry, which generates solid wastes containing trivalent chromium and high levels of organic matter.
Although the depth of the Macela Reservoir was similar at both sampling sites, and there was no clear evidence of progressive transformation from the lotic (river) environment to the lentic (lake) environment, there was a preferential flow of water towards the dam, resulting in greater metal deposition at the second site (core II). Concentrations of the elements therefore increased in the upstream-to-downstream direction.
From Figure 2b, it can be seen that chromium presented behavior different to that of the other metals of the group, with similar concentrations in the two cores at depths below 25 cm. This was confirmed by ANOVA, which found that there were significant differences between the two cores for Cu, Mn and Zn, but no difference for Cr. The dynamics of the incorporation of chromium into the sediments was therefore different compared to the other elements.
Strong correlations were obtained between the metals Cu, Cr, Mnn and Zn, as well as Corg (r > 0.76 and r > 0.78 for cores I and II, respectively), indicating that Corg was the main carrier of the metals in the sediment. The strong correlations indicate that transport of these metals derived from effluents discharged into the reservoir contributed to enrichment of the elements in the sediments. Similar findings were reported by Loska and Wiechuła34 for sediments of the Rybnik Reservoir (Poland), which received inputs of contaminants associated with domestic and industrial discharges.
Strong correlations were also observed between the pairs Cu-Cr (r = 0.92), Cu-Mn (r = 0.86), Cu-Zn (r = 0.84), Cr-Mn (r = 0.89), Cr-Zn (r = 0.86) and Mn-Zn (r = 0.96) for core I, and between the pairs Cu-Cr (r = 0.81), Cu-Mn (r = 0.91), Cu-Zn (r = 0.84), Cr-Mn (r = 0.66), Cr-Zn (r = 0.73) and Mn-Zn (r = 0.73) for core II. According to Avila-Pérez et al.,35 strong correlations between these metals are indicative of common anthropogenic sources and similar processes of deposition.
Cobalt, lead and nickel
Lower concentrations of Co, Ni and Pb in the upper sections suggest that the metals were of natural origin, with concentrations being diminished by dilution with anthropogenic material that was probably poor in these elements. This type of behavior was also observed by Boyle et al.,36 in sediments from Lake Baikal (Russia).
Strong correlations were obtained between aluminum and the metals Co, Pb and Ni (r > 0.70 and r > 0.88 for cores I and II, respectively), indicating that aluminum acted as an effective carrier, as reported earlier by Roach13 for sediments from Lake Macquarie (Australia).
There were also strong correlations between the pairs Co-Pb (r = 0.82), Co-Ni (r = 0.76) and Ni-Pb (r = 0.89) for core I, and between the pairs Co-Pb (r = 0.81), Co-Ni (r = 0.67) and Ni-Pb (r = 0.92) for core II, indicative of similar origins and the same mechanism of enrichment.37
Aluminum and iron
The distribution profiles of Al and Fe were similar for both sediment cores (Figures 2h-2i), with high concentrations and little variation along the profile. This was confirmed by ANOVA, which found no significant differences in concentrations of the two metals, either between the cores or according to depth. The ranges of concentrations found were (in %) 2.7-4.2 (Al) and 2.3-3.0 (Fe). The high concentrations of Fe and Al reflected the lithogenic composition of the hydrographic basin, with the formation of terrigenous sediments rich in aluminosilicates and iron oxyhydroxides.38
Possible toxicity of the metals in the sediments
Assessment of sediment quality is an important tool for monitoring the quality of aquatic ecosystems.10 Nonetheless, regulation of Brazilian hydric resources has not considered the use of sediment analysis for monitoring aquatic environments. At present, legislation only contemplates the minimum procedures required for dredging, in an attempt to manage this activity in waters under Brazilian jurisdiction.39 Meanwhile, there have been many studies that have evaluated the quality of sediments using the SQG indices.4,9,17,20,40-43
Hence, in the absence of any reference values laid out in Brazilian legislation, or the existence of any relevant ecotoxicological studies, the SQG indices developed for Canadian freshwater ecosystems were used to evaluate the metals in the sediments from the Macela Reservoir, and provide evidence of any possible effects that might be damaging to aquatic organisms.
The Canadian SQG references are based on a chemical and biological database elaborated in North
America, under the responsibility of the Canadian Council of Ministers of the Environment (CCME) in order to derive a protocol designed to protect aquatic life. This protocol provides criteria to evaluate the quality of sediments in terms of the toxicological effects of different substances on aquatic organisms.44 The criteria employ concentrations that represent a lower threshold effect level (TEL), below which adverse effects are rarely expected in aquatic biota following exposure, and a probable effect level (PEL) above which adverse effects are expected to be frequent. Between TEL and PEL, there is a transition zone in which biological toxicity effects are uncertain.11
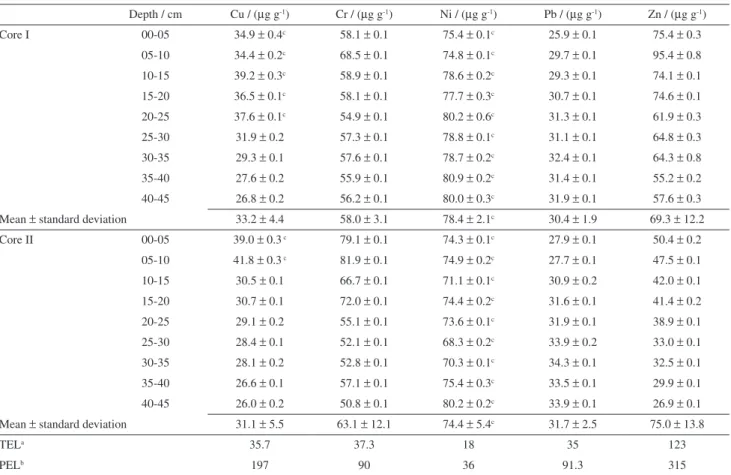
Table 3 presents the partial concentrations of the metals Cr, Cu, Ni, Pb and Zn measured in the sediments, together with the TEL-PEL values listed in the Canadian SQG.11 Since the extraction was performed using a mixture of dilute nitric and hydrochloric acids, the results are compatible with the Canadian SQG, enabling use of the latter to interpret the data.
The concentrations of Cr measured in the sediment cores were higher than TEL and lower than PEL, and were therefore in the transition zone where toxicity effects on biota cannot be reliably predicted. The concentration of Cu was higher than TEL and lower than PEL for the sections in the regions 10-25 cm (core I) and 0-10 cm (core II), so that according to the classification proposed in the SQG reference, it was not possible to predict any effects on the biota of the reservoir. Concentrations of Ni in the sediment cores exceeded the PEL values, and were therefore above the threshold at which adverse effects on biota are probable. Zn and Pb concentrations were below TEL in both cores, indicating that toxic effects on organisms in the reservoir were unlikely to occur.
Work by Zhigang et al.12 at Lake Dongting (China) revealed concentrations of Cr, Cu, Pb and Zn that exceeded TEL but were lower than PEL, indicating that evaluation of the toxicity of these elements was uncertain. It was also found that the concentration of Ni exceeded PEL, indicating that frequent adverse effects could be expected in the biota of Lake Dongting. In work on the Rio Grande Reservoir (Brazil), concentrations of Cr, Cu, Ni, Pb and Zn were found to exceed PEL,45 suggesting not only that the environment was contaminated by these metals, but also that impacts on the biota might be expected.
the results obtained here should be validated using toxicity tests.
Conclusions
The distributions and geochemical associations of Al, Cu, Co, Cr, Fe, Mn, Ni, Pb and Zn were investigated using two sediment cores from the Macela Reservoir in Northeast Brazil. Application of PCA clearly distinguished between the two cores and their sections. The main differences between the cores were the higher content of organic carbon and lower contents of Cu, Co, Ni and Zn in core I. Different mechanisms of deposition of the metals into the sediments separated the upper core sections from the deeper layers.
Higher concentrations of Cu, Cr, Zn and Mn were measured in the upper core sections, while concentrations of Co, Ni and Pb were higher in the lower sections. Fe and Al showed uniform distributions. Higher concentrations of the metals analyzed were generally found in core II, which could be explained by the preferential water flow towards the dam.
Significant correlations between Corg and the metals
Cu, Cr, Mn and Zn indicated that organic matter acted as an effective carrier of these elements to the aquatic environment. Co, Ni and Pb showed strong correlations with Al, suggesting that aluminum was one of the main factors controlling levels of the metals in the reservoir sediment. The results indicated that Co, Ni and Pb were mainly derived from natural sources, while Cu, Cr, Mn and Zn mainly originated from anthropogenic discharges.
Evaluation of toxicity, based on the SQG reference values, showed that concentrations of Cu, Pb and Zn in the sediment cores were close to TEL, at which toxic effects should rarely occur to organisms in the reservoir. The concentrations of Cr were higher than TEL and lower than PEL, so that toxic effects of the metal could not be predicted. The concentration of Ni exceeded PEL, indicating that adverse effects could be expected in the aquatic biota of the Macela Reservoir.
Supplementary Information
Supplementary data are available free of charge at http://jbcs.sbq.org.br as PDF file.
Table 3. Partial metal concentrations in the sediment cores from the Macela Reservoir (n = 3, mean ± standard deviation) and Canadian sediment quality guideline values11
Depth / cm Cu / (µg g-1) Cr / (µg g-1) Ni / (µg g-1) Pb / (µg g-1) Zn / (µg g-1)
Core I 00-05 34.9 ± 0.4c 58.1 ± 0.1 75.4 ± 0.1c 25.9 ± 0.1 75.4 ± 0.3
05-10 34.4 ± 0.2c 68.5 ± 0.1 74.8 ± 0.1c 29.7 ± 0.1 95.4 ± 0.8
10-15 39.2 ± 0.3c 58.9 ± 0.1 78.6 ± 0.2c 29.3 ± 0.1 74.1 ± 0.1
15-20 36.5 ± 0.1c 58.1 ± 0.1 77.7 ± 0.3c 30.7 ± 0.1 74.6 ± 0.1
20-25 37.6 ± 0.1c 54.9 ± 0.1 80.2 ± 0.6c 31.3 ± 0.1 61.9 ± 0.3
25-30 31.9 ± 0.2 57.3 ± 0.1 78.8 ± 0.1c 31.1 ± 0.1 64.8 ± 0.3
30-35 29.3 ± 0.1 57.6 ± 0.1 78.7 ± 0.2c 32.4 ± 0.1 64.3 ± 0.8
35-40 27.6 ± 0.2 55.9 ± 0.1 80.9 ± 0.2c 31.4 ± 0.1 55.2 ± 0.2
40-45 26.8 ± 0.2 56.2 ± 0.1 80.0 ± 0.3c 31.9 ± 0.1 57.6 ± 0.3
Mean ± standard deviation 33.2 ± 4.4 58.0 ± 3.1 78.4 ± 2.1c 30.4 ± 1.9 69.3 ± 12.2
Core II 00-05 39.0 ± 0.3 c 79.1 ± 0.1 74.3 ± 0.1c 27.9 ± 0.1 50.4 ± 0.2
05-10 41.8 ± 0.3 c 81.9 ± 0.1 74.9 ± 0.2c 27.7 ± 0.1 47.5 ± 0.1
10-15 30.5 ± 0.1 66.7 ± 0.1 71.1 ± 0.1c 30.9 ± 0.2 42.0 ± 0.1
15-20 30.7 ± 0.1 72.0 ± 0.1 74.4 ± 0.2c 31.6 ± 0.1 41.4 ± 0.2
20-25 29.1 ± 0.2 55.1 ± 0.1 73.6 ± 0.1c 31.9 ± 0.1 38.9 ± 0.1
25-30 28.4 ± 0.1 52.1 ± 0.1 68.3 ± 0.2c 33.9 ± 0.2 33.0 ± 0.1
30-35 28.1 ± 0.2 52.8 ± 0.1 70.3 ± 0.1c 34.3 ± 0.1 32.5 ± 0.1
35-40 26.6 ± 0.1 57.1 ± 0.1 75.4 ± 0.3c 33.5 ± 0.1 29.9 ± 0.1
40-45 26.0 ± 0.2 50.8 ± 0.1 80.2 ± 0.2c 33.9 ± 0.1 26.9 ± 0.1
Mean ± standard deviation 31.1 ± 5.5 63.1 ± 12.1 74.4 ± 5.4c 31.7 ± 2.5 75.0 ± 13.8
TELa 35.7 37.3 18 35 123
PELb 197 90 36 91.3 315
Acknowledgments
The authors are grateful to Conselho Nacional de Desenvolvimento Científico e Tecnológico (CNPq) for provision of a scholarship. We also thank Instituto Tecnológico e de Pesquisa do Estado de Sergipe (ITPS) and Laboratório de Química Analítica Ambiental (LQA) of Universidade Federal de Sergipe for provision of technical support during this work.
References
1. Esteves, F. A.; Fundamentos de Limnologia, 2a ed.; Interciência: Rio de Janeiro, Brasil, 1998.
2. Acevedo-Figueroa, D.; Jiménez, B. D.; Rodríguez-Sierra, C. J.;
Environ. Pollut. 2006, 141, 336.
3. Arain, M. B.; Kazi, T. G.; Jamali, M. K.; Afridi, H. I.; Jalbani, N.; Sarfraz, R. A.; Baig, J. A.; Kandhro, G. A.; Memon, M. A.;
J. Hazard. Mater. 2008, 160, 235.
4. Silva, A. F.; Lima, G. R. S.; Alves, J. C.; Santos, S. H.; Garcia, C. A. B.; Alves, J. P. H.; Araujo, R. G. O.; Passos, E. A.; J. Braz.
Chem. Soc. 2012, 23, 1669.
5. Rauret, M. S.; Talanta1998, 46, 449. 6. Tuzen, M.; Microchem. J.2003, 74, 105.
7. Passos, E. A.; Alves, J. P. H.; Garcia, C. A. B.; Costa, A. C. S.;
J. Braz. Chem. Soc. 2011, 22, 828.
8. Reinfeld, J. R.; Fisher, N. S.; Luoma, S. N.; Nichols, J. W.; Wong, W. X.; Sci. Total Environ.1998, 219, 117.
9. Garcia, C. A. B.; Barreto, M. S.; Passos, E. A.; Alves, J. P. H.;
J. Braz. Chem. Soc. 2009, 20, 1334.
10. Chapman, P. M.; Wang, F.; Adama, W.; Green, A.; Environ. Sci. Technol. 1999, 33, 3937.
11. MacDonald, D. D.; Ingersoll, C. G.; Berger, T. A.; Arch. Environ.
Contam. Toxicol. 2000, 39, 20.
12. Zhigang, Y.; Zhengyu, B.; Pu, G.; J. China Univ. Geosci.2006,
17, 310.
13. Roach, A. C.; Mar. Environ. Res.2005, 59, 453.
14. Liu, H.; Li, L.; Yin, C.; Shan, B.; J. Environ. Sci. 2008, 20, 390. 15. Mil-Homens, M.; Stevens, R. L.; Abrantes, F.; Cato, I.; Cont.
Shelf Res.2006, 26, 1184.
16. Chen, C. C.; Gong, G. C.; Shiah, F. K.; Mar. Environ. Res.2007,
64, 2007.
17. Garcia, C. A. B.; Passos, E. A.; Alves, J. P. H.; Environ. Monit. Assess. 2011, 181, 385.
18. Audry, S.; Schafer, J.; Blanc, G.; Jouanneau, J. M.; Environ. Pollut.2004, 132, 413.
19. Baldwin, D. S.; Howitt, J. A.; Lakes Reserv. Res. Manage.2007,
12, 167.
20. Gomes, M. V. T.; Costa, A. S.; Garcia, C. A. B.; Passos, E. A.; Alves, J. P. H.; Quim. Nova 2010, 33, 2088.
21. Bomfim, L. F. C.; da Costa, I. V. G.; Benvenuti, S. M. P.; Projeto
Cadastro da Infra-Estrutura Hídrica do Nordeste: Estado de
Sergipe. Diagnóstico do Município de Itabaiana; Ministério
de Minas e Energia: Segipe, Brasil, 2002, http://www.cprm. gov.br/arquivos/pdf/dehid/Sergipe/Itabaiana.pdf accessed in September, 2012.
22. Alves, J. P. H.; Passos, E. A.; Garcia, C. A. B.; J. Braz. Chem. Soc.2007, 18, 748.
23. Wallstedt, T.; Barg, H.; Meili, M.; Morth, C.-M.; Sci. Total
Environ.2008, 407, 405.
24. Van Griethuysen, C.; Luitwiele, M.; Jan, J.; Koelmans, A. A.;
Environ. Pollut. 2005, 137, 281.
25. Passos, E. A.; Alves, J. C.; Santos, I. S.; Alves, J. P. H.; Garcia, C. A. B., Costa, A.C.S.; Microchem. J. 2010, 96, 50.
26. Monterroso, P.; Pato, P.; Pereira, E.; Vale, C.; Duarte, A. C.;
Mar. Pollut. Bull. 2003, 46, 1200.
27. Belzile, N.; Yu-Wei, C.; Gunn, J. M.; Dixit, S. S.; Environ. Pollut. 2004, 130, 239.
28. Yang, H.; Rose, N. L.; Battarbee, R. W.; Sci. Total Environ.
2002, 285, 197.
29. Chi, K. H.; Luo, S.; Hsu, S. C.; Kao, S. J.; Tsai, Y. J.; Chang. M. B.; Chemosphere2009, 76, 286.
30. Friese, K.; Schmidt, G.; De Len, J. C.; Naline Jr., H. A.; Zachmann, D. W.; Limnologica 2010, 40, 114.
31. Mendil, D.; Uluözlü, O. D.; Food Chem.2007, 101, 739. 32. Ramalho, J. F. G. P.; Sobrinho, N. M. B. A.; Velloso, A. C. X.;
Pesq. Agropec. Bras.2000, 35, 1289.
33. Brito, A. L. F.; Muniz, A. C. S.; Lopes, W. S.; Leite, V. D.; Prasad, S.; Eng. Sanit. Ambient. 2002, 7, 144.
34. Loska, K.; Wiechuła, D.; Chemosphere2003, 51, 723. 35. Avila-Pérez, P.; Balcazer, M.; Zarazua-Ortega, G.;
Barcelo-Quintal, I.; Diaz-Delgado, C.; Sci. Total Environ. 1999, 234, 185.
36. Boyle, J. F.; Mackay, A. W.; Rose, N. L.; Flower, R. J.; Appleby, P. G.; J. Paleolimnol. 1998,20, 135.
37. Bibi, M. H.; Ahmed, F.; Shiga, H.; Environ. Geol.2007, 52, 625.
38. Förstner, U., Wittmann, G. T. W.; Metal Pollution in the Aquatic
Environment, 2nd ed.; Springer: Berlin, Germany, 1983.
39. Conselho Nacional do Meio Ambiente (CONAMA); Estabelece as Diretrizes Gerais e os Procedimentos Mínimos para a Avaliação do Material a ser Dragado em Águas Jurisdicionais
Brasileiras, e Dá outras Providências, Resolução No. 344 from
March 25, 2004, Brasil, http://www.cprh.pe.gov.br/downloads/ reso344.doc accessed in September 2012.
40. Abessa, D. M. S; Carr, R. S.; Rachid, B. R. F.; Sousa, E. C. P. M.; Hortellani, M. A.; Sarkis, J. E. S.; Mar. Pollut. Bull. 2005,
50, 875.
41. Hortellani, M. A.; Sarkis, J. E. S.; Abessa, D. M. S.; Souza, E. C. P. M.; Quim. Nova 2008, 31, 10.
43. Canutto, F. A. B.; Garcia, C. A. B.; Alves, J. P. H.; Passos, E. A.;
Environ. Monit. Assess., in press, DOI
10.1007/s10661-012-3015-0.
44. Canadian Council of Ministers of the Environment (CCME);
Protocol for the Derivation of Canadian Sediment Quality
Guidelines for the Protection of Aquatic Life; Task Group on
Water Quality Guidelines, Ottawa, Canada, 1995, http://www. ccme.ca/assets/pdf/pn_1176_e.pdf accessed in September 2012. 45. Mariani, C. F.; Pompeo, M. L. M.; J. Soil. Sediment.2008, 8,
284.