Abstract—This paper applies data envelopment (DEA)
window analysis to assess the efficiencies of two packaging lines; Allfill (new) and DP6, in the Penicillin plant in a Jordanian Medical Company in 2010. The CCR and BCC models are used to estimate the technical efficiency, pure technical efficiency, and scale efficiency. Further, the Malmquist productivity index is computed to measure then employed to assess productivity growth relative to a reference technology. Two primary issues are addressed in computation of Malmquist indices of productivity growth. The first issue is the measurement of productivity change over the period, while the second is to decompose changes in productivity into what are generally referred to as a ‘catching-up’ effect (efficiency change) and a ‘frontier shift’ effect (technological change). Results showed that DP6 line outperforms the Allfill in technical and pure technical efficiency. However, the Allfill line outperforms DP6 line in scale efficiency. The obtained efficiency values can guide production managers in taking effective decisions related to operation, management, and plant size. Moreover, both machines exhibit a clear fluctuations in technological change, which is the main reason for the positive total factor productivity change. That is, installing a new Allfill production line can be of great benefit to increasing productivity.
Index Terms— Window analysis, Malmquist index, Efficiency.
I. INTRODUCTION
The pharmaceutical industry is an important component of health care systems throughout the world, it is based on the scientific research and development of medicines that prevent or treat diseases and disorders. This industry contributes significantly to the quality and protection of life and helps make the world a better place. Measurement of a production unit-performance is crucial in determining whether it has achieved its objectives or not. Performance measurement is the normal way to deal with internal or external pressures by monitoring and benchmarking a company’s production.
Manuscript received Nov., 2015; revised March., 2015. This work was supported by the University of Jordan, Amman.
A. Al-Refaie is with the Department of Industrial Engineering,
University of Jordan, Amman, 11942, Jordan (e-mail:
Ruba Najdawi and Nour Bata received master degrees in Industrial Engineering, University of Jordan, Amman, Jordan. E-mail:
M. D. AL-Tahat is with the Department of Industrial Engineering, University of Jordan, Amman, 11942, Jordan.
In today’s harsh competition improving production efficiency became vital. Data envelopment analysis (DEA) is a management tool which can be used in order to estimate the efficiency of number of Decision Making units (DMU’s). DEA is non-parametric approach known which can be used to calculate the efficiency measures, and has a wide applicability in various service and industry sectors [1-7]. A Jordanian company which evolved as a multinational pharmaceutical company focused on developing a branded pharmaceutical business across the MENA (Middle East and North Africa) and continued to expand the company’s outreach beyond the MENA region through organic growth and acquisition. The penicillin plant in the company was chosen for this study, this plant has two sections: powder and packaging. There are two packaging lines in the penicillin cell for the suspension: DP6 and Allfill. The objective of this paper is to measure the packaging lines efficiencies over the period from April to October, 2010 and evaluate total factor productivity change for two packaging lines using DEA techniques including window analysis and Malmqusit index.
II. DEAMODELS
(A) CCR Model
The CCR Model [8-9] is based on the assumption of fixed or constant return to scale (CRS), which means that a proportional increase in all inputs results in the same proportional increase in outputs. The dual form the CCR-efficiency is expressed as [10]:
Min
Subject to:1
1...
nj ij io j
x
x
i
m
1
1...
nj kj ko j
y
y
k
s
0 1...
j
j
n
where
represents the technical efficiency score of unitDMUo,
jrepresents the dual variables that identify the benchmarks for inefficient units. If
*equals a value of one, then the examined DMU is considered technically efficient.Window Analysis and Malmquist Index for
Assessing Efficiency in a Pharmaceutical
Industry
(B) BCC model:
The CCR Model concept was modified to the BCC model by Banker-Charnes-Cooper in terms of changing the constant return to scale (CRS) concept to variable return to scale (VRS). The DMU operates under variable returns to scale if it is suspected that an increase in inputs does not result in a proportional change in the outputs. The BCC is represented as follows [11]:
Min
Subject to:1
1...
n
j ij io j
x
x
i
m
11...
nj kj ko j
y
y
k
s
1
1 1...
n j jj
n
0
j
The BCC model divide the technical efficiency (TE) derived from the CCR model into two parts:
1- Pure technical efficiency (PTE), which ignores the impact of scale size by only comparing a DMU to a unit of similar scale and measures how a DMU utilizes there sources under exogenous environment.
2- Scale efficiency (SE), which measures how the scale size affects efficiency and is expressed as: SE=TE/PTE
(C) DEA Window Analysis
When there is a limited number of DMUs DEA window analysis enables the comparison of a DMUs efficiency in a particular period. Also, it is applicable when there is a focus on analyzing the changes in efficiency over time. DEA window analysis generalizes the notion of moving averages to reveal the efficiency trends of DMUs over time [12-13]. Each DMU in a window is considered as a completely different one. Precisely a DMU’s performance in a particular period is contrasted with its performance in other periods in addition to the performance of the other DMUs [14]. Window DEA is a non-parametric panel approach. If N represent the number of DMUs (n = 1,2, 3 …..N) that all use m inputs to produce s outputs and are observed in T (t = 1, 2, 3 …..T) periods [15-16]. Let
t n
DMU
represent an observation n in period t with input vector tn
X
and output vectorY
kw , respectively. Then, 1t n t n mt nx
x
X
and 1t n t n st n y y Y If the window starts at time k (1≤ k ≤T) with width w (1≤w≤T-k), then the matrices of inputs and outputs are denoted respectively as follows:
1 2
1 1 1
1 2
1 2
k k k
N
k k k
N kw
k w k w k w
N
x
x
x
x
x
x
X
x
x
x
and 1 21 1 1
1 2
1 2
k k k
N
k k k
N kw
k w k w k w
N
y
y
y
y
y
y
Y
y
y
y
Substituting inputs and outputs of in the CCR model or the BCC model will produce the results of DEA window analysis.
(D)Malmquist Productivity Index
Malmquist productivity index (MPI) evaluates the total factor productivity change of a DMU between two periods [17-19]. The concept of productivity usually referred to labor productivity, this concept is very much related to TFP, defined as the product of efficiency change (catch-up) and technological change (frontier-shift). If TFP value is greater than one this indicates a positive TFP growth from period (t) to period (t+1), whereas a value less than one indicates a decrease in TFP growth or performance relative to the previous year. The frontier obtained in the current (t) and future (t+1) time periods are labeled accordingly. When inefficiency exists, the relative movement of any given DMU over time will therefore depend on both its position relative to the corresponding frontier (technical efficiency) and the position of the frontier itself (technical change). The input-based Malmquist productivity change index is formulated as:
1/2 1 1 1 1 1 1
1
( , ) ( , )
( , ) ( , )
t t t t t t
t t+1 t+1 t t I I
I t t t t t t
I I
D y x D y x
M (y ,x , y x )
D y x D y x
,
where M is the productivity of the most recent productionpoint ( t +1 t +1
)
y , x using the period t+1 technology) relative to the earlier production point ( t t
)
y ,x using period t technology), D is input distance functions, the subscript I indicates CCR input-orientation. A value greater than unity indicates a positive total factor productivity growth between the two periods.
1/2
1 1 1 1 1
( , ) ( , ) ( , )
1( 1, 1, , )
1 1 1 1
( , ) ( , ) ( , )
t t t t t t t t t D y x D y x D y x t t t t t I I I MI y x y x
t t t t t t t t t D y xI DI y x DI y x
Or
Malmquist Index=TEC TC
and
III. DATA COLLECTION &APPLICATION OF DEA
The Penicillin plant in the Jordanian pharmaceutical company has two packaging lines in the penicillin cell. Data were obtained from the Production Report over a period of seven months (April-2010 to October-2010) for the two packaging lines; Allfill and DP6. Considering data availability the expected number of input bottles and the actual number of man working hours were selected as inputs. Whereas, the actual number of output bottles was assumed as the sole output. To compute efficiency scores, each month was divided into two periods and each period consists of two weeks where (H1) represents the first half of the month and (H2) represents the second half of the month. Follows the illustrations and discussion of each type of efficiency and the results are summarized.
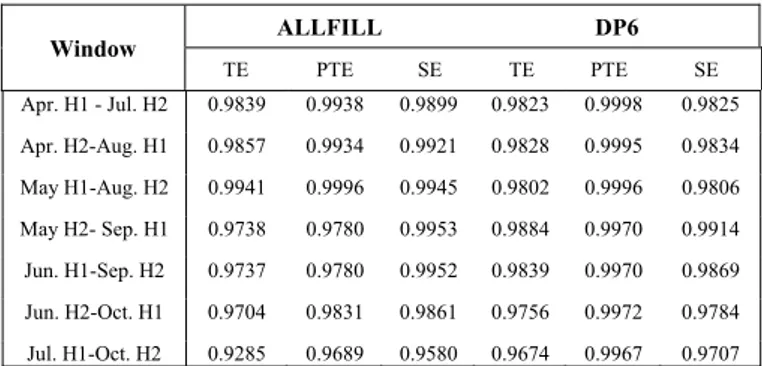
Tables I presents the average values of TE, PTE and SE for Allfill and DP6 over a period of seven months (April-2010 to October-2010). The efficiency for t, t+1, and t-1 for Allfill and DP6 are calculated. Then, MPI is used to measure the productivity change of a DMU over time. MPI equals the multiplication of TEC and TC of the same period. MPI for Allfill and DP6 lines are calculated using the same manner and presented in Table II.
IV. RESULTS AND DISCUSSIONS
A classification of all TE scores in all windows produced three categories, the first category is the highly efficient category (H-efficient), which includes the packaging lines that have a value of efficiency equals to or higher than 98% and being in this category means the best performing and an example of good practice. The second category is the efficient category (Efficient) and includes DMUs that have a value of efficiency between (95% <98%). The third and final category is the inefficient category (Inefficient) and includes DMUs that have a value of efficiency less than 95%.
(a) Window analysis for Allfil and DP6
(i)Allfill Packaging line
In Window DEA the row window is monitored to identify the performance trends. For example in the first row TE average was (=0.9839) with standard deviation equals to (=0.0246), with Max. value equals to (=1.0000) and Min. value equals to (=0.9297). No obvious trend is observed in the efficiencies of the same window. Applying TE efficiency classifications, the first three windows are (H-efficient), the fourth, fifth and sixth windows are (Efficient), the last window is (Inefficient).
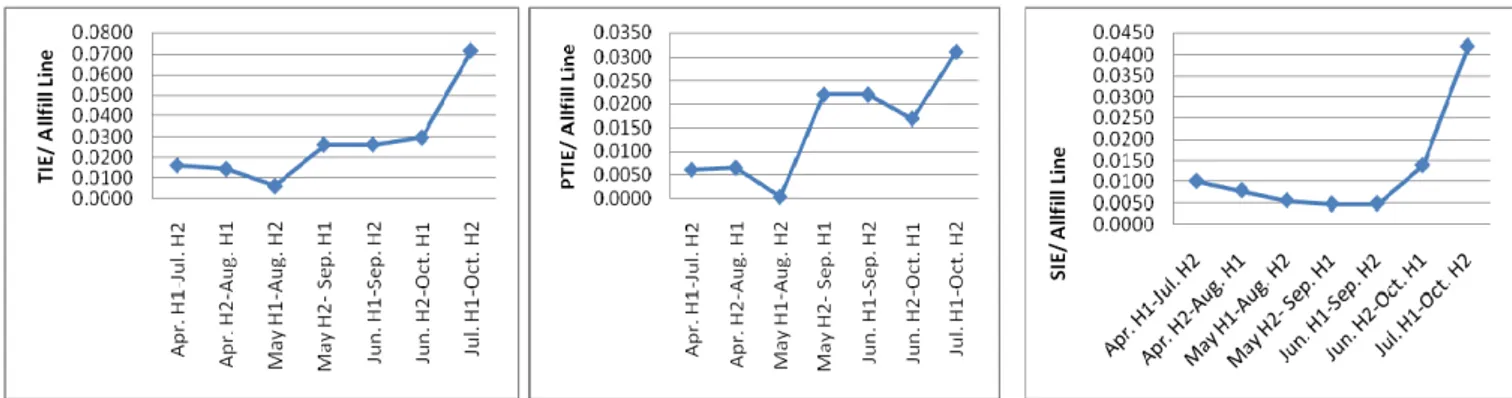
The technical inefficiency (TIE) average values for Allfill line over April-October 2010 are calculated and then displayed in Fig. I, where it is noticed a trend for increasing in TIE average values. This result means that Allfill line did not improve in processing the inputs to achieve the output as supposed when compared to its maximum potential for doing so through the covered period.
The PTE a measure of technical efficiency without scale efficiency through comparing a packaging line only to other lines of similar scale. It purely reflects the managerial performance to organize the inputs in the production process. The last window of TE for Allfill line (Jul. H1-Oct. H2) produced smallest PTE average value (=0.9689), which implies that the same level of output could be produced by 96.89% of the resources if this line was performing on the frontier taking into consideration that the scale size is ignored. Also, it means that 3.11% of overall resources could be saved by raising the performance of this line to the highest level. However, the third window of PTE (May H1- Aug. H2) produced the largest PTE average value (=0.9996). The PTE for Allfill line in Jul. H1 (=1.0000) implies that this line is performing on the frontier taking into consideration that the scale size is ignored, also it is interpreted that there is no resources that could be saved.
Applying classifications on PTE averages, it is found that the first three windows are (H-efficient), the fourth and fifth windows are (Efficient), sixth window is (H-efficient) again and finally the last window is (Efficient). Fig. I also presents the pure technical inefficiency (PTIE) average values for Allfill line over April-October 2010, also and there is trend for increasing in PTIE average values, PTE is used to measure how a firm utilizes its resources under exogenous environments, hence the results reveal that Allfill line is not effectively utilizing its resources over the covered period or in other words the managerial performance in organizing the inputs in the production process hasn’t improved.
The SE measure provides the ability of the management to choose the optimum size of resources in order to choose the scale of production that will attain the expected production level. The largest SE average for Allfill line was (=0.9580), which occurs in last window (Jul. H1-Oct. H2), whereas the smallest SE average was (=0.9953) which corresponds to the fourth window (May H2- Sep. H1). Applying the classification on SE scores means that all windows are (H-efficient) except the last window is (Efficient).
Fig. I presents the scale inefficiency (SIE) average values for Allfill line over April-October 2010, also
1/ 2 1 1
1 1 1 1 Technological Change (TC) =
( , ) ( , )
( , ) ( , )
( ) of the "from" period ( 1) of the "from" period =
( 1) of the "to" period
t t t t t t
I I
t t t t t t
I I
D y x D y x
D y x D y x
Efficiency t
Efficiency t
Efficiency t
Eff
1/ 2
( ) of the "to" period
iciency t
there is trend for increasing in SIE average values, SE provides the ability of management to choose the optimum size of operations, hence the results reveal that the management should reconsider the scale of production that attained the maximum expected production level over the covered period.
(ii) DP6 Packaging line
From the TE average values, the fourth window of TE (May H2- Sep. 1) produced the largest TE average value (=0.9884), TE for this line in May H2 (=0.9946) implies that the same level of output could be produced by 99.46% of the resources if this packaging line was performing on the frontier, it could be interpreted also that only 0.54% of overall resources could be saved by raising the performance of this line to the highest level. Further, the first five windows are considered H-efficient, while the last two windows are (Efficient). Fig. II presents the technical inefficiency (TIE) average values for DP6 line over April-October 2010, and there is trend for increasing in TIE average values, which means that DP6 line did not improve in processing the inputs to achieve the output as supposed when compared to its maximum potential for doing so through the covered period.
The Jul. H1-Oct. H2 window produced the smallest PTE average value (=0.9967), whereas the window Apr. H1- Jul. H2 resulted in the largest PTE average value (=0.9998). In Fig. II, a shift in PTIE average values is noticed.
The largest SE average for DP6 line is 0.9914, which occurs in window May H2-Sep. H1, whereas the smallest SE average was (=0.9707) which corresponds to the last window (Jul. H1-Oct. H2). A trend in scale inefficiency (SIE) values is observed in Fig. II. This implies that the management should reconsider the scale of production that attained the maximum expected production level over the covered period.
(b) MPI analysis for Allfil and DP6
The productivity change is explored by calculating the Malmquist index: technical efficiency change (TEC) and technological change (TC). Table II presents the results of TEC, TC and MPI for the packaging lines Allfill and DP6 during the period from April to October 2010. The minimal value of MPI for Allfill is 0.6444, while the maximal value is 1.4241. Further, it is noted that the Allfill line had the largest geometric average of MPI with a growth of 2.92%. This productivity increase was entirely attributed to technological change growth of 2.92%, since the technical efficiency change held constant with value of (=1.0000). While DP6 line had a geometric average MPI decrease of 0.42% over the same period, this productivity decrease was entirely attributed to technological change regress of 0.42%, while the mean technical efficiency change held constant.
TABLE I. EFFICIENCY AVERAGES FOR BOTH LINES.
Window ALLFILL DP6
TE PTE SE TE PTE SE Apr. H1 - Jul. H2 0.9839 0.9938 0.9899 0.9823 0.9998 0.9825 Apr. H2-Aug. H1 0.9857 0.9934 0.9921 0.9828 0.9995 0.9834 May H1-Aug. H2 0.9941 0.9996 0.9945 0.9802 0.9996 0.9806 May H2- Sep. H1 0.9738 0.9780 0.9953 0.9884 0.9970 0.9914 Jun. H1-Sep. H2 0.9737 0.9780 0.9952 0.9839 0.9970 0.9869 Jun. H2-Oct. H1 0.9704 0.9831 0.9861 0.9756 0.9972 0.9784 Jul. H1-Oct. H2 0.9285 0.9689 0.9580 0.9674 0.9967 0.9707
TABLE II. THE TEC, TC, MPI FOR BOTH LINES.
Period TEC TC ALLFILL MPI TEC TC DP6 MPI
Apr. H1- Apr. H2 1.00 0.8504 0.8504 1.0000 1.1805 1.1805 Apr. H2- May H1 1.00 1.0880 1.0880 1.0000 0.5746 0.5746 May H1- May H2 1.00 1.3330 1.3330 1.0000 1.4196 1.4196 May H2- Jun. H1 1.00 0.6444 0.6444 1.0000 1.2052 1.2052 Jun. H1- Jun. H2 1.00 1.4241 1.4241 1.0000 1.0730 1.0730 Jun. H2- Jul. H1 1.00 1.0897 1.0897 1.0000 0.8925 0.8925 Jul. H1- Jul. H2 1.00 1.0071 1.0071 1.0000 1.1499 1.1499 Jul. H2- Aug. H1 1.00 1.0207 1.0207 1.0000 0.6186 0.6186 Aug.H1- Aug. H2 1.00 0.9797 0.9797 1.0000 1.5101 1.5101 Aug. H2 -Sep. H1 1.00 0.7190 0.7190 1.0000 0.8764 0.8764 Sep. H1- Sep. H2 1.00 1.3002 1.3002 1.0000 0.8026 0.8026 Sep. H2- Oct. H1 1.00 0.9443 0.9443 1.0000 1.0487 1.0487 Oct. H1- Oct. H2 1.00 1.3265 1.3265 1.0000 1.0751 1.0751 Geo. Avg. 1.00 1.0292 1.0292 1.0000 0.9958 0.9958 Min. 1.00 0.6444 0.6444 1.0000 0.5746 0.5746 Max. 1.00 1.4241 1.4241 1.0000 1.5101 1.5101 Std. 0.00 0.2406 0.2406 0.0000 0.2776 0.2776 CV 0.00 0.2337 0.2337 0.0000 0.2788 0.2788
V. CONCLUSIONS
This paper applied DEA window analysis to measure the efficiencies of two packaging lines, Allfill and DP6, the covered period was from April to October 2010. Two inputs were employed (expected number of input bottles and the actual number of man working hours) and a single output (actual number of output bottles). Results showed that the adoption of new packaging line did help the plant to improve their scale efficiencies. Malmquist indices of productivity growth relative to a reference technology for the period April-October 2010 was computed. The MPI results revealed that the main Malmquist TFP is the technological change and the technical efficiency change stayed constant over the covered period, where for both machines there was a clear fluctuations in technological change, the positive total factor productivity change indicates that the new production line Allfill referred with a good benefit to the company. With Malmquist productivity index analysis helps managers to evaluate whether or not there is a progress at different time periods.
REFERENCES
[1] A. Charnes, W. Cooper, A. Lewin, L. Seiford," Data Envelopment Analysis: Theory, Methodology, and Application," Third edition,
Boston: Kluwer Academic publishers, 1994
[3] A. Al-Refaie, " Optimizing performance with multiple responses using cross-evaluation and aggressive formulation in DEA, " IIE Transactions, vol. 44, 2012, pp. 1–15.14
[4] A. Al-Refaie, " Optimizing correlated QCHs using principal components analysis and DEA techniques, " Production Planning & Control, vol. 22(07), 2011, pp. 676-689.10
[5] A. Al-Refaie, " Super-efficiency DEA approach for optimizing multiple quality characteristics in parameter design, " International Journal of Artificial Life Research, vol. 1(2), 2010, pp. 58-71. [6] A. Al-Refaie, A Grey-DEA approach for solving the
multi-response problem in Taguchi Method, " Journal of Engineering Manufacture, vol. 224(1), 2010, pp. 147-158.
[7] A. Al-Refaie, "Optimizing SMT performance using comparisons of Efficiency between different systems technique in DEA," IEEE Transactions on Electronics Packaging Manufacturing, vol. 32(4),
2009, pp. 256-264.
[8] A. Al-Refaie, T.H. Wu, M-H., Li, "DEA approaches for solving the multi-response problem in Taguchi method," Artificial Intelligence for Engineering Design, Analysis and Manufacturing, vol. 23,
2009, pp. 159-173.
[9] C.-J. Chen, H.-L. Wu, B.-W. Lin, " Evaluating the development of high-tech industries: Taiwan’s science park, " Technological Forecasting & Social Change, vol. 73(4), 2006, pp. 452-465.
[10] W. Cooper, L. Seiford, J. Zhu, " Handbook on Data Envelopment Analysis, " Boston: Kluwer Academic publishers, 2004.
[11] F. Diskaya, S. Emir, N. Orhan, " Measuring the Technical Efficiency of Telecommunication Sector within Global Crisis: Comparison of G8 Countries and Turkey, " Procedia Social and Behavioral Sciences, vol. 24, 2011, pp. 206-218.
[12] T. Ertay, D. Ruan, " Data envelopment analysis based decision model for optimal operator allocation in CMS. European Journal of Operational Research, vol. 164 (3), 2005, pp. 800-810.
[13] G. Halkos, N. Tzeremes, N., " Exploring the existence of Kuznets curve in countries’ environmental efficiency using DEA window analysis, " Ecological Economics, vol. 68 (1), 2009, pp. 2168-2176.
[14] A. Hemmasi, M. Talaeipour, H. Khademi-Eslam, R. Farzipoor, S.H. Pourmousa S.H., " Using DEA window analysis for performance evaluation of Iranian wood panels industry, " African Journal of Agricultural Research, vol. 6 (7), 2011, pp. 1802-1806.
[15] M. Pulina, C. Detotto, A. Paba, "An investigation into the relationship between size and efficiency of the Italian hospitality sector: A window DEA approach," European Journal of Operational Research, vol. 204 (3), 2010, pp. 613-620.
[16] H.-H Yang, C.-Y. Chang, " Using DEA window analysis to measure efficiencies of Taiwan’s integrated telecommunication firms," Telecommunications Policy, vol. 33 (1-2), 2009, pp.
98-108.
[17] J. Odeck, " Assessing the relative efficiency and productivity growth of vehicle inspection services: An application of DEA and Malmquist indices, " European Journal of Operational Research,
vol. 126 (3), 2000, pp. 501-514.
[18] A. Worthington, " Malmquist indices of productivity change in Australian financial services, " Journal of International Financial Markets, Institutions and Money, vol. 9 (3), 1999, pp. 303-320.
[19] B. Zhang, J. Bi, Z., Fan, Z., Yuan, J. Ge, " Eco-efficiency analysis of industrial system in china: A data envelopment analysis approach," Ecological Eco;nomics, vol. 68 (1-2), 2008, pp.
306-316.
FIG.I. TIE, PTIE, SIE VALUES FOR ALLFILL LINE