Concatenated Analysis Sheds Light on Early
Metazoan Evolution and Fuels a Modern
‘‘
Urmetazoon
’’
Hypothesis
Bernd Schierwater1,2,3*, Michael Eitel1, Wolfgang Jakob1, Hans-Ju¨rgen Osigus1, Heike Hadrys1, Stephen L. Dellaporta2, Sergios-Orestis Kolokotronis3, Rob DeSalle3
1ITZ, Ecology and Evolution, Tiera¨rztliche Hochschule Hannover, Hannover, Germany,2Department of Molecular, Cellular and Developmental Biology, Yale University, New Haven, Connecticut, United States of America,3Sackler Institute for Comparative Genomics and Division of Invertebrate Zoology, American Museum of Natural History, New York, New York, United States of America
For more than a century, the origin of metazoan animals has been debated. One aspect of this debate has been centered on what the hypothetical ‘‘urmetazoon’’ bauplan might have been. The morphologically most simply organized metazoan animal, the placozoanTrichoplax adhaerens, resembles an intriguing model for one of several
‘‘urmetazoon’’hypotheses: the placula hypothesis. Clear support for a basal position of Placozoa would aid in resolving several key issues of metazoan-specific inventions (including, for example, head–foot axis, symmetry, and coelom) and would determine a root for unraveling their evolution. Unfortunately, the phylogenetic relationships at the base of Metazoa have been controversial because of conflicting phylogenetic scenarios generated while addressing the question. Here, we analyze the sum of morphological evidence, the secondary structure of mitochondrial ribosomal genes, and molecular sequence data from mitochondrial and nuclear genes that amass over 9,400 phylogenetically informative characters from 24 to 73 taxa. Together with mitochondrial DNA genome structure and sequence analyses and Hox-like gene expression patterns, these data (1) provide evidence that Placozoa are basal relative to all other diploblast phyla and (2) spark a modernized‘‘urmetazoon’’hypothesis.
Citation: Schierwater B, Eitel M, Jakob W, Osigus H-J, Hadrys H, et al. (2009) Concatenated analysis sheds light on early metazoan evolution and fuels a modern ‘‘Urmetazoon’’hypothesis. PLoS Biol 7(1): e1000020. doi:10.1371/journal.pbio.1000020
Introduction
Attempts to explain the origin of metazoan life seek to unravel both the transition from (1) single-celled to multi-cellular organisms and (2) diploblastic to triploblastic body plans. The most favored scenarios are based on five well-known hypotheses on the‘‘urmetazoon’’bauplan: Haeckel’s gastraea, Ja¨gersten’s bilaterogastraea, Metschnikoff’s phago-cytella, Lankester’s planula, and Bu¨tschli’s placula [1–5]. Attempts to unravel the urmetazoon bauplan and to provide support for any of the five hypotheses depends on identifying the most basal extant diploblast group. Two phylogenetic alternatives have remained under discussion; one sees the sponges (Porifera) and the other the placozoans (Placozoa) as basal relative to all other diploblast groups [6–10]. The latter view was accepted for the most part of the last century. The presence of only four somatic cell types, the smallest metazoan genome, and the lack of any foot or head structures, any anterior–posterior organization, or any kind of organs, and both a basal lamina and an extracellular matrix (ECM) places Trichoplax in a basal and isolated position relative to all other metazoan phyla [11–16] (cf. [17], however).
Tangled Roots at the Base of the Metazoan Tree of Life
Mainly because of misinterpretation of life cycle stages between Trichoplax adhaerens and the hydrozoan Eleutheria dichotoma, Placozoa lost their predominant role as the key model system for studying the origin of metazoan life [5,17]. This outcome was nourished by molecular studies based on a variety of character sources, which created a series of conflicting phylogenetic scenarios in which most often
Porifera came out basal [18–24]. Figure 1 shows six plausible scenarios for the relationships of five taxonomic groups (Bilateria, Cnidaria, Ctenophora, Porifera, and Placozoa) and two plausible arrangements for four taxa when Placozoa are left out that are critical in assessing the early relationships of metazoans. For five taxa and one outgroup, there are 105 ways to arrange these taxa in dichotomous branching trees. Nearly 95% of these possible trees can be eliminated as not plausible based on existing data. All six of the hypotheses in Figure 1 have been suggested as viable in the literature over the past two decades (see Table S1 for a summary of papers in the last decade addressing the phylogenetics of these taxa).
All six hypotheses have been suggested in publications in the last year alone. For instance, Srivastava et al. (2008) [23] hypothesize Placozoa as the sister group to both Cnidaria and Bilateria, with sponges branching off earlier (arrow b in Figure 1). Another recent study, which suggests a basal position for Ctenophora and Anthozoa (arrow E in Figure 1), unfortunately does not add to the issue, since it does not include Placozoa in the analysis [25]. However, this study does
Academic Editor:David Penny, Massey University, New Zealand
ReceivedMay 9, 2008;AcceptedDecember 8, 2008;PublishedJanuary 27, 2009
Copyright:Ó2009 Schierwater et al. This is an open-access article distributed under the terms of the Creative Commons Attribution License, which permits unrestricted use, distribution, and reproduction in any medium, provided the original author and source are credited.
Abbreviations:ML, Maximum Likelihood
suggest that Cnidaria are not sister to Bilateria, but rather to Porifera [25]. A study that does include Placozoa [26] also suggests that Bilateria and Placozoa are basal metazoans (arrow a in Figure 1). Striking examples of the diversity of hypotheses generated on these taxa are recent analyses of mitochondrial genome sequence data [27–29] that place Bilateria as sister to all non-Bilateria, with Placozoa as the most basal diploblast (arrow e in Figure 1). In the following, we use the term‘‘diploblasts’’for all nonbilaterian metazoans; we do not intend to contribute to the discussion of whether diploblastic animals may have a mesoderm, however [1,30– 33].
Results and Discussion
A Concatenated Dataset for Metazoa
Given that both nonphylogenetic interpretation of mor-phological data as well as molecular analyses of sequence data have failed to resolve the issue, a more comprehensive, systematic analysis of morphological data and new molecular markers are now a requisite for identifying the root of the metazoan tree of life. To approach this goal, we conducted concatenated analyses for 24 metazoan taxa from all of the major organismal lineages in this part of the tree of life that included morphological characters (17 characters), both mitochondrial and nuclear ribosomal gene sequences (five gene partitions for 6,111 nucleotide positions) and molecular morphology [8] (ten characters), as well as nuclear coding genes (16 gene partitions derived from our database searches and another 18 gene partitions derived from the Dunn et al. (2008) study [25]; see Materials and Methods) for 8,307 amino acid positions and protein coding genes (16 gene partitions for 3,004 amino acid characters) to resolve phylogenetic relationships between recent diploblast groups. The total number of characters included was 17,664 from 51 partitions, giving 7,822 phylogenetically informative characters. We also
constructed a matrix with a larger number of taxa based on the Dunn et al. (2008) [25] study with 73 taxa for the same gene partitions (see Materials and Methods and Tables S2 and S4). This matrix had 17,637 total characters and 9,421 phylogenetically informative characters. In addition, Hox gene expression was compared for a placozoan and a cnidarian bauplan to test predictions from the placula hypothesis [5].
Clarity and Confusion at the Root of the Metazoan Tree
Parsimony, likelihood (with morphological characters removed), and mixed Bayesian analysis of the smaller concatenated matrix using a variety of approaches, weighting schemes, and models is generally consistent with the view that Bilateria and diploblasts (Porifera, Ctenophora, Placozoa, and Cnidaria) are sister groups. In addition, Placozoa are robustly observed as the most basal diploblast group (Figure 2 and Figure 3). Figure 3 shows the support for several hypotheses of monophyly obtained from diverse methods of analysis. Porifera, Bilateria, and Fungi all form strong monophyletic groups (Figure 3). The four cnidarian classes (Anthozoa, Hydrozoa, Scyphozoa, and Cubozoa) together with the Ctenophora form a monophyletic group, the‘‘Coelenterata.’’
Within the Cnidaria, the generally accepted basal position of the anthozoans is also recovered by this analysis [34,35]. Both choanoflagellates and Placozoa are strongly excluded from a Porifera–Coelenterata monophyletic group. The basal posi-tion of Placozoa is also strongly supported by comparing the phylogeny in Figure 2 with hypotheses that place it more derived, using the statistical approach of Shimodaira and Hasegawa [36,37]. This battery of tests (Table 1) demonstrates that the basal position of the Placozoa is significantly better than other hypotheses. The 95% confidence tree includes the Maximum Likelihood (ML) and Bayesian trees (both with Placozoa as basal in the diploblasts) with a cumulative expected likelihood weight (ELW) of 0.960763.
The tree topology shown in Figure 2 summarizes the best supported phylogenetic hypothesis obtained by using
Max-Figure 1.Discussed Relationships at the Base of the Metazoan Tree Potential arrangements of five critical taxa (B, Bilateria; Cn, Cnidaria; Ct, Ctenophora; P, Placozoa; and S, Porifera) are shown on the right, and some hypotheses in the literature with only four taxa (Placozoa omitted) on the left. Arrows indicate the root of the networks. The letters at the arrows are for reference to Table S1. The uppercase letters refer to publications in Table S1 that support the indicated root for trees without Placozoa. The lowercase letters refer to publications in Table S1 that support the root for trees with all five taxa.
doi:10.1371/journal.pbio.1000020.g001
Author Summary
Following one of the basic principles in evolutionary biology that complex life forms derive from more primitive ancestors, it has long been believed that the higher animals, the Bilateria, arose from simpler (diploblastic) organisms such as the cnidarians (corals, polyps, and jellyfishes). A large number of studies, using different datasets and different methods, have tried to determine the most ancestral animal group as well as the ancestor of the higher animals.
Here, we use ‘‘total evidence’’ analysis, which incorporates all
imum Parsimony, ML, and Bayesian analyses of the con-catenated dataset. Analysis of the larger matrix (Figure S2) was less well resolved within the Bilateria, but showed the same general topology as the smaller analysis. Specifically, Bilateria are monophyletic and sister to the diploblasts, with the choanoflagellate Monosigabasal to these taxa with high jackknife values and Bayesian posteriors. Diploblasts are also monophyletic, and Placozoa are the most basal taxon in the diploblasts. In addition, within the diploblasts, Porifera and Coelenterata are monophyletic, and within Bilateria, Ecdy-sozoa and Deuterostomia are monophyletic; all groupings with high node support.
The topology within the diploblasts is also robust when Bilateria are removed from the analysis. The full analysis seemingly misplaces the Bilateria clade as the sister to all diploblasts. The classical position of the Bilateria is in a highly derived position from within the diploblasts and usually sister to the Cnidaria. The seemingly‘‘weird’’prediction of a basal Bilateria from the present analysis has been observed before in other studies (see Table S1). Several studies have addressed
phylogenetic problems specific to this region of the tree of life and have suggested that this region of the tree will be inherently difficult to resolve. These studies suggest that the compression of splitting events in this region renders the resolution of these nodes with high support difficult, if not impossible [38–42]. These studies have suggested that even large amounts of data might not resolve the problem. Other studies have pointed to taxon sampling and modeling as a potential problem in resolving this part of the tree of life [25,38–40]. Another problem is that the large number of molecular phylogenetic approaches creates multiple and possibly the most short-lived hypotheses in biology. The large repertoire of algorithms, models, and assumptions sometimes produces a forest of trees from the same dataset (cf. [43]). Thus, tree-building procedures are highly crucial and deserve particular attention if this region of the tree of life is to be resolved [38].
Possible Swamping by Mitochondrial Data?
Our analyses provide strong evidence for a basal position of Placozoa relative to other diploblasts, and thus agrees with
Figure 2.Maximum Likelihood Phylogenetic Tree of Metazoan Relationships Using the Concatenated Data Matrix
Node support is based on the best ML tree filtered through 1,000 rapid bootstrap replicates. Only support values below 100% are shown. Bayesian inference supported strongly (posterior probability¼1.0) all nodes with the exception of monophyly of Cnidaria. The maximum a posteriori and the Bayesian 50% majority-rule consensus trees disagreed with the best ML tree in supporting a Ctenophora–Anthozoa clade with posterior probability of 0.98. Please note that‘‘Coelenterata’’is not a taxonomic unit, but rather it is a traditional grouping for reasons of convenience. The alpha shape parameters of the Gamma distribution were 0.507454 and 0.651659 for the nucleotide and amino acid partitions, respectively. Log-likelihood¼ 261429.821426.
doi:10.1371/journal.pbio.1000020.g002
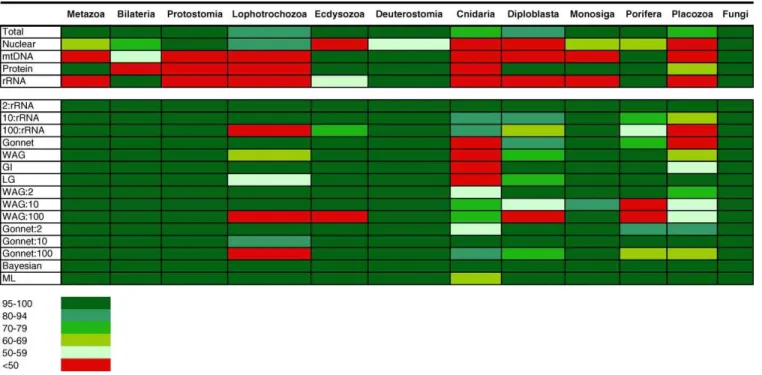
Figure 3.Phylogeny of Animals and Weighting Schemes
The impact of several weighting schemes on the phylogenetic hypothesis in Figure 2. The values in the table are jackknife values for maximum parsimony, rapid bootstrap for ML, and posterior clade probabilities for Bayesian inference. The color coding for the values is shown at the bottom of the table. The major monophyletic groups examined for jackknife support in Figure 2 are indicated in the top row. See Figure 2 for nodes defined by these groups. Monosiga refers to placingMonosigaas basal to Metazoa, and Placozoa refers to placing Placozoa as basal to diploblasts. Total in the first row refers to the entire dataset analyzed with equal weighting of all characters. The next four rows show results for analyses of partitioned datasets: mtDNA, mitochondrial partition; Nuclear, nuclear; Protein, protein; and rRNA, ribosomal RNAs from both nuclear and mitochondrial genomes. The bottom rows show results for various weighting schemes; 2:rRNA, 10:rRNA, and 100:rRNA refer to weighting schemes in which transversions are weighted 2, 10, and 100 times more than transitions, respectively. Protein weighting schemes are Gonnet weighting matrix, Whelan and Goldman (WAG) matrix, Le and Gascuel (LG) matrix, and genetic identity (GI). For details on weighting matrices, see Figure S4.
the mitochondrial genome data analyses (as indicated by arrow f in Figure 1; [27,28]). It is therefore important to examine whether the mitochondrial signal swamps out the nuclear data, to rule out the possibility that the topology we present in Figure 2 is biased by mitochondrial information. Figure S1 addresses this problem and demonstrates that nuclear information contributes positive support to 16 of the 21 nodes in the tree. Mitochondrial information contributes positive support to only 15 out of 21 nodes. In addition, examination of the amount of hidden support contributed by nuclear versus mitochondrial data (not shown) shows that the majority of the hidden support comes from nuclear informa-tion. Both of these results using partitioned support measures indicate that the addition of nuclear data does not conflict with mitochondrial information and is indeed contributing positively to the overall phylogenetic hypotheses
Resurrecting the‘‘Placula’’
Although the hypothesis in Figure 2 is in conflict with a recent analysis of coding genes from whole genomes [23] as well as is in conflict with other studies (Table S1), the scenario presented here is consistent with another set of studies and also with one of the major urmetazoon hypotheses, the placula hypothesis (Figure 4). This hypothesis fuels intriguing scenarios for the mechanisms and direction of anagenetic evolution in Metazoa, and in the form presented here, it can illustrate the derivation of Cnidaria and Bilateria from a placozoan-like ancestor. A basal position of Placozoa relative to Cnidaria, and diploblasts sister to Bilateria arecum grano salis consistent with several recent molecular phylogenetic analyses ([23,27] and this study) encouraging us to reconsider the placula hypothesis in a modern light.
The comparison of Hox/ParaHox-like gene expression patterns in Placozoa and Cnidaria creates a new working hypothesis for the origin of the entoderm, a main body axis, and symmetry. Based on the undisputed evidence that Placozoa are basal relative at least to Cnidaria, the Trox-2 gene is likely ancestral to Hox/ParaHox-like genes from Cnidaria (as formerly suggested [44,45]).Trox-2is expressed at the gastrodermis/epidermis (lower/upper epithelium) boun-dary inTrichoplax[46]. Strikingly, we found similar expression patterns for two putativeTrox-2 descendents in the hydro-zoan Eleutheria dichotoma (Figure 4). These regulatory gene expression data mirror directly the beginning and ending
stage of a modern interpretation of the placula hypothesis. The latter explains the origin of a symmetric bauplan with one or two defined body axes and an internal feeding cavity from a simple placuloid (proto-placozoan–like) bauplan that lacked all of the former characteristics. In the most parsimonious scenario, the expression of a single regulatory gene defines polarity in Placozoa, i.e., the differentiation of a lower versus upper epithelium. According to the proposed
‘‘new placula hypothesis,’’ the nonsymmetric placozoan bauplan transforms into a symmetric Cnidaria (or also Bilateria) bauplan by the former ring of epithelia boundary separation transforming into the new ‘‘oral’’ region of the derived symmetric bauplan (Figure 4). This transformation is simply the result of a placula lifting up its feeding epithelium in order to form an external feeding cavity, keeping function and morphology of the epithelium unchanged. In the final stage, the‘‘oral’’pole develops specialized organs, such as a mouth and tentacles for feeding (cf. [47]). The latter could be driven by duplication of the regulatory gene, which originally defined polarity in the placula (Figure 4; cf. [48] for review). Observations on extant Placozoa and Cnidaria mirror this scenario almost perfectly (Figure 4).
Although prediction and observation match nicely, one has to note, however, that no gene or even gene family, no matter how important, can provide more than just indirect support for a working hypothesis on a hypothetical animal bauplan that can never be observed. It is important to note that multiple topologies can be consistent with the placula hypothesis and that the form of the extant earliest-branching lineage does not necessarily have to represent the form of the ancestor; we consider the latter, however, the more parsimo-nious alternative. We also point out that the regulatory gene family mentioned here, Hox/ParaHox-like genes, seems to be absent in sponges [49]. A secondary loss of Hox/ParaHox-like genes in sponges seems plausible, and the work by Peterson and Sperling, 2007 [50] provides some evidence for this assumption. Whether a possible loss of a Hox/ParaHox gene might be related to the reduction of epithelial organization in Porifera [3] remains an interesting speculation.
The Hox/ParaHox loss scenario in sponges is just one of several crucial questions raised by the phylogeny in Figure 2. According to this phylogeny, diploblasts and Bilateria both may have started from a placula-like bauplan as suggested in Figure 4 (‘‘new placula hypothesis’’). The shown new placula
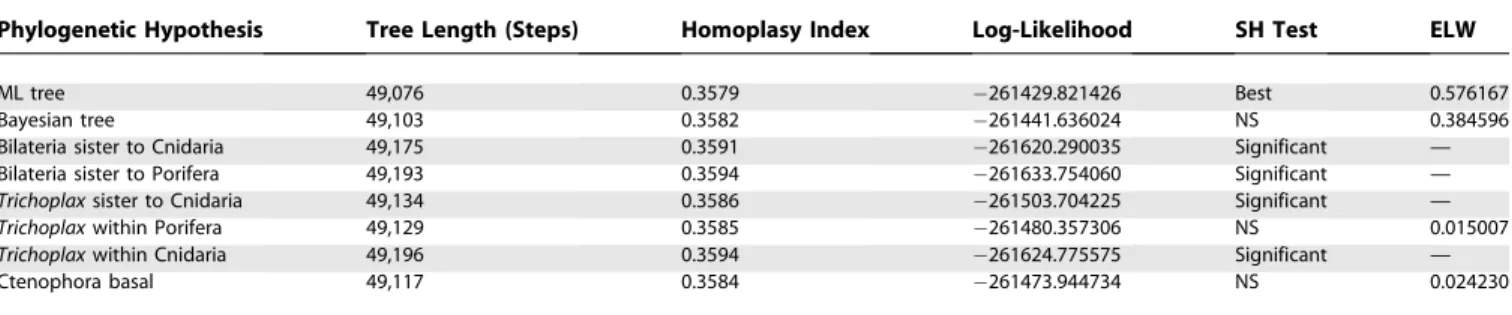
Table 1.Comparison of Competing Phylogenetic Hypotheses
Phylogenetic Hypothesis Tree Length (Steps) Homoplasy Index Log-Likelihood SH Test ELW
ML tree 49,076 0.3579 261429.821426 Best 0.576167
Bayesian tree 49,103 0.3582 261441.636024 NS 0.384596
Bilateria sister to Cnidaria 49,175 0.3591 261620.290035 Significant —
Bilateria sister to Porifera 49,193 0.3594 261633.754060 Significant —
Trichoplaxsister to Cnidaria 49,134 0.3586 261503.704225 Significant —
Trichoplaxwithin Porifera 49,129 0.3585 261480.357306 NS 0.015007
Trichoplaxwithin Cnidaria 49,196 0.3594 261624.775575 Significant —
Ctenophora basal 49,117 0.3584 261473.944734 NS 0.024230
Tree length and homoplasy index are maximum parsimony measures, whereas log-likelihood, Shimodaira-Hasegawa (SH) test, and expected likelihood weights (ELW) are based on a likelihood framework. The 95% confidence tree set includes the ML and Bayesian trees with cumulative ELW of 0.960763 and was assessed with 100 bootstrap replicates.
hypothesis illustrates a potential transition from a non-symmetric, axis-lacking placula into a radial symmetric and head–foot axis organized cnidarian. In a similar way, the placula could also be transformed into a Bilateria bauplan, i.e., a bilaterally symmetric bauplan with an anterior– posterior body axis. One of the easiest models for adopting a bilateral symmetry suggests that the‘‘urbilaterian’’kept the benthic lifestyle of the placula but adopted directional movement. The latter almost automatically leads to an anterior–posterior and ventral–dorsal differentiation. The pole moving forward develops a head and becomes anterior, the body side facing the ground carries the mouth and thus by definition becomes ventral. According to the above scenario, the main body axes of diploblastic animals and Bilateria were independent inventions. Whereas an inde-pendent evolution of body axes in diploblastic animals and Bilateria seems easily plausible, the independent evolution of other characters (e.g., the nervous system; see below) seems
less plausible given our knowledge of the development and morphology of these characters.
We will never observe the hypothetical placula, but we may draw some conclusions from Placozoa, which seem to have retained many of the characteristics of the placula if our interpretation is valid. This scenario draws into question several aspects of animal evolution that will require reinter-pretation if this hypothesis is correct. Most notable of these aspects is the evolution of the nervous system, which in the hypothesis in Figure 2, can only be explained by convergent evolution of Cnidaria and Bilateria nervous system organ-ization. According to the placula hypothesis, we suggest that the placula already had the genetic capability and basic building blocks to build a nervous system, and that from here, the final build-up of the nervous system developed via independent, but parallel, pathways in diploblasts and Bilateria. The genome of the placozoan Trichoplax adhaerens indeed delivers some notable evidence that the genetic
Figure 4.Modern Interpretation and Modification of the Placula Hypothesis of Metazoan Origin
Here, a nonsymmetric and axis-lacking bauplan (placula) transforms into a typical symmetric metazoan bauplan with a defined oral–aboral or anterior– posterior body axis. In the placula transformation, a primitive disk consisting of an upper and a lower epithelium (lower row), which can be derived from a flattened multicellular protist, forms an external feeding cavity between its lower epithelium and the substrate (second row from bottom). The latter is achieved by the placula lifting up the center of its body, as this is naturally seen in feedingTrichoplax(i.e., the twoTrichoplaximages derive from a nonfeeding (first row) and feeding (second row) individual. If this process is continued, the external feeding cavity increases (cross section, third row) while at the same time the outer body shape changes from irregular to more circular (see oral views). Eventually, the process results in a bauplan in which the formerly upper epithelium of the placula remains outside (and forms the ectoderm) and the formerly lower epithelium becomes‘‘inside’’ (and forms the entoderm; upper row). This is the basic bauplan of Cnidaria and Porifera. Three of the four transformation stages have living counterparts in the form of restingTrichoplax, feedingTrichoplax, and cnidarian polyps and medusae (right column).
The above-outlined transformation of a placula into a cnidarian bauplan involves the development of a main body axis and a head region, which allows the invention of new structures and organs for feeding. From a developmental genetics point of view, a single regulatory gene would be required to control separation between the lower and upper epithelium (three lower rows). If the above scenario were correct, the following empirical data would be congruent with it. In the form of the putative ProtoHox/ParaHox gene, Trox-2, in Trichoplax, we find a single regulatory gene, marks the differentiation of an as yet undescribed cell type at the lower–upper epithelium boundary inTrichoplax[46]. More than one regulatory gene would be required to organize new head structures originating from the ectoderm–entoderm boundary of the oral pole (upper row). Quite noteworthy, two putative descendents of theTrox-2gene,Cnox-1andCnox-3, show these hypothesized expression patterns (Diplox expression upper row; for simplicity, only the ring forCnox-1expression is shown; see Figure S4 for expression patterns of both genes and Jakob et al. [46,52] for details.Cnox-1andCnox-3 expression both mark the ectoderm-entoderm boundary at the oral pole in the hydrozoanEleutheria dichotoma. Both genes are expressed in parallel in a ring-shaped manner at the tip of the manubrium, withCnox-3being expressed more ectodermally andCnox-1being expressed more entodermally (unpublished data).
inventory may precede morphological manifestation of organs [23]. For example, the placozoan genome harbors representatives of all major genes that are involved in neurogenesis in higher animals, whereas placozoans show not the slightest morphological hint of nerve or sensory cells. Quite noteworthy, however, is that placozoans are quite capable of stimuli reception and perception used to coordinate behavioral responses. In this light, the generally accepted unlikely convergent evolution of a nervous system only looks unlikely from a morphological, but not from a genetic and physiological, point of view.
Regardless of the need for reinterpretation of this and other anatomical characters, the findings presented here provide a viable hypothesis for the major cladogenetic events during the metazoan radiation. Given the basal position of Placozoa, we suggest that at least for diploblastic metazoan life, the body plan started with the following: an asymmetric body plan, a most simple morphology (only two steps above basic definition [51]), a single ProtoHox gene, a large mitochondrial (mtDNA) genome, an outer feeding epithelium that gave rise to the entoderm, and the smallest of all known (not secondarily reduced) metazoan genomes. If the placula is also the ancestral state for metazoans (i.e., the common ancestor of Bilateria and diploblasts in Figure 2), then the same could be said for the urmetazoon.
Materials and Methods
Cloning and sequencing of target genes.In order to extend the analyses of Rokas et al. [42] to basal metazoans also, we isolated 13 of the suggested target genes that were missing from the placozoan
Trichoplax adhaerens. These genes could be amplified by using the
primer sets that had worked in the previous study in sponges: TOA04, 05, 06, 09, 10, 11, 13, 15, 16, 17, 21, 25, 33, 48, 53, 56, 57, 59, 62, 65, 67, and 68. In order to obtain sequences of these genes for Placozoa and to characterize variation within Placozoa, we also isolated six of these genes from a second, distantly related placozoan species (Placozoa sp. H2, TunB clone, Tunisia). For cubozoans, we filled gaps in the matrix by isolating three target genes fromCarybdea marsupialis (Table S5). We amplified target genes from cDNA. For both placozoan species, some 200 healthy growing vegetative animals of each species were used for the isolation of total RNA. Before extraction, animals were washed three times with sterile 3.5% artificial seawater (ASW) and starved overnight to prevent algae contamination. Animals were lysed in 500ll of fresh homogenization buffer (HOM: 50 mM Tris HCl, 10
mM EDTA, 100 mM NaCl, 2.5 mM DTT, 0.5% SDS, 0.1% DEPC in ultrapure water [Gibco]; pH 8.0). After addition of 25lg of
DEPC-treated Proteinase K, samples were stored for 30 min at 658C. The homogenate was squeezed through a needle connected to a 2.5-ml syringe. This protocol significantly increased RNA yield compared to conventional RNA extraction kits. Nucleic acids were isolated by two rounds of phenol/chloroform/isoamyl alcohol (25:24:1) purification. Nucleic acids were dissolved in ultrapure water, and DNA was digested with DNase I (Fermentas). Total RNA was used for cDNA transcription with poly-T primers following the manufacturer’s protocol (Invitrogen Superscript II Kit).
Target genes were amplified after initial denaturation (3 min at 94
8C) by 40 rounds of 948C for 30 s, 508C for 30 s, and 728C for 75 s, followed by a final elongation step (5 min at 728C) using the Bioline Taq system following the manufacturer’s recommendations (Bioline). Amplified fragments of the predicted size were purified and cloned into pGEM-T (Promega). Sequencing was performed on a Megabase 500 using the DYEnamic ET Terminator Cycle Sequencing Kit (Amersham) or by using the service provided by Macrogen. For further details, see Jakob et al. [46] and Table S5.
For a detailed explanation of the inclusion of sequences in the phylogenetic matrices used in this study, see Table S2, which shows the source of sequences in this study. We constructed two matrices, a small one composed of 24 taxa (see Figure 2) and a large one composed of 73 taxa. For the smaller matrix, we chose nine bilaterian taxa based on the availability of sequence information for a species. We chose three Lophotrochozoa, three Ecdysozoa, and three
Deuterostomia as representatives of the Bilateria. Other ingroup taxa include representatives of the four classes of Cnidaria, the three major groups of Porifera (Desmospongiae, Calcarea, and Hexacti-nellida), Placozoa, and Ctenophora. Since rooting of the tree is critical, we attempted to break up the root by including several outgroup species: two fungal species (SaccharomycesandCryptococcus),
Tetrahymena,Trypanosoma, andDictyosteliumbased on their relevance to
the study and the availability of genome-level information. Trypano-somawas used as outgroup species in all aspects of the study, but the topology of resultant trees indicates that slime mold orTetrahymena
could also be used. To increase the number of placozoan and cubozoan sequences, we PCR amplified several genes as indicated in Table S5. Morphological characters were scored for the taxa in this study as described in Schierwater and DeSalle (2007 [10]; see Table S3). Molecular‘‘morphology’’characters were also included for the taxa in this study as scored by Ender and Schierwater, 2003 [8] (see Figure S3). The final partitioned matrices for the smaller (24 taxa) and the larger (73 taxa) can be found in Table S4. In addition to genes already available from whole mitochondrial sequencing (15 genes) and nuclear genes (16 genes), we included 18 genes from the Dunn et al. (2008) study [25]. These genes were chosen on the basis of taxonomic representation being over 50% in the Dunn et al. (2008) study.
For the larger 73-taxon matrix, we included all of the taxa from the Dunn et al. (2008) study (their smaller matrix in their Figure 2; [25]) plus Cubozoa, Scyphozoa, Placozoa, Hexactinellida, Calcarea,
Caeno-rhabditis,Tetrahymena,Trypanosoma, and Dictyostelium. For this larger
matrix, we filled in character information for these taxa for the 18 Dunn et al. (2008) [25] genes from GenBank as completely as possible. We used Blast scores and existing annotations as criteria for assessing orthology for these added sequences. In this larger matrix, we used only genes from the Dunn et al. (2008) study [25] with greater than 50% taxon representation.
In situ hybridization and immunocytology. RNA in situ hybrid-ization studies were performed as described before [46,52]. For immunocytology studies, polyclonal antibodies were produced to oligopeptides near the C-terminal of theTrox-2,Cnox-1, andCnox-3
proteins. For whole-mount analysis, live animals were fixed for 1 h in 5% formaldehyde in sterile seawater. Immunocytochemistry was performed with anti-Troxor anti-Cnox, respectively, antisera and goat rabbit-AP (Novagen) or FITC-conjugated goat rabbit anti-body (Sigma). Localization of antianti-body complexes was revealed by staining with NBT and X-phosphate (Roche) or fluorescent micro-scopy, respectively. Further details will be described elsewhere (S. Sagasser et al. unpublished data).
Alignment. To generate static alignments, we used MAFFT [53], initially with a gap opening penalty of 1.5 and gap extension penalty of 0.123. We also examined the impact of varying gap opening penalties by obtaining alignments using opening penalties of 1.0, 0.5, and 0.1. The alteration of gap penalty only served to alter the number of characters in our matrices and did not severely impact phylogenetic hypotheses.
phylogenetic hypotheses were compared using the Shimodaira-Hasegawa test [37] and expected likelihood weights [70], as implemented in RAxML.
Supporting Information
Figure S1. Positive or Negative Partitioned Bremer Support for All Nodes under Mitochondrial versus Nuclear Gene Partitions The shown analysis was done for one of the‘‘plausible’’parsimony trees. Other topologies preferred by parsimony analysis gave similar inferences about support. The figure shows whether the partitioned Bremer support values are positive negative or neutral. This figure demonstrates that the nuclear versus mitochondrial partitions all provide similar degrees of support for the various nodes in the tree. Note that over half of the nodes acquire positive support from both partitions (11/21). Most of the negative support in the tree is within the diploblast clade (six out of eight nodes) indicating the instability of the relationships in this clade. Note also that the majority of the negative support comes from mitochondrial partitions further strengthening our contention that the mitochondrial partitions are NOT swamping the nuclear partitions. Nodes at the base of the tree exhibit consistent support from all sources under the shown partitioning scheme. Quite strikingly, nuclear proteins seem to provide the highest positive support of all the characters in the analysis.
Found at doi:10.1371/journal.pbio.1000020.sg001 (70 KB PPT).
Figure S2. Phylogenetic Tree for 73 Taxa Matrix with Bilateria Shown as Major Groups (A) and Including All Taxonomic Names (B) The 73 taxa are comprised of the 64 taxa from the Dunn et al. (2008) study [25] plus nine taxa added from the present study. Since the topologies within Lophotrochozoa, Ecdysozoa, and Deuterostomia are not discussed in our study, we have represented these as major monophyletic groups in this figure (A).
All included taxa are listed in (B). The blue circles indicate that the support for these nodes are 100% jackknife support for unweighted parsimony analysis and 1.0 posterior Bayesian probability for parsmodel analysis in MrBayes. For four nodes relevant to the present study from this larger analysis, the jackknife values and Bayesian posteriors are listed next to the nodes, respectively. Found at doi:10.1371/journal.pbio.1000020.sg002 (105 KB PPT).
Figure S3. 16S rRNA Secondary Structure Prediction Found at doi:10.1371/journal.pbio.1000020.sg003 (126 KB PPT).
Figure S4. In Situ Expression of Hox-Like GenesCnox-1andCnox-3in the HydrozoanEleutheria dichotoma
The two Hox-like genes, Cnox-1 and Cnox-3, display differential spatiotemporal expression patterns in the medusa stage.Cnox-1(A1–
A4) is expressed ectodermally in the so-called Nesselring, an area of
undifferentiated cells lining the ring canal of medusae (cross section:
A3, A4).Cnox-3expression marks the most ectodermal oral part of the
manubrium (B1, B2). Staining is with NBT/X-phosphate (A1, B1) and
fluorescein-labeled probes (A2, B2); the scale bar indicates 50 lm.
Pictures are reprinted from Jakob and Schierwater (2007) [52]. Found at doi:10.1371/journal.pbio.1000020.sg004 (2.17 MB PPT).
Table S1. Survey of the Literature for Hypotheses Concerning the Major Animal Lineages Discussed in This Paper
Found at doi:10.1371/journal.pbio.1000020.st001 (45 KB XLS).
Table S2. GenBank Accession Numbers Used in This Study Found at doi:10.1371/journal.pbio.1000020.st002 (47 KB XLS).
Table S3. Morphology Data Matrix
Found at doi:10.1371/journal.pbio.1000020.st003 (24 KB DOC).
Table S4. Alignment Matrix for 24 Taxa and 73 Taxa (in Nexus Format)
Found at doi:10.1371/journal.pbio.1000020.st004 (1.70 MB TXT).
Table S5. Disposition of PCR and Sequencing of Placozoan and Cubozoan Genes
Found at doi:10.1371/journal.pbio.1000020.st005 (38 KB XLS).
Acknowledgments
We acknowledge helpful comments from the Key Transitions Symposium speakers (Phoenix, Arizona, 2007), the German Zoolog-ical Society meeting speakers (Germany, 2005), Max, and three anonymous reviewers. ME acknowledge the Evangelische Studien-stiftung e.V. Villigst. RD and SOK acknowledge the Lewis B. and Dorothy Cullman Program in Molecular Systematics and the Sackler Institute for Comparative Genomics at the American Museum of Natural History. SOK was supported by the Alfred P. Sloan Foundation. Some symbols in Figure 2 are courtesy of the Integration and Application Network (http://ian.umces.edu/symbols/), University of Maryland Center for Environmental Science.
Author contributions. BS contributed to data collection and analyses, developed the‘‘new placula hypothesis’’and together with RD designed the study. ME, WJ, HJO, HH, and SD collected and analyzed data. SOK and RD performed the phylogenetic analyses. RD and BS coordinated the phylogenetic discussion. All authors contributed to data interpretation and writing.
Funding. Supported by the Deutsche Forschungsgemeinschaft (DFG SCHI-227/24-2, DFG SCHI-227/20-2, HA-1947/5-2), the Lower Saxony Graduate Program, the Human Frontier Science Program, the National Institute of Health (NIH R01 GM38148), and National Science Foundation Award Number 0531677. The funders had no role in study design, data collection and analysis, decision to publish, or preparation of the manuscript.
Competing interests.The authors have declared that no competing interests exist.
References
1. Boero F, Schierwater B, Piraino S (2007) Cnidarian milestones in metazoan evolution. Integr Comp Biol 47: 693–700.
2. Bu¨tschli O (1884) Bemerkungen zur Gastraea-Theorie. Morph Jahrb 9: 415– 427.
3. Gruner HE (1993) Einfu¨hrung, Protozoa, Placozoa, Porifera.Kaestner A, editor. Lehrbuch der Speziellen Zoologie Band I. Jena (Germany): G. Fischer. pp. 62–72.
4. Ivanov AV (1973)Trichoplax adhaerensand the problem of the origin of Metazoa. Doklady Akad Nauk SSSR Ser Biol 211: 1469–1471.
5. Syed T, Schierwater B (2002)Trichoplax adhaerens: discovered as a missing link, forgotten as a hydrozoan, re-discovered as a key to metazoan evolution. Vie Milieu 52: 177–187.
6. Borchiellini C, Chombard C, Manuel M, Alivon E, Vacelet J, et al. (2004) Molecular phylogeny of Demospongiae: implications for classification and scenarios of character evolution. Mol Phylogenet Evol 32: 823–837. 7. Collins A (1998) Evaluating multiple alternative hypotheses for the origin
of Bilateria: an analysis of 18S rRNA molecular evidence. Proc Natl Acad Sci U S A 95: 15458–15463.
8. Ender A, Schierwater B (2003) Placozoa are not derived cnidarians: evidence from molecular morphology. Mol Biol Evol 20: 130–134. 9. Manuel M, Borchiellini C, Alivon E, Le Parco Y, Vacelet J, et al. (2003)
Phylogeny and evolution of calcareous sponges: monophyly of calcinea and calcaronea, high level of morphological homoplasy, and the primitive nature of axial symmetry. Syst Biol 52: 311–333.
10. Schierwater B, DeSalle R (2007) Can we ever identify the Urmetazoan? Integr Comp Biol 47: 670–676.
11. Grell KG, Benwitz G (1971) Die Ultrastruktur vonTrichoplax adhaerensF.E. Schulze. Cytobiologie 4: 216–240.
12. Grell KG (1981)Trichoplax adhaerensand the origin of Metazoa. Origine dei grandi phyla dei Metazoi, Convegno Intern. Rome: Accademia nazionale dei Lincei. pp. 107–121.
13. Ruthmann A (1977) Cell differentiation, DNA content and chromosomes of Trichoplax adhaerensF. E. Schulze. Cytobiologie 15: 58–64.
14. Ruthmann A, Grell KG, Benwitz G (1981) DNA-content and fragmentation of the egg-nucleus ofTrichoplax adhaerens. Z Naturforsch 60: 564–567. 15. Schierwater B, de Jong D, Desalle R (2008) Placozoa and the evolution of
Metazoa and intrasomatic cell differentiation. Int J Biochem Cell Biol 41: 370–379.
16. Schulze FE (1883)Trichoplax adhaerensnov. gen. nov. spec. Zool Anz 6: 92–97. 17. Ax P (1995) Das System der Metazoa I. Jena (Germany): Gustav Fischer. 77–
79 pp.
18. Aleshin VV, Petrov NB (2002) Molecular evidence of regression in evolution of metazoa. Zh Obshch Biol 63: 195–208.
19. Brooke NM, Holland PW (2003) The evolution of multicellularity and early animal genomes. Curr Opin Genet Dev 13: 599–603.
hypotheses of basal animal phylogeny using complete sequences of large and small subunit rRNA. Proc Natl Acad Sci U S A 98: 9707–9712. 22. Schutze J, Krasko A, Custodio MR, Efremova SM, Mu¨ller IM, et al. (1999)
Evolutionary relationships of Metazoa within the eukaryotes based on molecular data from Porifera. Proc R Soc Lond B Biol Sci 266: 63–73. 23. Srivastava M, Begovic E, Chapman J, Putnam NH, Hellsten U, et al. (2008)
TheTrichoplaxgenome and the nature of placozoans. Nature 454: 955–960. 24. Wainright PO, Hinkle G, Sogin ML, Stickel SK (1993) Monophyletic origins
of the metazoa: an evolutionary link with fungi. Science 260: 340–342. 25. Dunn CW, Hejnol A, Matus DQ, Pang K, Browne WE, et al. (2008) Broad
phylogenomic sampling improves resolution of the animal tree of life. Nature 452: 745–749.
26. Ruiz-Trillo I, Roger AJ, Burger G, Gray MW, Lang BF (2008) A phylogenomic investigation into the origin of Metazoa. Mol Biol Evol 25: 664–672.
27. Dellaporta SL, Xu A, Sagasser S, Jakob W, Moreno MA, et al. (2006) Mitochondrial genome of Trichoplax adhaerenssupports Placozoa as the basal lower metazoan phylum. Proc Natl Acad Sci U S A 103: 8751–8756. 28. Lavrov DV, Forget L, Kelly M, Lang BF (2005) Mitochondrial genomes of
two demosponges provide insights into an early stage of animal evolution. Mol Biol Evol 22: 1231–1239.
29. Signorovitch AY, Buss LW, Dellaporta SL (2007) Comparative genomics of large mitochondria in placozoans. PLoS Genet 3: e13. doi:10.1371/journal. pgen.0030013
30. Boero F, Bouillon J, Piraino S (2005) The role of Cnidaria in evolution and ecology. Ital J Zool 72: 65–71.
31. Boero F, Gravili C, Pagliara P, Piraino S, Bouillon J, et al. (1998) The cnidarian premises of metazoan evolution: from triploblasty, to coelom formation, to metamery. Ital J Zool 65: 5–9.
32. Seipel K, Schmid V (2005) Evolution of striated muscle: jellyfish and the origin of triploblasty. Dev Biol 282: 14–26.
33. Seipel K, Schmid V (2006) Mesodermal anatomies in cnidarian polyps and medusae. Int J Dev Biol 50: 589–599.
34. Bridge D, Cunningham CW, Schierwater B, DeSalle R, Buss LW (1992) Class-level relationships in the phylum Cnidaria: evidence from mitochon-drial genome structure. Proc Nat Acad Sci U S A 89: 8750–8753. 35. Collins AG, Schuchert P, Marques A, Jankowski T, Medina M, et al. (2006)
Medusozoan phylogeny and character evolution clarified by new large and small subunit rDNA data and an assessment of the utility of phylogenetic mixture models. Syst Biol 55: 97–115.
36. Shimodaira H, Hasegawa M (2001) CONSEL: for assessing the confidence of phylogenetic tree selection. Bioinformatics 17: 1246–1247.
37. Shimodaira H, Hasegawa M (1999) Multiple comparisons of log-likelihoods with applications to phylogenetic inference. Mol Biol Evol 16: 1114–1116. 38. Baurain D, Brinkmann H, Philippe H (2006) Lack of resolution in the animal phylogeny: closely spaced cladogeneses or undetected systematic errors? Mol Biol Evol 24: 6–9.
39. Philippe H, Telford MJ (2006) Large-scale sequencing and the new animal phylogeny. Trends Ecol Evol 21: 614–620.
40. Rodriguez-Ezpeleta N, Brinkmann H, Roure B, Lartillot N, Lang BF, et al. (2007) Detecting and overcoming systematic errors in genome-scale phylogenies. Syst Biol 56: 389–399.
41. Rokas A, Carroll SB (2006) Bushes in the tree of life. PLoS Biol 4: e352. doi:10.1371/journal.pbio.0040352
42. Rokas A, Kruger D, Carroll SB (2006) Animal evolution and the molecular signature of radiations compressed in time. Science 310: 1933–1938. 43. DeSalle R, Schierwater B (2007) Key transitions in animal evolution. Integr
Comp Biol 47: 667–669.
44. Schierwater B, Dellaporta S, DeSalle R (2002) Is the evolution of Cnox-2 Hox/ParaHox genes‘‘multicolored’’and‘‘polygenealogical’’? Mol Phyloge-net Evol 24: 374–378.
45. Schierwater B, Kamm K, Srivastava M, Rokhsar D, Rosengarten RD, et al.
(2008) The early ANTP gene repertoire: insights from the placozoan genome. PLoS ONE 3: e2457. doi:10.1371/journal.pone.0002457
46. Jakob W, Sagasser S., Dellaporta SL, Holland PW, Kuhn K, et al. (2004) The Trox-2 Hox/ParaHox gene of Trichoplax (Placozoa) marks an epithelial boundary. Dev Genes Evol 214: 170–175.
47. Blackstone NW (2007) A food’s-eye view of the transition from basal metazoans to bilaterians. Integr Comp Biol 47: 724–733.
48. Ball EE, de Jong DM, Schierwater B, Shinzato C, Hayward DC, et al. (2007) Implications of cnidarian gene expression patterns for the origins of bilaterality—is the glass half full or half empty? Integr Comp Biol 47: 701– 711.
49. Larroux C, Fahey B, Degnan SM, Adamski M, Rokhsar DS, et al. (2007) NK homeobox gene cluster predates the origin of Hox genes. Curr Biol 17: 706–710.
50. Peterson KJ, Sperling EA (2007) Poriferan ANTP genes: primitively simple or secondarily reduced? Evol Dev 9: 405–408.
51. Syed T, Schierwater B (2002) The evolution of the Placozoa: a new morphological model. Senckenbergiana lethaea 82: 315–324.
52. Jakob W, Schierwater B (2007) Changing hydrozoan bauplans by silencing Hox-like genes. PloS ONE 2: e694. doi:10.1371/journal.pone.0000694 53. Katoh K, Kuma K, Toh H, Miyata T (2005) MAFFT version 5: improvement
in accuracy of multiple sequence alignment. Nucleic Acids Res 33: 511–518. 54. Swofford DL (2003) PAUP*: phylogenetic analysis using parsimony (*and other methods), version 4 [computer program]. Sunderland (Massachu-setts): Sinauer Associates.
55. Gonnet GH, Cohen MA, Benner SA (1992) Exhaustive matching of the entire protein sequence database. Science 256: 1443–1445.
56. Whelan S, Goldman N (2001) A general empirical model of protein evolution derived from multiple protein families using a maximum-likelihood approach. Mol Biol Evol 18: 691–699.
57. Le SQ, Gascuel O (2008) An improved general amino acid replacement matrix. Mol Biol Evol 25: 1307–1320.
58. Bremer K (1988) The limits of amino-acid sequence data in Angiosperm phylogenetic reconstruction. Evolution 42: 795–803.
59. Baker RH, DeSalle R (1997) Multiple sources of character information and the phylogeny of Hawaiian drosophilids. Syst Biol 46: 654–673.
60. Baker RH, Yu X, DeSalle R (1998) Assessing the relative contribution of molecular and morphological characters in simultaneous analysis trees. Mol Phylogenet Evol 9: 427–436.
61. Sorenson MD, Franzosa EA (2007) TreeRot, version 3 [computer program]. Boston: Boston University.
62. Altekar G, Dwarkadas S, Huelsenbeck JP, Ronquist F (2004) Parallel Metropolis coupled Markov chain Monte Carlo for Bayesian phylogenetic inference. Bioinformatics 20: 407–415.
63. Ronquist F, Huelsenbeck JP (2003) MrBayes 3: Bayesian phylogenetic inference under mixed models. Bioinformatics 19: 1572–1574.
64. Stamatakis A (2006) RAxML-VI-HPC: maximum likelihood-based phyloge-netic analyses with thousands of taxa and mixed models. Bioinformatics 22: 2688–2690.
65. Lanave C, Preparata G, Saccone C, Serio G (1984) A new method for calculating evolutionary substitution rates. J Mol Evol 20: 86–93. 66. Rodriguez F, Oliver JL, Marin A, Medina JR (1990) The general stochastic
model of nucleotide substitution. J Theor Biol 142: 485–501.
67. Yang Z (1994) Maximum likelihood phylogenetic estimation from DNA sequences with variable rates over sites: approximate methods. J Mol Evol 39: 306–314.
68. Yang ZH (1993) Maximum-Likelihood estimation of phylogeny from DNA-sequences when substitution rates differ over sites. Mol Biol Evol 10: 1396– 1401.
69. Stamatakis A, Hoover P, Rougemont J (2008) A rapid bootstrap algorithm for the RAxML web servers, Syst Biol 57: 758–771.