Complete Mitochondrial Genome and Phylogeny
of Pleistocene Mammoth
Mammuthus primigenius
Evgeny I. Rogaev
1,2,3,4*, Yuri K. Moliaka
1,5, Boris A. Malyarchuk
6, Fyodor A. Kondrashov
7, Miroslava V. Derenko
6,
Ilya Chumakov
8, Anastasia P. Grigorenko
2,31Brudnick Neuropsychiatric Research Institute, Department of Psychiatry, University of Massachusetts Medical School, Worcester, Massachusetts, United States of America, 2Laboratory of Molecular Brain Genetics, Research Center of Mental Health, Russian Academy of Medical Sciences, Moscow, Russia,3Faculty of Bioengineering and Bioinformatics, Lomonosov Moscow State University, Moscow, Russia,4Vavilov Institute of General Genetics, Russian Academy of Sciences, Moscow, Russia,5Research Center of Medical Genetics, Russian Academy of Medical Sciences, Moscow, Russia,6Genetics Laboratory, Institute of Biological Problems of the North, Russian Academy of Sciences, Magadan, Russia,7Section of Ecology, Behavior and Evolution, University of California San Diego, La Jolla, California, United States of America,8Serono Genetics Institute SA, Evry Cedex, France
Phylogenetic relationships between the extinct woolly mammoth
(Mammuthus primigenius),
and the Asian
(Elephas
maximus)
and African savanna
(Loxodonta africana)
elephants remain unresolved. Here, we report the sequence of the
complete mitochondrial genome (16,842 base pairs) of a woolly mammoth extracted from permafrost-preserved
remains from the Pleistocene epoch—the oldest mitochondrial genome sequence determined to date. We demonstrate
that well-preserved mitochondrial genome fragments, as long as
;
1,600–1700 base pairs, can be retrieved from
pre-Holocene remains of an extinct species. Phylogenetic reconstruction of the Elephantinae clade suggests that
M.
primigenius
and
E. maximus
are sister species that diverged soon after their common ancestor split from the
L. africana
lineage. Low nucleotide diversity found between independently determined mitochondrial genomic sequences of
woolly mammoths separated geographically and in time suggests that north-eastern Siberia was occupied by a
relatively homogeneous population of
M. primigenius
throughout the late Pleistocene.
Citation: Rogaev EI, Moliaka YK, Malyarchuk BA, Kondrashov FA, Derenko MV, et al. (2006) Complete mitochondrial genome and phylogeny of Pleistocene mammoth Mammuthus primigenius.PLoS Biol 4(3): e73.
Introduction
Mammuthus, Elephas,
and
Loxodonta
(family Elephantidae,
subfamily Elephantinae) are closely related genera that
evolved in the African Pliocene, possibly from the genus
Primelephas
[1–4]. The woolly mammoth
Mammuthus
primige-nius
became extinct across most of its former range along
with other late Pleistocene megafauna, although small,
isolated mammoth populations survived into the
mid-Holocene [5]. The phylogeny of Elephantinae has not been
resolved. Morphological analyses have yielded conflicting
phylogenies for
M. primigenius, Elephas maximus,
and
Loxodonta
africana
[1–4]. Dental characters suggest a closer relationship
between
M. primigenius
and
E. maximus,
trunk tip morphology
supports a grouping of
M. primigenius
and
L. africana,
and
immunological and hair structure characters could not
confidently resolve the phylogeny of these three taxa [1–4].
Molecular analyses have also generated conflicting
conclu-sions [1–4]. Data on short mitochondrial DNA (mtDNA)
sequences have variously supported a monophyletic clade of
the extant elephant species, have grouped
M. primigenius
with
either
E. maximus
[6] or
L. africana
[7–9], or have been
inconclusive [10,11]. DNA template modifications caused by
oxidation or hydrolysis are a potential source of artificial
mutations and may partly explain the high polymorphism
initially observed for some short mammoth DNA sequences,
although pseudogenes of mitochondrial origin located in the
nuclear genome, which are common in elephants, may also be
a potential factor [10]. A meta-analysis taking into account
potential sequencing and other errors favored the
M.
primigenius–L. africana
clade [9]. Clearly, a comprehensive
analysis of longer genomic sequences is necessary to resolve
this phylogeny, but so far only short DNA fragments have
been retrieved from
M. primigenius
.
Results/Discussion
The woolly mammoth leg with intact muscle and skin tissue
was found in the Enmynveem River valley (Chukotka) in
north-eastern Siberia in 1986 (Figures 1 and S1). Since then,
the collected muscle specimens of the mammoth (hereafter
called Enmyn) were kept frozen. Radiocarbon method dated
the specimens to
;
33,750–31,950 y BP (before present) [12].
An initial examination suggested that the soft tissue was
remarkably well preserved, and no signs of tissue decay were
noticed when the specimen was excavated from the
perma-frost. Because no tissue damage by insects or other animals
was observed, the remains presumably were quickly buried
and have never been defrosted. The cells with nuclei were
observed in epithelia and muscle tissue. The treatment with
DAPI efficiently stained the nuclei, indicating the existence of
Academic Editor:David Penny, Massey University, New Zealand
ReceivedDecember 7, 2005;AcceptedJanuary 10, 2006;PublishedFebruary 7, 2006
DOI:10.1371/journal.pbio.0040073
Copyright:Ó2006 Rogaev et al. This is an open-access article distributed under the terms of the Creative Commons Attribution License, which permits unrestricted use, distribution, and reproduction in any medium, provided the original author and source are credited.
Abbreviations:bp, base pair; ML, maximum likelihood; mtDNA, mitochondrial DNA; numt, nuclear mitochondrial DNA; UMASS MS, University of Massachusetts Medical School; VNTR, variable number of tandem repeats
well-preserved genomic DNA (Figure 2A). To our knowledge,
this is the first documented cytogenetically detectable nucleus
with genomic DNA in such an ancient tissue (
.
30,000 y BP).
In accordance with these primary observations, a
substan-tial amount of genomic DNA was extracted and detected on
an electrophoresis gel. Although the extracted DNA was
apparently degraded, it is yet of remarkable quality and
quantity. For example, the major fraction of DNA fragments
from one extract (shown in Figure 2B) ranged from 100 base
pairs (bp) to 600 bp, with diminishing amounts at higher
molecular weights. Microbial DNA may potentially contribute
to the high-molecular-weight DNA fraction. Nevertheless, the
PCR analysis described below (Figure 2C and 2D) supports
the assertion that this mammoth specimen contains
pre-served DNA. Independent replication in PCR analysis is
absolutely imperative for the study of ancient DNA.
There-fore, several DNA extracts from the tissue specimens were
obtained for the mitochondrial genome analysis.
Importantly, the replication in this study was not limited to
selected mitochondrial genome regions, and the entire
mitochondrial genome was sequenced in duplicate. Different
DNA extracts from mammoth muscle tissue were used to
generate PCR products and reconstruct the complete
mitochondrial genome in Moscow (‘‘MOS contig’’, completed
in 2000) and, independently, at the University of
Massachu-setts Medical School (UMASS MS) laboratories (‘‘UM contig’’,
completed in 2005) (see Materials and Methods). No
contamination by extraneous DNA was found in multiple
PCR experiments. Apart from a variable number of tandem
repeats (VNTR) in the control region characterized by high
somatic hypervariability, the mtDNA sequences obtained
from different extracts and different laboratories matched
exactly. This accuracy was achieved with the following
protocol. (I) Redundant oligonucleotide primers were
de-signed and tested to yield a sufficient amount of PCR
products (Figures S2–S4 and Table S1). Preliminary tests
with these primers were conducted to demonstrate the
applicability of DNA extracts for PCR. We consistently found
efficient recovery of at least
;
500- to 700-bp PCR fragments
from mammoth DNA extracts. Moreover, PCR of complete
gene sequences of
;
1,200–1,700 bp was also efficient, but the
mtDNA sequence larger than 3,000 bp was not amplifiable
(Figure 2C and 2D and Methods and Materials). The data are
consistent with excellent preservation coupled with some
degradation due to the ancient origin of the DNA. (II) The
large amount of DNA enabled us to obtain PCR products
sufficient for sequencing after the first round of PCR reaction
and minimized the risk that sequence errors arose due to
template switching during PCR, because of the low number of
original DNA templates [13,14]. (III) Direct sequencing of
PCR products gave clean chromatogram reads (Figure S5). In
all cases, the replication of sequencing in each nucleotide
position was performed from different PCR products using
the protocols described in Materials and Methods. In
addition, the PCR products were cloned and the independent
clones were also sequenced. As expected, the cloned mtDNA
fragments occasionally contained random mutations with an
average rate of
;
6/1,000 bp. No cloned sequences with
identical sets of mutations were identified. These sequence
modifications were mostly transitions corresponding to type I
(A
!
G/T
!
C) and type II (C
!
T/G
!
A) mutations, which have
previously been detected in ancient DNA (Figure S6) [13–15].
Figure 1.The Right Back Leg of the Woolly Mammoth(M. primigenius)Found in Siberia
The well-preserved mammoth body fragment with foot (33336 cm), shin, and ankle-joint (the total length is ;88 cm) was found in the Enmynveem River valley (north-eastern Siberia, Chukotka). The tissue material (bones, muscles, and skin) had no visible marks of tissue damage by insects or other animals. Radiocarbon dating of the skin and muscle tissue determined that the mammoth lived 32,8506900 y ago [12]. DOI: 10.1371/journal.pbio.0040073.g001
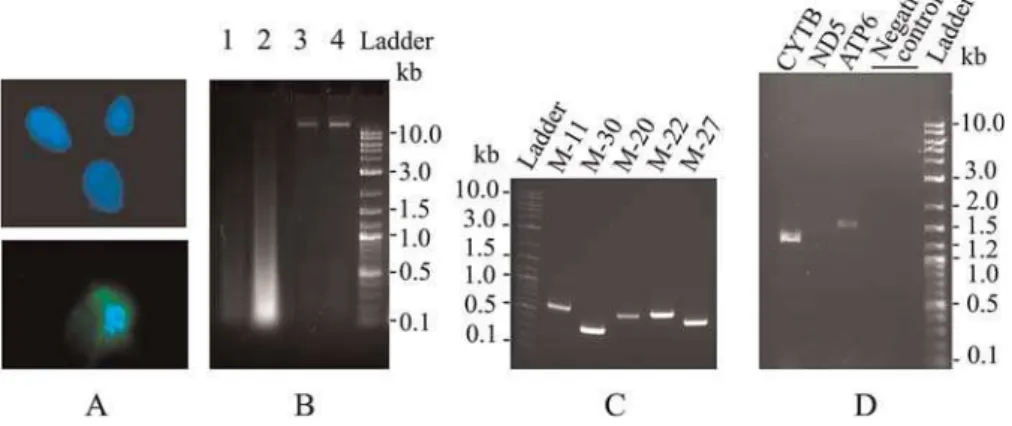
Figure 2.The Unusually Well-Preserved Mammoth DNA
(A) Nuclei with DNA clearly detectable by DAPI staining in muscle cells of;33,000-y-oldM. primigenius. (B) Total genomic DNA isolated from the mammoth muscle tissue (lane 1 is 1/10 dilution of the DNA on lane 2); control DNA from fresh human blood samples in lanes 3 and 4. (C) Examples of PCR products (;300–600 bp) for mammoth mitochondrial genome. (D) PCR amplification recovers long sequences for complete mitochondrial genes (1,317 bpCytBand 1,613 bpATP6genes), but PCR of larger fragments (3,054 bpND5) is failed.
As described previously for ancient DNA, type II mutations
were predominant in the cloned mammoth mtDNA
sequen-ces (
.
70%). The sequence modifications were not detectable
in direct PCR product sequences of the same region (Figure
S5). The data indicate that the mutations in cloned DNA were
random and rare in each site of individual molecules. No
contamination with nuclear mitochondrial DNA (numt) was
found for any PCR product of mammoth DNA (Materials and
Methods). Direct sequencing of multiple PCR products and
independent clones provided evidence of accurate
recon-struction of authentic mitochondrial genome sequence of
M.
primigenius
.
The sequence of the small region (VNTR) in the control
region (D-loop) could not be determined by direct
sequenc-ing of PCR products. Thus, the analysis of cloned PCR
fragments was undertaken. The sequence analysis
demon-strated somatic heteroplasmy and high molecular
hetero-geneity in this region. The heterohetero-geneity resulted from
hypervariability in a number of short hexa-nucleotide
tandem repeats (CGCATA)
nresembling VNTR (Figure S4).
Similar VNTR was found in the control mtDNA region in
Loxodonta
and
Elephas
also.
To determine the evolutionary history of the woolly
mammoth, we sequenced complete mitochondrial genomes
of
L. africana
and
E. maximus
. To exclude the possibility of
DNA contamination, the elephant specimens were obtained
only after the primary mitochondrial genome sequence of
M.
primigenius
was completed (Materials and Methods).
Long-range PCR was initially used for the amplification of the
overlapping
;
3–5 kb mtDNA fragments of African and Asian
elephants. The sequence analysis was also conducted for
cloned PCR fragments and short PCR fragments as described
in mammoth mtDNA analysis. The
E. maximus
and
L. africana
mitochondrial genomes sequenced in this study were highly
similar but not identical to those submitted to GenBank
previously.
Similar to other placental mammals, the mammoth
mitochondrial genome contains 13 protein coding genes, 22
tRNA and two rRNA genes, and the D-loop control region
(Figure 3). The length of the genome varied due to somatic
variability of tandem DNA repeats (CGCATA)
nin the control
region. The length of the mammoth mitochondrial genome
was 16,842 bp, if the longest VNTR tract was included (Figure
S4). Start and stop codons were identical in
M. primigenius, L.
africana,
and
E. maximus;
however, we found a substitution
(G
!
A) in the
ND4
gene leading to a premature stop codon in
the C-terminus of the protein. Thus, the ND4 protein is four
amino acids shorter in
M. primigenius
than in elephants. A
multiple alignment of this gene showed that the C-terminal
end of the ND4 protein is variable in sequence and in length
in other animal species. Substitutions in the mammoth
lineage were predominantly transitions (19/339 transversion/
transition ratio in mammoth versus 13/351 in
E. maximus
when
polarized with
L. africana
). The total number of nucleotide
and amino acid differences between the mammoth and
E.
maximus
genomes was 722 and 100, and between the
mammoth and
L. africana
genomes 780 and 107, respectively
(Table S2).
The phylogeny of Elephantinae was inferred using the
newly obtained
M. primigenius, E. maximus,
and
L. africana
sequences, and other complete mitochondrial genome
sequences of
E. maximus
and
L. africana,
while the
mitochon-drial genomes of the closest extant taxa [16], the dugong
(Dugong dugon)
and the hyrax
(Procavia capensis),
were used as
outgroups. The same topology was recovered by a variety of
tree reconstruction methods (Figure 4). As expected,
individ-uals from the same species,
E. maximus
and
L. africana,
clustered together on the tree.
M. primigenius
was determined
to be a sister species to
E. maximus,
i.e., the woolly mammoth
shared a common ancestor with the Asian elephant more
recently than with the African elephant. A maximum
likelihood (ML) ratio test comparing all three possible
topologies of the Elephantinae species corroborates this
conclusion (
p
,
0.01; see Materials and Methods). We also
reconstructed the phylogeny of these species by using only
individual protein and rRNA genes (tRNA genes are too short
and contain too few substitutions). The majority, but not all
(Table S3), of trees reconstructed with the sequence of
individual genes supported the topology recovered using the
complete genome. Although the topology of this tree appears
robust, the unavailability of an outgroup more closely related
than the dugong and hyrax calls for the sequencing of nuclear
M. primigenius
genes to further test the results reported here.
The resolution of the Elephantinae phylogeny makes it
possible to estimate the time of divergence of
M. primigenius
from its sister species
E. maximus
. Such an estimate usually
relies on the existence of a molecular clock, i.e., a uniform
rate of evolution of all compared clades, and on having
calibration points from the fossil record. However, previous
studies suggested that the evolution of the Elephantinae
mitochondrial genomes may be inconsistent with the
molec-Figure 3.Mitochondrial Genome of the Woolly MammothM. primigeniusThe complete mitochondrial genome was determined independently in two different laboratories using designs with multiple primers for overlapping PCR fragments ranged from;325 to;650 bp; the longer PCR fragments were also produced and sequenced. The overlapped PCR products used for sequencing and cloning are shown by the inner circle. Only PCR fragments produced from different pairs of primers are shown. Two genes,ATP6andND4L,overlap with neighboring genes.
ular clock [3,8], and so we tested this possibility using
complete genomes. Tajima’s relative rate test showed no
difference in the rate of evolution of different Elephantinae
lineages (unpublished data). Similarly, a likelihood ratio test
did not reject the assumption of equal rate of evolution of the
M. primigenius
versus the
E. maximus
lineage using the
L.
africana
genome as an outgroup (Materials and Methods). In
contrast, the assumption of a molecular clock was rejected
when the likelihood ratio test was performed on simulations
involving a comparison of the
M. primigenius
–
E. maximus
clade
with the
L. africana
lineage when the dugong and hyrax
species were used as outgroups (without molecular clock
LnL1
¼
56661.45; with molecular clock LnL2
¼
56877.63;
p
0.01).
Molecular clock analyses are highly sensitive to the
molecular distance of the outgroups, which can affect the
correct root placement. Clearly, the dugong and hyrax are
not ideal outgroups for this analyses, as their approximate
nonsynonymous nucleotide divergence (dn) with the
Ele-phantinae species is
;
0.15 while synonymous nucleotide
divergence is at saturation (ds
;
1.2). Thus, the change in the
rate of evolution implied by the ML analysis must be treated
with caution. However, a simple parsimony assay
corrobo-rated the possibility that the mitochondrial genomes of
different Elephantinae species evolve at different rates (Table
S4). A ML estimate of the number of substitutions per lineage
yielded quantitatively similar results (unpublished data).
These observations, coupled with previous reports [3,8],
imply that a molecular clock assumption may be
inappro-priate when estimating the time of divergence of
Elephanti-nae species. Thus, we used a heuristic rate smoothing
procedure for ML estimates [17], which takes into account
different rates of evolution among different branches of the
tree. Using the calibration points of 6 million y for the
E.
maximus
–
L. africana
split and 65 million y for the
Elephanti-dae–Sirenia split (see [8] and references within), the time of
divergence of
M. primigenius
and
E. maximus
was estimated as
;
4 million y ago (
6
0.01 s.e.). This estimate must be treated
with caution because it relies on the correct paleontological
dating of the
E. maximus–L. africana
divergence. Nevertheless,
these data clearly indicate that the divergence of the woolly
mammoth from the Asian elephant occurred soon after the
divergence of their ancestor lineage from African elephants.
To further verify the accuracy of our sequence and to
investigate the level of nucleotide diversity in the woolly
mammoth population, we compared our sequence to the
longest available sequences of the mammoth mitochondrial
genome from other individuals. Two
CytB
gene sequences from
mammoth individuals found in north-eastern Siberia
(Mag-adan region, Kirgilyakh Creek near Kolima River) [18] and
north-central Siberia (Pyasina River valley in Taimyr
Pen-insula) [19] show very high similarity, while the 12S RNA gene
[19] was identical to the corresponding genes in our
mitochondrial genome sequence from Chukotka’s mammoth
(Table S5). All these sequences were recovered from muscle
specimens enriched in mtDNA and, thus, very likely had no
numt contamination. The Chukotka Enmynveem River valley
is
;
1,000 km from Kirgilyakh Creek and
;
2,900 km from the
Pyasina River valley. The data suggest a relatively low genetic
diversity of mammoth maternal lineages in mammoth
pop-ulation spanning vast territory in Northern Siberia. Two
recent studies have also demonstrated the isolation of multiple
fragments of mammoth DNA [20,21]. In one report, a novel
approach was applied for direct cloning and shotgun
sequencing of random DNA fragments. The set of multiple
fragments corresponding to partial mitochondrial genome
sequence contained sequences with ancient DNA artifact
mutations and potential numts and cannot yet be reliably used
for comparative analysis of complete mitochondrial genomes
[21]. Another group reported the complete mitochondrial
genome sequence [20] of a
;
12,170-y-old woolly mammoth
that was found in the Berelyekh Yakutia region (70
8
35
9
N, 145
8
00
9
E), which is
;
900 km from the Enmynveem River valley (68
8
10
9
N, 165
8
56
9
E). A comparison of the two complete genomes
revealed a pattern of high similarity with the nucleotide
diversity of
;
0.3% (Table S5). This diversity may be even lower
since sequence errors may be present in the genome sequences
recovered from ancient specimens. When the differences
between the two mammoth mitochondrial genomes were
polarized with
E. maximus
sequence, the number of
sequence-specific polymorphisms for the mitochondrial genome
se-quence determined here was slightly lower (by
;
25%) than in
the mitochondrial genome sequence described in the other
Figure 4.Paenungulata Tree and Phylogenic Relationship of the WoollyMammoth
The analysis of complete mtDNA sequences placesM. primigeniuswithE. maximuson the tree. The Sirenia(D. dugon)and Hyracoidea(P. capensis),
most closely related species among extant taxa to Elephantinae, were taken as outgroups. Bootstrap values and posterior probabilities were calculated using a Bayesian approach [29,31] assuming a gamma distribution of the rates of evolution across sites with a General Time Reversible model (normal font), HKY model (bold), with a parsimony approach (italic), and by neighbor joining (italic and bold) [28]. The scale is 0.1 substitutions per site. The mitochondrial genomes of M. primigenius, E. maximus A, E. maximus B, L. africana A, L. africana B, D. dugon,andP. capensiswere used in the analysis.
study [20]. The sequence [20] also showed a higher ratio of
nonsynonymous to synonymous substitutions in protein
coding genes and a higher number of nucleotide substitutions
in the entire genome (C
!
T/G
!
A transitions) that are often
associated with ancient DNA modifications (Tables S6 and S7).
Although these differences were not statistically significant, a
large number of nonsynonymous substitutions was observed in
the
ND2
gene in sequence [20], but not in our sequence (Table
S6). The possibility that these changes appeared due to
positive selection in one of the mammoth lineages seems
highly unlikely, the more reasonable explanation being that
the genome sequence from [20] may harbor some
post-mortem ancient DNA mutations (most
ND2
nonsynonymous
mutations were C
!
T/G
!
A). However, these artifacts appear
to be rare. In sum, the independently determined
mitochon-drial genome sequences from
;
33,000-y-old (present study)
and
;
12,000-y-old [20] animals were highly similar, and, owing
to a few potential errors, the true level of mitochondrial
nucleotide variability may be slightly lower than 0.3%.
The low nucleotide diversity of mammoth mitochondrial
sequence (
p
;
0.003; Table S5) is an order of magnitude lower
than that reported for the overall populations of
L. africana
(
p
;
0.02) [22] and
E. maximus
(
p
;
0.017) [23,24], but similar to
the values reported for select populations of
L. africana
(
p
;
0.00084–0.027) and
E. maximus
(
p
;
0.0024–0.0055) [22–24].
These data suggest that unlike the Asian and African
elephants, the mammoth population has not had a complex
population structure and has had a relatively low genetic
diversity in mitochondrial lineages, at least in the area
spanning thousands of kilometers in north-eastern Siberia.
Further sequencing of mitochondrial genomes of other
mammoth specimens can clarify the diversity of the ancient
mammoth population.
The phylogenic reconstructions based on complete
mito-chondrial sequence analysis is a powerful method to
determine the relationship between taxa or even closely
related extinct and extant species as demonstrated here and
elsewhere [25]. However, mitochondrial and nuclear DNA
may have a different coalescent history, and
cytonuclear-genomic dissociation has been described recently in African
forest and savanna elephants [26]. Given the unique quality of
the specimens from the Enmyn mammoth, nuclear DNA may
potentially be recovered [21] and used for further
confirma-tion of the topology reconstructed in this study. Our data
demonstrate that very high-quality genomic DNA may be
recovered from ancient remains of the Pleistocene age and
that sequencing of complete mitochondrial genomes can lead
to reliable phylogenic reconstructions and population studies
not only for extant, but also for extinct species.
Materials and Methods
Extraction of genomic DNA. Microscopy analysis and DAPI staining of cells demonstrated the preservation of DNA in the mammoth specimens. Genomic DNA was extracted from the muscle mammoth specimens using silica-based and phenol-chloroform extraction methods, but the phenol-chloroform method was more efficient when extracting large amounts of DNA. The following protocol was used for phenol-chloroform DNA isolation. DNA was extracted from;0.1–0.4 g of muscle tissue in a solution containing 50mM Tris-HCl (pH 8.0), 100mM NaCl, 10–25 mM EDTA, 1%–2% SDS, and at least 100 lg/ml proteinase K for 16–24 h at 37 8C,
followed by phenol-chloroform extraction. DNA purification was completed by precipitation with 75% ethanol or by concentrating
with Centricon YM centrifugal filter devices (with Amicon filter). DNA quality was analyzed by agarose electrophoresis and PCR.
Mammoth DNA.First, DNA prepared from different samples and by different methods (silica-based and phenol-chloroform extraction methods) was used for PCR of the CytB gene. The analysis demonstrated that the sequences from various DNA extracts were identical and corresponded to previously reported short sequences for mammoth CytB gene. After the preliminary experiments, an average length of PCR product of 500- to 600-bp range was chosen to determine the complete mtDNA sequence ofM. primigenius. To design the PCR primers, we used the sequences of mitochondrial genome in the GenBank database available at the time. (Note: this project was launched in January 2000). Each primer pair was placed over the alignment of mitochondrial genomes of L. africana,hippopotamus, rhinoceros, and donkey. We gave preference to the primers located in the most conservative regions to keep the number of ambiguous nucleotides in designed oligonucleotide primers as small as possible. Ultimately, to amplify the whole mitochondrial genome of the mammoth, 35 pairs of redundant primers producing overlapping PCR fragments were designed.
On average, the length of overlapped sequences between PCR fragments produced from different primers was;30 bp (excluding primer sequences), but were as long as;200 bp in some cases. The anticipated size of the PCR fragments ranged from 325 bp to 650 bp and was 929 bp for the VNTR region. To determine the complete mtDNA sequence in UMASS MS, additional primer oligonucleotides were designed as shown in Table S1. On average, the mtDNA sequence was covered;nine times in MOS contig and;five times in UM contig by sequencing from different PCR products and clones. The total number of sequenced nucleotides determined from two complementary strands was 240,094. The total length of overlapped sequence obtained from different primers was at least 7,000 bp. In addition, we were able to produce several large PCR fragments (the sequence length between direct and reverse primers and correspond-ing mitochondrial genome region are indicated): L4-H5 968 bp (16S rRNA), L6-H7 1,061 bp (16S rRNA; tRNA Leu;ND1), L8-H10 1,642 bp (or 1,683 bp with primers) (ND1;tRNAs Ile, Gln, Met;ND2;tRNAs Trp, Ala, Asn), L16-H18 1,572 bp (COX2; tRNA Lys; ATP8; ATP6; COX3), L24-H26 1,502 bp (tRNA Leu;ND5), L29-H31 1,271 bp (tRNA Glu;CYTB;tRNAs Thr, Pro), L33-H35 1,131 bp (D-loop; tRNA Phe; 12S rRNA) that covered the shorter PCR fragments. No mismatches in the overlapped sequences or in the independent PCR products were found.
The standard PCR was conducted in total volume of 25 ll
containing 1–2 U Taq1 DNA polymerase in a buffer with 10mM Tris-HCl (pH 8.3), 0.25 mM dNTPs (Gibco BRL, Gaithersburg, Maryland, United States), 0.2–2 mM BSA, 1.5–2.5mM MgCl2, 20 pmol
of each primer or in total volume 25 or 50ll containing 1–2 U of
PicoMaxx High Fidelity PCR System (Taq2000 DNA polymerase, cloned Pfu DNA polymerase, and ArchaeMaxx polymerase enhancing factor in a 13 Picomaxx reaction buffer [Stratagene, La Jolla, California, United States]) and 20 pmol of each primer. The PCR conditions were 948C for 1–2 min, followed by 32–35 cycles of 948C denaturation for 30–40 s, 53–588C annealing for 30–40 s, and 728C extension for 30 s to 1 min. The PCRs were accompanied by negative controls containing the reaction solutions with no DNA (Figures 2 and S2). We found that some DNA extracts taken in high concentration may have inhibitory effects on PCR. The series of dilutions of the extracts were undertaken to identify the optimal concentration of DNA sufficient to produce PCR products after 32– 35 rounds. Re-amplification by secondary PCR was not necessary. The PCR fragments were analyzed by 1.7%–2 % agarose gel stained by ethidium bromide. The PCR fragments were excised from agarose gels and purified via Qiagen columns. The PCR fragments were cloned into pGEM-T vectors (Promega, Madison, Wisconsin, United States), and the PCR fragments and clones with inserts were subjected to sequencing from mtDNA primers or vector SP6 and T4 primers using ABI PRISM BigDye kit for ABI analyzers following manufac-turer’s instructions (Applied Biosystems, Foster City, California, United States).
mito-chondrial sequences were found. These diverged numts were found when some pairs of primers were used for long-range PCR using elephant DNA isolated by Qiagen kits. These pairs of primers have never been used for mammoth DNA PCR analysis. The mammoth DNA was also isolated from muscle tissue that has a relatively high proportion of mtDNA to nuclear DNA. The elephant numt sequences were removed from analysis, and the mtDNA regions were re-sequenced using other sets of primers and PCR products. Finally the complete mitochondrial genome sequences were determined from multiple independent PCR products. Comparison of the sequences determined in this study (animal A) with the correspondingL. africana
B andE. maximusB sequences from the GenBank revealed their high similarity. The divergence of the sequences of these animals is likely due to polymorphisms. The potential sequence errors in the GenBankE. maximusmtDNA andL. africanamtDNA sequences might be of some concern. However, the results of phylogenic reconstruc-tions remained qualitatively the same regardless of which sequences were used (ours or GenBank’s) in comparative analysis with mammoth mitochondrial genome sequence.
Sequence authentication.The work was performed in accordance with commonly accepted standards for ancient DNA analysis. Multiple measures were undertaken to exclude contamination, potential artifact DNA changes specific to post-mortem specimens, or the inclusion of numts in the mitochondrial sequence. The measures are summarized as follows. Large amounts of DNA were extracted from the well-preserved specimens. The sequencing of PCR products obtained after the first round of amplification guaranteed that no sequence errors arise due to the low number of original DNA templates and template switching during PCR. The mtDNA sequen-ces obtained from different DNA extracts were identical. The complete mitochondrial genome sequences were determined in replication in two laboratories in different countries at different times. Apart from the VNTR region, the two mitochondrial genome sequences (MOS and UM contigs) were identical. Stringent precau-tions were undertaken for PCR work with ancient DNA. The work in the Moscow laboratory was conducted in a special sterile box that included two rooms designed for overnight UV irradiation. The box where the work with ancient DNA was conducted was separated from other laboratory rooms and equipment. The PCR and electrophoresis were always performed in separate rooms. No work with any animal DNA had ever been conducted in this laboratory prior to this project. The work at UMASS MS was performed in a new laboratory using novel equipment, pipettes, PCR station, and space that had never been used before for DNA analysis. No DNA work with elephants had taken place in the laboratories before the primary complete mammoth mtDNA sequence was determined. We have not found a single case of contamination by nonmammoth mtDNA (human or animal) in PCR products or clones in Moscow or in UMASS MS PCR products. Direct sequencing of PCR products from the mammoth specimen showed a high quality of chromatograms comparable to sequencing of cloned DNA (Figure S5). In all cases, the replication of sequencing was performed from different PCR products and the PCR clones. As expected, the cloned mtDNA fragments occasionally contained random mutations, transitions (A!G/T!C or C!T/ G!A) corresponding to those documented previously as common type I and type II mutations in ancient DNA. The type II mutations (C!T/G!A) were predominant (.70%). These mutations were easily discriminated since they were absent in sequences of total PCR products and other clones. As a final step, the mammoth mitochon-drial genome sequences were compared with GenBank sequences of other mitochondrial genomes. As we report in our phylogenetic analysis, the comparison showed the closest similarity of the mammoth sequences toL. africanaandE. maximusmtDNA sequences, even when the closest relative (Sirenia) was included in the comparison. The distribution and ratio of synonymous to non-synonymous substitutions in the mammoth sequence is similar to that found inElephasandLoxodontalineages and showed a high prevalence of synonymous mutations. No nucleotide mismatches were found in multiple overlapped regions determined from independent PCR fragments (refer to earlier section ‘‘Mammoth DNA’’). A muscle specimen was used for DNA extraction. This type of cell tissue is particularly enriched with mitochondria, which provides a relatively high proportion of mitochondrial versus nuclear DNA.
Taken together, the methods and results indicate that contami-nation by exogenous DNA, numt sequences, or sequencing errors are unlikely to be a factor in our study of mammoth DNA and that the mammoth mtDNA sequence is authentic.
Phylogenetic analysis.A multiple alignment of the seven complete mitochondrial genomes was made using the MUSCLE program [27] and checked against amino acid sequence and RNA secondary
structure whenever possible. Due to an uncertain alignment in the variable region of the control region, this part of the genome (;500 bp) was excluded from all analyses. The resulting alignment (referred to as the complete mitochondrial alignment throughout the text) was used for all of our phylogenetic and comparative analyses. To estimate synonymous and nonsynonymous nucleotide divergence, a concatenated alignment of all protein-coding genes was used, and dn and ds values were estimated with the Pamilo-Bianchi-Li method as implemented in MEGA [28]. All analyses performed with the complete mitochondrial alignment were repeated using the con-catenated alignment of all protein and RNA genes (discarding;1,000 bp of nontranscribed sequence), and all of the results remained qualitatively unchanged.
To reconstruct the tree topology, parsimony and neighbor-joining methods were used as implemented in MEGA [28] with default parameters and 10,000 bootstrap replicates [28–31]. Bayesian inference of phylogeny was done with MrBayes [29] with two different prior models: the General Time Reversible model [28,29] and the HKY model [28,29], which estimates fewer rate parameters. Both models were run assuming a gamma-distribution of substitution rates across sites for 1 million iterations (mcmc ngen¼1000000 in MrBayes). Phylogenetic trees using individual gene sequences were tested with Bayesian inference set to the HKY model (Table S3). An ML ratio test was performed for ML values obtained for the possible topologies of the three Elephantinae species. The topology withM. primigenius and E. maximus as sister species had a log ML of
42440.629, compared with 42465.549 and 42456.866 for the topology linkingE. maximuswithL. africanaandM. primigeniuswithL. africana,respectively (p ,0.01; ML ratio test). The log ML scores reported here are averages of log ML scores obtained for 10,000,000 iterations of the BEAST [30] program and ran under the HKY [28,29] model with set tree topologies.
The molecular clock was tested with the likelihood ratio test, using the log likelihood scores obtained with the baseml program in PAML [32] when the dataset was analyzed with the assumption of no molecular clock (clock¼0 in baseml) and a local clock that tested the difference between the species in question (clock¼2 in baseml). To estimate the branch length for synonymous and nonsynonymous substitutions, the branches of interest were assumed to have different dn/ds ratios (model¼2 in codeml) and an absence of a molecular clock (clock ¼ 0 in codeml). To estimate the divergence time of M. primigenius,a heuristic rate smoothing procedure for ML estimates [16] was used as implemented in PAML [32]. The number of synonymous and nonsynonymous substitutions (Table S4) was obtained by parsimony using the African elephant as the outgroup for the mammoth–Asian elephant comparison and dugong as the outgroup for the mammoth–African elephant and Asian–African elephant comparisons without correcting for multiple substitutions and with the assumption that the outgroup accurately resembles the ancestral state. These results yielded were quantitatively very similar to those obtained with a ML approach that corrected for multiple substitutions (unpublished). Control files for all stand-alone programs ran here and other methodological materials are available on request.
Supporting Information
Figure S1.Mammoth Specimen Found in Siberia
(A) Restored exhibit of mammoth Enmyn leg found in the Enmynveem River valley, Chukotka, northeastern Siberia. (B) The geographic location of the find is designated by the red dot on the map.
Found at DOI: 10.1371/journal.pbio.0040073.sg001 (2.3 MB PDF).
Figure S2. Electrophoresis Analysis of the PCR Products Used for Sequencing of M. primigeniusMitochondrial Genome (‘‘MOS Mam-moth mtDNA’’)
A and B agarose gel panels.
The negative controls are shown in (A). * designates the area of oligonucleotide primer dimers formed in PCR.
Found at DOI: 10.1371/journal.pbio.0040073.sg002 (631 KB PDF).
Figure S3. Electrophoresis Analysis of the PCR Products Used for Sequencing ofM. primigeniusMitochondrial Genome (‘‘UM Mammoth mtDNA’’)
A–D agarose gel panels. * designates lines with low amount of PCR products.
Figure S4. Extreme Heteroplasmy in Hypervariable Region HVR (VNTR Region) in the Control Region of Mitochondrial Genome of
M. primigenius
(A) Electrophoresis of PCR products from two DNA extracts (m1 and m22) and (B) corresponding PCR clones with VNTR region mtDNA insertions showed variability in their length. (C) Nucleotide sequen-ces of cloned PCR products with VNTR. The sequence for the longest VNTR was incorporated in a reported complete sequence of M. primigenius.
Found at DOI: 10.1371/journal.pbio.0040073.sg004 (455 KB PDF).
Figure S5. Sequencing Electrophoresis Data for the Mitochondrial Genome of M. primigenius with High-Quality Chromatograms of Direct Sequencing of PCR Products, in Comparison with the Cloned PCR Fragments
Three mtDNA regions are shown: (A) L11-H11, (B) L17-H17, and (C) L22-H22. Lines 1 and 2 (A) and line 1 (B and C) from the bottom are the PCR products. Other lines are cloned sequences determined from opposite strands. The rare mutations are observed in cloned sequences but not in direct PCR product sequences.
Found at DOI: 10.1371/journal.pbio.0040073.sg005 (503 KB PDF).
Figure S6. Comparison of M. primigenius mtDNA Sequences in Individual Clones and Direct PCR Products
The rare, random ‘‘ancient DNA’’ mutations were identified in cloned sequences. No sequences with identical series of mutations were found in individual clones, providing evidence that the PCR products were obtained from the significant amount of original DNA templates. Mutations were confirmed by sequencing of both DNA strands. The G!A and C!T mutations (type II mutations) were prevalent, as is expected for ancient‘‘DNA’’modifications. Found at DOI: 10.1371/journal.pbio.0040073.sg006 (22 KB PDF).
Table S1.Primer Oligonucleotides and Predicted PCR Fragments Used for Sequencing of Complete Mitochondrial Genome of M. primigenius, E. maximus,andL. africana
Redundant primer oligonucleotides were used to amplify mammoth DNA. The sequences of mitochondrial genomes ofE. maximusandL. africanawere determined using both long-range PCR fragments and short PCR fragments.
Found at DOI: 10.1371/journal.pbio.0040073.st001 (30 KB DOC).
Table S2. Different Types of Substitutions Revealed by Pairwise Comparisons of Elephantinae Genomes
Number of synonymous and nonsynonymous substitutions calculated with the modified Nei-Gojobory method as implemented in MEGA [28]; the results were independent of the transition/transversion ratio. Found at DOI: 10.1371/journal.pbio.0040073.st002 (25 KB DOC).
Table S3. Bayesian Phylogeny Inference [29] of Elephantinae Using Single Mitochondrial Protein Coding and rRNA Genes
Posterior probabilities are shown in parentheses.
Found at DOI: 10.1371/journal.pbio.0040073.st003 (26 KB DOC).
Table S4. Lineage-Specific Substitutions Inferred by Pairwise Comparisons of Elephantinae Genomes and Polarized with One Outgroup
We used the sequences ofE. maximusandL. africanadetermined in this study for these comparisons. Pairwise comparisons of Elephantinae species using a single outgroup to polarize substitutions suggested that theM. primigenius–E. maximusclade evolves faster than theL. africanalineage in both synonymous and nonsynonymous sites.
Found at DOI: 10.1371/journal.pbio.0040073.st004 (26 KB DOC).
Table S5. Nucleotide Diversity Inferred by Pairwise Comparisons of DifferentM. primigeniusmtDNA Sequences
Sequences are reported in the following studies: DQ316067 (present study), NC_007596 [20], D83047 [18], and D50841–D50842 [19]. Found at DOI: 10.1371/journal.pbio.0040073.st005 (31 KB DOC).
Table S6. Genome-Specific Nonsynonymous and Synonymous Substitutions Inferred by Pairwise Comparisons of Protein-Coding Genes from Two M. primigenius Genomes (DQ316067 versus NC_007596) and Polarized withE. maximus(DQ316068) Sequence A large number of nonsynonymous substitutions was observed in the
ND2gene (seven nonsynonymous versus two synonymous mutations in NC_007596 accumulated in a short;360-bp region; whereas the DQ316067 sequence determined in this study had zero nonsynon-ymous and one synonnonsynon-ymous substitution in the same gene). Found at DOI: 10.1371/journal.pbio.0040073.st006 (38 KB DOC).
Table S7. Genome-Specific Substitutions Inferred by Pairwise Comparison of Two M. primigenius Genomes (DQ316067 versus NC_007596) and Polarized withE. maximus(DQ316068) Sequence While the C!T and G!A substitutions may be a sign of ancient DNA modification (most frequent type II mutations), they represent also real polymorphisms. The NC_007596 mammoth genome shows more of these substitutions, suggesting that a few of these substitutions may have occurred after death of the sampled mammoth; however, this difference is not statistically significant (Fisher’s exact testp.0.05).
Found at DOI: 10.1371/journal.pbio.0040073.st007 (25 KB DOC).
Accession numbers
The GenBank (http://www.ncbi.nlm.nih.gov) accession numbers for the complete mitochondrial genome sequences determined in this paper are E. maximus(DQ316068), L. africana (DQ316069), and M. primigenius(DQ316067). The GenBank accession numbers for other
M. primigenius mtDNA sequences are D83047 [18], D50841–D50842 [19], and NC_007596 [20]. The GenBank accession numbers for mitochondrial genomes of E. maximus and L. africana [33] are NC_005129 and NC_000934, respectively, and forD. dugonandP. capensisare NC_003314 and NC_004919, respectively.
Acknowledgments
We thank the Natural History Museum, North-Eastern Research Center, Far Eastern Branch of the Russian Academy of Sciences for photographic material of M. primigenius leg, V. A. Nikishina for artwork and technical support, Y.B. Yurov, G. Dvoryanchikov, N. Riazanskaya and T. Kolesnikova for technical support, K. Mehren and C. Gray for elephant specimens, and V. Y. Solovyev for help with artwork of animal images.
Author contributions. EIR conceived and designed the experi-ments. YKM and EIR designed oligonucleotides. EIR, YKM, and APG performed the experiments. EIR, YKM, and FAK collected data and analyzed the data. BAM, MVD, and IC contributed reagents/materials/ analysis tools and performed some experiments. EIR, FAK, APG and YKM wrote the paper.
Funding. FAK is supported by the NSF Graduate Research Fellowship.
Competing interests.The authors have declared that no competing
interests exist. &
References
1. Maglio VJ (1973) Origin and evolution of Elephantidae. Trans Am Phil Soc 63: 1–149.
2. Valente A (1983) Hair structure of the wooly mammoth, Mammuthus primigenius and the modern elephants, Elephas maximus and Loxodonta africana. J Zool (London) 199: 271–274.
3. Shoshani J, Golenberg EM, Yang H (1998) Elephantidae phylogeny: Morphological versus molecular results. Acta Theriol (Suppl 5): 89–122. 4. Lowenstein JM, Sarich VM, Richardson BJ (1981) Albumin systematics of
the extinct mammoth and Tasmanian wolf. Nature 291: 409–411. 5. Vartanyan SL, Garutt VE, Sher AV (1993) Holocene dwarf mammoths from
Wrangel Island in the Siberian Arctic. Nature 362: 337–340.
6. Yang H, Golenberg EM, Shoshani J (1996) Phylogenetic resolution within
the Elephantidae using fossil DNA sequence from American mastodon
(Mammut americanum)as an outgroup. Proc. Natl. Acad. Sci. USA 93: 1190– 1194.
7. Hagelberg E, Thomas MG, Cook CE Jr., Sher AV, Baryshnikov GF, et al. (1994) DNA from ancient mammoth bones. Nature 370: 333–334. 8. Thomas MG, Hagelberg E, Jone HB, Yang Z, Lister AM (2000) Molecular
and morphological evidence on the phylogeny of the Elephantidae. Proc Biol Sci 267: 2493–2500.
9. Debruyne R, Barriel V, Tassy P (2003) Mitochondrial cytochrome b of the Lyakhov mammoth (Proboscidea, Mammalia): New data and phylogenetic analyses of Elephantidae. Mol Phylogenet Evol 26: 421–434.
11. Derenko M, Malyarchuk B, Shields GF (1997) Mitochondrial Cytochrome b sequence from a 33000 year-old woolly mammoth(Mammuthus primigenius). Anc Biomol 1: 149–153.
12. Lozhkin AV, Pavlov GF, Ryabchun VK, Gorbachev AL, Zadal’skii SV, et al. (1988) A new mammoth discovery in Chukotka. Doklady Akademii Nauk 302: 1440–1444.
13. Gilbert MT, Willerslev E, Hansen AJ, Barnes I, Rudbeck L, et al. (2003) Distribution patterns of postmortem damage in human mitochondrial DNA. Am J Hum Genet 72: 32–47.
14. Paabo S, Poinar H, Serre D, Jaenicke-Despres V, Hebler J, et al. (2004) Genetic analyses from ancient DNA. Annu Rev Genet 38: 645–679. 15. Hofreiter M, Jaenicke V, Serre D, Haeseler AA, Paabo S (2001) DNA
sequences from multiple amplifications reveal artifacts induced by cytosine deamination in ancient DNA. Nucleic Acids Res 29: 4793–4799. 16. Murata Y, Nikaido M, Sasaki T, Cao Y, Fukumoto Y, et al. (2003)
Afrotherian phylogeny as inferred from complete mitochondrial genomes. Mol Phylogenet Evol 28: 253–260.
17. Yang Z (2004) A heuristic rate smoothing procedure for maximum likelihood estimation of species divergence times. Acta Zoologica Sinica 50: 645–656.
18. Ozawa T, Hayashi S, Mikhelson VM (1997) Phylogenetic position of mammoth and Steller’s sea cow within Tethytheria demonstrated by mitochondrial DNA sequences. J Mol Evol 44: 406–413.
19. Noro M, Masuda R, Dubrovo IA, Yoshida MC, Kato M (1998) Molecular phylogenetic inference of the woolly mammoth Mammuthus primigenius,
based on complete sequences of mitochondrial cytochrome b and 12S ribosomal RNA genes. J Mol Evol 46: 314–326.
20. Krause J, Dear PH, Pollack JL, Slatkin M, Spriggs H, et al. (2005) Multiplex amplification of the mammoth mitochondrial genome and the evolution of Elephantidae. Nature: Epub ahead of print.
21. Poinar HN, Schwarz C, Qi J, Shapiro B, Macphee RD, et al. (2005) Metagenomics to paleogenomics: Large-scale sequencing of mammoth DNA. Science: Epub ahead of print.
22. Nyakaana S, Arctander P, Siegismund HR (2002) Population structure of the African savannah elephant inferred from mitochondrial control region sequences and nuclear microsatellite loci. Heredity 89: 90–98.
23. Fernando P, Pfrender M, Encalada S, Lande R (2000) Mitochondrial DNA variation, phylogeography and population structure of the Asian elephant. Heredity 84:: 362–372.
24. Vidya TN, Fernando P, Melnick DJ, Sukumar R (2005) Population differentiation within and among Asian elephant (Elephas maximus)
populations in southern India. Heredity 94: 71–80.
25. Cooper A, Lalueza-Fox C, Anderson S, Rambaut A, Austin J, et al. (2001) Complete mitochondrial genome sequences of two extinct moas clarify ratite evolution. Nature 409: 704–707.
26. Roca A, Georgiadis N, O’Brien S (2005) Cytonuclear genomic dissociation in African elephant species. Nat Genet 37: 96–100.
27. Edgar RC (2004) MUSCLE: Multiple sequence alignment with high accuracy and high throughput. Nucleic Acids Res 32: 1792–1797.
28. Kumar S, Tamura K, Nei M (2004) MEGA3: Integrated software for Molecular Evolutionary Genetics Analysis and sequence alignment. Brief Bioinform 5: 150–163.
29. Ronquist F, Huelsenbeck JP (2003) MrBayes 3: Bayesian phylogenetic inference under mixed models. Bioinformatics 19: 1572–1574.
30. Drummond AJ, Rambaut A (2003) BEAST, version 1.03 [computer program]. Available: http://evolve.zoo.ox.ac.uk/beast. Accessed 11 January 2006.
31. Ronquist F (2004) Bayesian inference of character evolution. Trends Ecol Evol 19: 475–481.
32. Yang Z (1997) PAML: A program package for phylogenetic analysis by maximum likelihood. Comput Appl Biosci 13: 555–556.
33. Hauf J, Waddell PJ, Chalwatzis N, Joger U, Zimmermann FK (2000) The complete mitochondrial genome sequence of the African elephant