www.nat-hazards-earth-syst-sci.net/13/1929/2013/ doi:10.5194/nhess-13-1929-2013
© Author(s) 2013. CC Attribution 3.0 License.
Natural Hazards
and Earth System
Sciences
Geoscientiic
Geoscientiic
Geoscientiic
Geoscientiic
A method for multi-hazard mapping in poorly known volcanic
areas: an example from Kanlaon (Philippines)
M. Neri1, G. Le Cozannet2, P. Thierry2, C. Bignami3, and J. Ruch4
1Istituto Nazionale di Geofisica e Vulcanologia, Sezione di Catania, Catania, Italy 2Bureau de Recherches G´eologiques et Mini`eres, Orl´eans, France
3Istituto Nazionale di Geofisica e Vulcanologia, Centro Nazionale Terremoti, Rome, Italy 4Dipartimento di Scienze, Universit`a Roma Tre, Rome, Italy
Correspondence to:M. Neri ([email protected])
Received: 11 December 2012 – Published in Nat. Hazards Earth Syst. Sci. Discuss.: – Revised: 25 May 2013 – Accepted: 29 May 2013 – Published: 1 August 2013
Abstract.Hazard mapping in poorly known volcanic areas is complex since much evidence of volcanic and non-volcanic hazards is often hidden by vegetation and alteration. In this paper, we propose a semi-quantitative method based on haz-ard event tree and multi-hazhaz-ard map constructions developed in the frame of the FP7 MIAVITA project. We applied this method to the Kanlaon volcano (Philippines), which is char-acterized by poor geologic and historical records. We com-bine updated geological (long-term) and historical (short-term) data, building an event tree for the main types of haz-ardous events at Kanlaon and their potential frequencies. We then propose an updated multi-hazard map for Kanlaon, which may serve as a working base map in the case of fu-ture unrest. The obtained results extend the information al-ready contained in previous volcanic hazard maps of Kan-laon, highlighting (i) an extensive, potentially active∼5 km long summit area striking north–south, (ii) new morpho-logical features on the eastern flank of the volcano, prone to receiving volcanic products expanding from the summit, and (iii) important riverbeds that may potentially accumulate devastating mudflows. This preliminary study constitutes a basis that may help local civil defence authorities in mak-ing more informed land use plannmak-ing decisions and in an-ticipating future risk/hazards at Kanlaon. This multi-hazard mapping method may also be applied to other poorly known active volcanoes.
1 Introduction
A hazard map is one of the most useful decision-making sup-port tools for risk management in volcanic areas (Newhall and Hoblitt, 2002). It is commonly used by authorities to provide specific recommendations to regulate human settle-ment and as a guideline for land use planning. The term “haz-ard maps” sometimes refers to a spatial representation of the maximum extent of a given adverse event, but this decision-support tool is more commonly called a “susceptibility map”. In this paper, we define hazard as the probability that adverse events reach a given intensity (i.e. destructive potential) over a given period of time (Table 1). In this sense, hazard is a synonym of “threat”, and it can exceed a given threshold (1) either because adverse events of rather moderate intensity can occur frequently, (2) or because the probability of occur-rence of adverse events is lower and their intensity higher. Hazard assessment thus requires the evaluation of two prop-erties of adverse events: their intensity and their probability of occurrence (e.g. Thierry et al., 2008). Similar definitions are commonly used in the field of risk assessment (e.g. Vec-chia, 2001; Douglas, 2007; Neri et al., 2008; Marzocchi et al., 2009; Crisci et al., 2010; Vicari et al., 2011) and elsewhere (IPCC, 2012).
Table 1.Key vocabulary used in this paper and associated definitions.
Term Definition used in this study Example
Adverse event Event likely to cause damage. pyroclastic density current, lahars, tephra fall, etc.
Phenomenon One of the forms under which static vertical loading on roofs, chemical the adverse event may cause damage. aggression on crops caused by tephra fall, etc.
Physical effects Each type of phenomenon is characterized by cinematic impact expressed in J, one or more intrinsic physical effects pressure or loading in Pa, thickness in m, expressed through physical units. peak ground acceleration in ms−2, etc.
Physical intensity Destructive potential of an adverse event. water height, velocity and direction of a tsunami.
Physical intensity Scale defined from physical values that express scale for load: 1–3 kPa low intensity, scale the magnitude class of a physical effect (Table 2). from 3 to 5 kPa moderate intensity, etc.
Frequency and The estimated return period between two a centennial event has a probability return period adverse events of the same type and intensity of 0.01 of occurring each year
in a given sector is defined as the inverse of its probability of occurrence each year. With this approach, return periods are classified in a few bins, here called frequency classes (Table 3).
Hazard The probability that adverse events reach Threat indexes associated with recommendations a given intensity over a period of time. for the prevention of risks (see Table 5).
different kinds of hazards (e.g. Grunthal et al., 2006). This issue is particularly acute in volcanic areas, since they may be affected by numerous volcanic and non-volcanic adverse events (Fig. 1). Indeed, phreatic and magmatic eruptions may produce tephra fall, pyroclastic density currents, lava flows, blasts, sector collapses, gas emissions, lahars, land-slides, rockfalls, floods, earthquakes, coseismic and aseismic faulting, and, in some cases, tsunamis. Each of these adverse events can be characterized by one or several phenomena po-tentially causing various kinds of physical effects (Fig. 1). For example, a single adverse event like tephra fall may cause damages by several phenomena: static vertical loading on roofs, burial of roads, dust concentration, and chemical ag-gression to crops. The corresponding physical effects can be expressed through various physical units (e.g. Pa, pressure; m, thickness; ppmv, dust concentration; pH, acidity), and each kind of exposed asset can be impacted in various ways, so that a standardized common intensity scale is particularly difficult to define.
In addition, volcanic eruptions are not the only cause of damage in volcanic areas. For example, lahars and mudflows may not only occur during volcanic unrest, but also may be triggered by heavy rains, months after the eruption, as at Pinatubo in 2001 (Hayes et al., 2002) and more recently at Merapi volcano in 2010 (Lavigne et al., 2011; Bignami et al., 2013). On Mount Cameroon, landslides that are not re-lated to contemporary volcanic activity are a major concern (Ayonghe et al., 2004). On Etna and Stromboli, several zones are affected by landslides at various scales, triggered by
vol-Fig. 1.Scheme showing an example of factors to take into account for hazard mapping according to the proposed method.
canic activities and/or by seismicity (Acocella et al., 2006b; Neri et al., 2008; Solaro et al., 2010; Barreca et al., 2013). In a multi-hazard assessment procedure, it is thus necessary to equally consider the adverse events that may occur during both the rest and unrest periods.
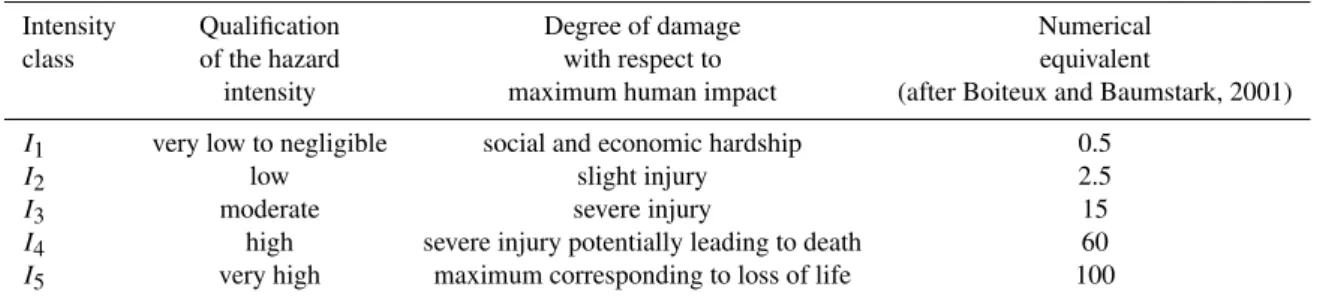
Table 2.Intensity baseline for all adverse events related to human life (adapted from Stieltjes, 1997).
Intensity Qualification Degree of damage Numerical class of the hazard with respect to equivalent
intensity maximum human impact (after Boiteux and Baumstark, 2001)
I1 very low to negligible social and economic hardship 0.5
I2 low slight injury 2.5
I3 moderate severe injury 15
I4 high severe injury potentially leading to death 60
I5 very high maximum corresponding to loss of life 100
Table 3.Frequency baseline for all adverse events.
Frequency Qualification Return period for the type Quantification of Index used for class of the event of activity or phenomenon the phenomenon the threat matrices
frequency (order of magnitude) frequencyQf (QF =100·Qf)
F0 very low to negligible 5000–10 000 yr 10−4 0.01
F1 very low 1000–5000 yr 2×10⁻⁴ 0.02
F2 low 500–1000 yr 10−3 0.1
F3 moderate 100–500 yr 2×10⁻³ 0.2
F4 high 50–100 yr 10−2 1
F5 very high 10–50 yr 2×10⁻² 2
F6 quasi-permanent 1–10 yr 10−1 10
example of how a multi-hazard map can be drawn consider-ing several types of adverse events: in their studies, six vol-canic and three other geological adverse events were con-sidered. While their approach enables drawing multi-hazard maps for a volcano where relatively few eruptive styles are known (Zogning, 1988), a structured procedure is required for more complex volcanoes with numerous and very dif-ferent possible eruptive scenarios. To this end, Newhall and Hoblitt (2002) proposed building event trees, which have been applied for example by Marzocchi et al. (2004) to Vesu-vius, and then used by Neri et al. (2008) and Mart`ı et al. (2008) to provide a volcanic hazard map at Vesuvius and Teide-Pico Viejo, respectively. Finally, a Bayesian event tree to estimate volcanic hazard (BET VH) has recently been published by Marzocchi et al. (2010) and applied at Campi Flegrei volcanic field, in southern Italy (Selva et al., 2010). This method calculates the probability of any kind of long-term adverse event for well-known volcanoes.
The goal of this paper is to provide an applicable haz-ard mapping method in volcanic areas characterized by a minimum level of geological data and historical records. The method (Sect. 2) combines the Thierry et al. (2008) multi-hazard mapping approach and the Neri et al. (2008) event-tree-based method. We applied the new designed semi-quantitative method to the active Kanlaon volcano (Negros island, south-east Philippines), characterized by frequent phreatic eruptions during the past 120 yr (Sect. 3). We pro-pose (1) a simplified event tree for future unrest episodes at Kanlaon implemented by new morphostructural data, (2) an
upgrade of the existing hazard maps, and finally (3) a new multi-hazard map. In Sect. 5, we discuss the relevance and limitation of our approach, the implications for people at risk at Mount Kanlaon and the potential transportability of the approach to other poorly known volcanoes.
2 Method
This part explains the principle of the proposed hazard map-ping method.
2.1 Definition and use of reference intensity and frequency scales
Hazard assessment implies choosing a parameter that may exceed a certain threshold over a given period of time (Dou-glas, 2007). It is generally based on expert opinion, as well as empirical and physical models (Vecchia, 2001). As raised in the introduction, the main difficulty here is that many adverse events and related phenomena are characterized by very dif-ferent parameters. For example, a building can be affected by peak ground acceleration induced by earthquakes (Barreca et al., 2013), pressure on its roof induced by tephra fall may also lead to its collapse (Spence et al., 2005). Agriculture may be impacted by tephra fall rather more than other fac-tors, while, notwithstanding more destructive adverse events, human health may be affected by SO2concentration in the
assessment, the different parameters cannot be readily pro-jected onto a unique baseline built on a single physical pa-rameter. Hence, a key step of multi-hazard mapping is to de-fine common intensity and frequency reference baselines to evaluate the various hazards (Tables 2 and 3; Kappes et al., 2012).
Following the principles of the European Macroseismic Scale (EMS 1998), we propose here a reference intensity baseline that relates the intensity of phenomena, whatever their nature, to their average expected impact on human be-ings (here adapted from Boiteux and Baumstark, 2001). The principle of our intensity baseline is to refer to the potential destructive effects of the respective kind of adverse events. For example, experts can refer to this baseline as follows: knowing the average quality of buildings in a given volcanic area such as Mount Cameroon and considering the charac-teristics of buildings in the areas, it can be expected that a pressure of less than 1 kPa induced by tephra fall (Spence et al., 2005; Thierry et al., 2008) or an earthquake of magni-tude V–VI on the EMS 1998 scale would cause light damage to many buildings. Therefore, both phenomena would cor-respond to the same intensity classI2(low intensity) on the
scale in Table 2. Conversely, a static load exceeding 2 kPa will lead to roof collapses triggering severe injuries and pos-sible deaths. In this second case, the intensity class will be I4orI5(high or very high intensity) In practice, the relation
between physical effect and intensity is site-dependent due to local vulnerability and must be set up for each volcanic area: for example, on a region where many buildings’ roofs are made of concrete, the same intensity classI3could
cor-respond to a static pressure of tephra of 4–6 kPa.
The frequency baseline used in this paper is presented in Table 3. Similarly to the approach in Thierry et al. (2008), experts can refer to historical or geological evidence or any other source of information to provide their best guesses of frequency of adverse events according to Table 3. The rel-atively coarse resolution of the frequency baseline has been constructed in a way that the return period of each eruptive mode of the volcano can be approximately appraised, even if limited knowledge of the volcano’s history is available.
Finally, cross-referencing the intensity and the frequency of events leads to defining a common threat matrix (Table 4), which allows building a hazard scale corresponding to prac-tical recommendations for human settlement (Table 5). Al-though referring to a common intensity scale, we do not inte-grate any local information about the vulnerability of assets or their exposure. Therefore, we evaluate neither risk (as a combination of hazard and vulnerability of exposed assets) nor individual risk (as defined by Marzocchi and Woo, 2009). Here, the only purpose of analysing the potential impact of phenomena is to enable reference to a common metrics, available for all types of phenomena. Therefore, the threat index provided here is a proxy of the hazard and does not integrate the actual vulnerability of assets at risk.
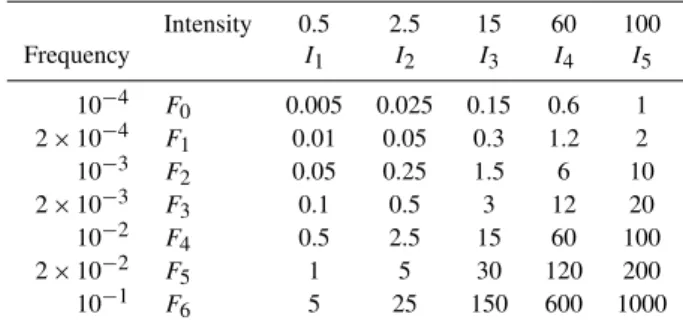
Table 4.Threat matrix obtained crossing intensity and frequency baselines; values indicate possible thresholds for recommendation options (see Table 5): in this illustrative example, 0.005–0.05: neg-ligible hazard; 0.1–3: moderate hazard; 5–60: high hazard;>100: very high hazard.
Intensity 0.5 2.5 15 60 100 Frequency I1 I2 I3 I4 I5
10−4 F
0 0.005 0.025 0.15 0.6 1 2×10⁻⁴ F
1 0.01 0.05 0.3 1.2 2 10−3 F
2 0.05 0.25 1.5 6 10 2×10⁻³ F
3 0.1 0.5 3 12 20
10−2 F
4 0.5 2.5 15 60 100
2×10⁻² F
5 1 5 30 120 200
10−1 F
6 5 25 150 600 1000
2.2 Knowledge collection at a target volcano and event tree construction
We start the actual analysis of the volcanic site by collect-ing knowledge on the studied volcano through field studies and analysis of historical events (Fig. 2). This step is used to determine and characterize reference eruptions of the vol-cano, e.g. in terms of explosivity (Newhall and Self, 1982) and/or eruption rate, duration and volume of the lava flows (in the case of mainly effusive volcanoes; Crisci et al., 2010; Vicari et al., 2011). Then, event trees can be created and used as a support tool to structure the quantification of each phe-nomenon and their frequency of occurrence (Newhall and Hoblitt, 2002).
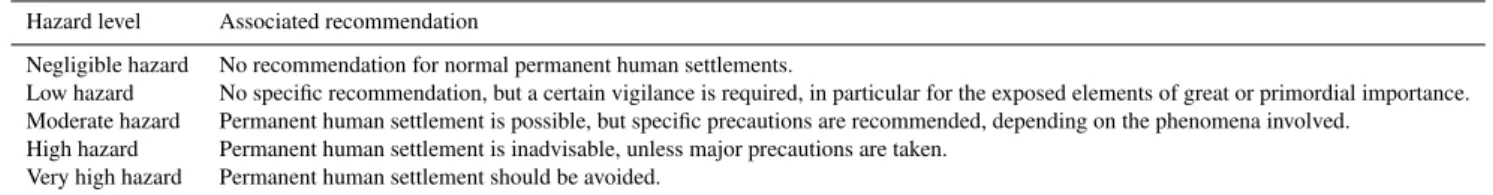
Table 5.Example of possible generic recommendations associated with each hazard level.
Hazard level Associated recommendation
Negligible hazard No recommendation for normal permanent human settlements.
Low hazard No specific recommendation, but a certain vigilance is required, in particular for the exposed elements of great or primordial importance. Moderate hazard Permanent human settlement is possible, but specific precautions are recommended, depending on the phenomena involved.
High hazard Permanent human settlement is inadvisable, unless major precautions are taken. Very high hazard Permanent human settlement should be avoided.
geological evidence, historical records, as well as possible numerical modelling.
2.3 Event tree output, intensity and multi-hazard mapping
The purpose of using the event tree is to provide a frame-work to estimate the frequencies and intensities of phenom-ena associated with the various kinds of eruption modes. In the next step of the method, those frequencies are calculated using the probabilities inserted in the event tree. Given an eruptive mode (i.e. at the latest node of the event tree), the expected intensities of each phenomenon corresponding to each adverse event must then be mapped. Here, experts may similarly use their best guesses, referring to geological and geomorphological evidence (e.g. topography location of po-tential eruptive vents, etc.), historical reports or the behaviour of similar volcanoes. At this step, sectors affected by eruptive events may be determined to take into account topographical or wind (for gas and tephra fall) constraints that might affect the hazard map (Neri et al., 2008).
For each reference eruption, a threat index corresponding to each type of eruption and each phenomenon is then cal-culated at each location by multiplying the frequency and intensity indexes (Fig. 2). Mapping the threat index on the sectors defined in the previous phase may provide a first set of threat maps, e.g. one map per adverse event. In practical terms, as a consistent scale has been used for all types of ad-verse events, a multi-hazard map can be produced by simply keeping the maximum threat index at each location. Choos-ing the maximum index here is therefore equivalent to se-lecting the prevention option (Table 5) according to the type of adverse event causing the most important threat at each location.
This multi-hazard map can finally be improved using ge-ological structural and topographical evidence, field obser-vations and modelling (e.g. lahar flows). Lastly, a step that involves the local authorities is to define recommendations associated with each level of hazard (Fig. 2).
3 Application of the model to Kanlaon volcano
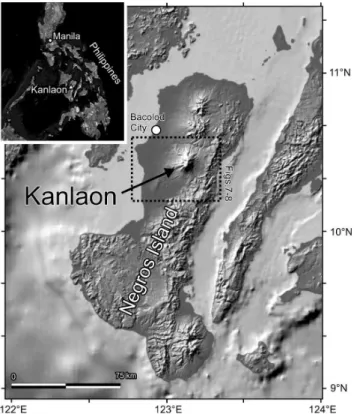
In the following, we apply and test the proposed semi-quantitative method to the construction of a multi-hazard map on Kanlaon volcano (Negros island, Philippines, Fig. 3). 3.1 Geological and morphostructural update at
Kanlaon
The stratovolcano Kanlaon is one of the 23 active volcanoes belonging to the Philippine archipelago (Rae et al., 2004). The Negros volcanic belt, which is part of the Philippine Microplate, extends ∼260 km in N–S direction and hosts six main volcanic edifices, four of which are active and located on Negros island (Fig. 3). One of these, Kanlaon
Fig. 3.Location of the study area.
(2435 m), has a calc-alkaline andesite and basaltic andesite composition (Von Biedersee and Pichler, 1995; Solidum et al., 2003); it is located approximately 33 km SE of Bacolod City (511 820 inhabitants according to the 2010 census), and is surrounded by several minor towns (more than 300 000 in-habitants in all within the volcano’s vicinity).
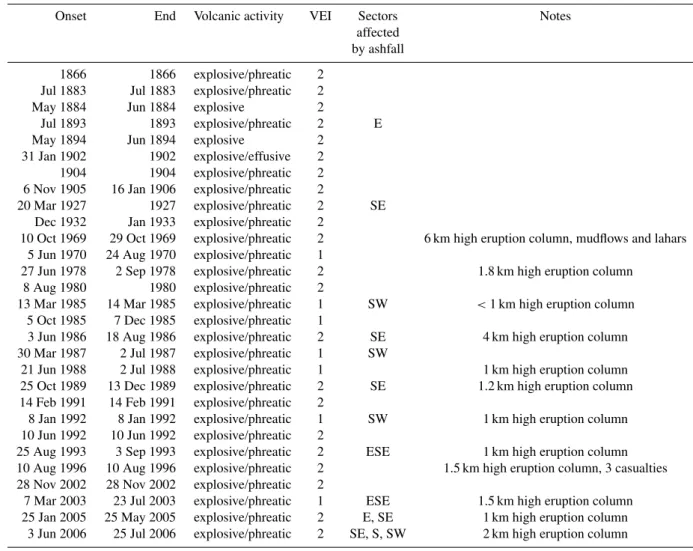
The present volcanic activity of Kanlaon (Table 6) is characterized by (1) frequent phreatic and phreatomagmatic eruptions (VEI = 1–2) with 29 events recorded since 1866 (Simkin et al., 1981; Von Biedresee and Pichler, 1995; Siebert et al., 2010), (2) effusive and Strombolian eruptions, the only known event occurred in 1902 (VEI=2), and (3) explosive eruptions emplacing pyroclastic flows (VEI≥2), the last took place<2.5×10²yr ago on the south western flank of the volcano (Siebert et al., 2010).
To improve our geologic knowledge of Kanlaon, we stud-ied the volcanic succession through field observations, re-mote sensing data with a 15 m resolution LANDSAT 7 im-age (2003), and a 2.5 m resolution stereo pair from the Panchromatic Remote-sensing Instrument for Stereo Map-ping (PRISM) on board the Japanese satellite ALOS (Ad-vanced Land Observing Satellite, 2009). This image pair, ac-quired in December 2009, has been used to derive a new dig-ital elevation model (DEM) with 10 m pixel resolution on ground. The results allow distinguishing two main angular unconformities bounding three main groups of stratigraphic units.
Table 6.Historical eruptive activity of Mt Kanlaon volcano (modified after Siebert et al., 2010, and reports available at http://www.phivolcs. dost.gov.ph).
Onset End Volcanic activity VEI Sectors Notes affected
by ashfall
1866 1866 explosive/phreatic 2 Jul 1883 Jul 1883 explosive/phreatic 2 May 1884 Jun 1884 explosive 2
Jul 1893 1893 explosive/phreatic 2 E May 1894 Jun 1894 explosive 2
31 Jan 1902 1902 explosive/effusive 2 1904 1904 explosive/phreatic 2 6 Nov 1905 16 Jan 1906 explosive/phreatic 2
20 Mar 1927 1927 explosive/phreatic 2 SE Dec 1932 Jan 1933 explosive/phreatic 2
10 Oct 1969 29 Oct 1969 explosive/phreatic 2 6 km high eruption column, mudflows and lahars 5 Jun 1970 24 Aug 1970 explosive/phreatic 1
27 Jun 1978 2 Sep 1978 explosive/phreatic 2 1.8 km high eruption column 8 Aug 1980 1980 explosive/phreatic 2
13 Mar 1985 14 Mar 1985 explosive/phreatic 1 SW <1 km high eruption column 5 Oct 1985 7 Dec 1985 explosive/phreatic 1
3 Jun 1986 18 Aug 1986 explosive/phreatic 2 SE 4 km high eruption column 30 Mar 1987 2 Jul 1987 explosive/phreatic 1 SW
21 Jun 1988 2 Jul 1988 explosive/phreatic 1 1 km high eruption column 25 Oct 1989 13 Dec 1989 explosive/phreatic 2 SE 1.2 km high eruption column 14 Feb 1991 14 Feb 1991 explosive/phreatic 2
8 Jan 1992 8 Jan 1992 explosive/phreatic 1 SW 1 km high eruption column 10 Jun 1992 10 Jun 1992 explosive/phreatic 2
25 Aug 1993 3 Sep 1993 explosive/phreatic 2 ESE 1 km high eruption column 10 Aug 1996 10 Aug 1996 explosive/phreatic 2 1.5 km high eruption column, 3 casualties 28 Nov 2002 28 Nov 2002 explosive/phreatic 2
7 Mar 2003 23 Jul 2003 explosive/phreatic 1 ESE 1.5 km high eruption column 25 Jan 2005 25 May 2005 explosive/phreatic 2 E, SE 1 km high eruption column
3 Jun 2006 25 Jul 2006 explosive/phreatic 2 SE, S, SW 2 km high eruption column
culminates with the La Castellana debris avalanche deposit (<0.4 Ma, 13 km3Ma; V. Antonia Bornas, personal commu-nication, 2010), resulting from a massive flank collapse of the volcano that travelled 33 km to the SW, covering an area ex-ceeding 300 km2. This is the most remarkable and dramatic known event affecting Mt Kanlaon. The debris is very prob-ably linked to an erosive amphitheatre today filled in by later volcanic activity, whose limits are still somewhat recogniz-able for the existence of buried morphological scarps (see unconformity 1 in Fig. 4).
The intermediate unit (La Carlota volcanics) is bounded at the bottom by the unconformity 1, and at the top by an ero-sive unconformity surface cropping out close to the summit (unconformity 2 in Fig. 4). The upper unconformity, geolog-ically recent but unknown in age, has a sub-circular shape (3.5×3.9 km) and may represent the margins of a caldera collapse, or the head of an important erosive amphitheatre in the summit area.
The upper unit (modern Kanlaon volcanics), representing the most recent products, overflows through three main de-pressions opened in E and W directions bounded by the un-conformity 2 (Figs. 4 and 5). The main active vent, however, is located right on the southern rim of the unconformity 2, reaching the highest elevation of the volcano, at 2435 m a.s.l. The summit area of Kanlaon is characterized by a 5 km long, 0◦
N−30◦
Fig. 4.Simplified geological map of Mt Kanlaon. La Castellana debris avalanche (a) is characterized by numerous and occasionally very large hummocks (up to 1.6 km2, highlighted in cyan) emerging in the matrix (in yellow); this deposit comes from the dismantling of the pre-existing volcanic edifice (Kumalisquis volcanics, in dark blue).
(two craters, HSBC; Fig. 5). Overall, these morphostructural features suggest a southward migration of the activity. 3.2 Hazardous events, event tree and threat matrix
To build an updated multi-hazard map at Kanlaon, we con-sider the hazardous events that are comprised in the follow-ing three categories:
– Sector collapses. At least once in its history (∼0.4 Ma), Kanlaon was affected by a huge sector collapse. We considered this event as possible, even if it had occurred only once. However, a large sector collapse is highly im-probable without significant modifications of the actual morphology (e.g. extensive fractures and landslides) and geophysical precursors. Therefore, mainly consid-ering the very low frequency of occurrence, we ne-glected this in the present study.
– Eruptions. We distinguished effusive from explosive ac-tivities. Every eruption was then evaluated in terms of typology and frequency, considering the entire eruptive history of the volcano.
– Mudflows (lahars) induced by heavy rainfalls. Kanlaon is located in the equatorial belt, seasonally affected by heavy rainfall related to monsoons. Heavy rains
Fig. 5.Morphostructural analysis of the summit of Kanlaon vol-cano on a 10 m DEM. Arrows show the principal drainage paths. The summit area shows 0◦N
−30◦E-oriented craters and eruptive fissures. HSBC: Hardin Sang Balo crater; LC: Lugad crater; AC: active crater. See Fig. 4 for location.
during volcanic unrest producing major ash deposits can occasionally trigger landslides, avalanches and lahars that are potentially destructive and danger-ous. Consequently, we considered “heavy rain” as hazardous events, or as a possible factor reinforcing hazardous volcanic events.
After identifying the type of hazardous events at Kanlaon and their possible frequencies and despite poor data avail-able, we constructed the event tree shown in Fig. 6. Bear-ing in mind the historical information (coverBear-ing almost the last 130 yr), we were able to infer only the frequency of the phreatic and phreatomagmatic activity, and a single effusive and Strombolian activity (see Table 6). Nevertheless, geo-logic studies evidenced that in the past the volcano was char-acterized by significant lava flow and pyroclastic deposit suc-cessions. Therefore, the occurrence probability of each event has been determined on the basis of the collected volcanolog-ical, geologvolcanolog-ical, morphological and structural data and from the literature (Von Biedersee and Pichler, 1995).
Fig. 6.Type of hazardous events and their possible frequencies at Kanlaon volcano. In grey are the parts of the tree occurring at Kanlaon so rarely as not permitting reliable statistical calculations.
collapse”. We will focus in the following on the case of “no sector collapse”. The tree develops into “eruption” or “no eruption”. Then, the dominant eruptive style would very likely be “explosive” rather than “effusive” producing several eruptive categories and related phenomena.
The hazard of the phenomena highlighted in the event tree may increase dramatically during heavy rain periods, which characterize the region seasonally, as shown in the right por-tion of Fig. 6. Rain can remobilize unconsolidated volcanic deposits not only during an eruption, but also beyond the pe-riod of the eruption for several years, violently dragging them down until reaching a new morphological equilibrium.
Hence, we calculated a threat matrix for Kanlaon, where the different hazardous events are numerically evaluated on the basis of their frequencies and potential impacts. Also in this case, we found several difficulties because of the return period of several events that are unknown (e.g. pyroclastic flows, lahars). This made us consider the application of the method outlined in the first half of this paper as “flexible”, in order to overcome the problem, by introducing several sim-plifications (i.e. combining several types of eruptions, such as Plinian and sub-Plinian) deriving from our knowledge ap-plied to Kanlaon.
effusive eruption in 1902 (Siebert et al., 2010). This count may be underestimated due to the absence of constant moni-toring activity, especially in the first half of the 20th century. Considering all the available data, the volcanic (eruptive) un-rest (Rur) is evaluated as
Rur=(2012−1866) /29 events=5 yr.
Assuming the probability of “no collapse” (Pncol=99.999)
and “collapse” (Pcol=0.001) events, the related return
peri-ods (R) are
Rncol=Rur·(Pncol+Pcol) /Pncol
=5·(99.999+0.001) /99.99=5 yr, Rcol=Rur·(Pncol+Pcol) /Pcol
=5·(99.999+0.001) /0.001=503 403 yr.
The latter value is based on one single collapse event and is thus not constrainable. In the case of volcanic un-rest (Ru), we considered the probability of occurrence of the
eruption (Per=80 %) and no eruption (Pner=20 %) based
on the last 25 yr of observations (PHIVOLCS reports avail-able at http://www.phivolcs.dost.gov.ph/). Since 1866, only one effusive event has occurred (1902) out of a total of 29 events. Thus the probabilities of explosive and effusive events arePexpl=28/29=96.6 % andPeff=1/29=3.4 %,
respectively (Fig. 6). We then calculated the related return periods (R) of the eruptive events and the relative probabili-ties applying the likelihood table shown in ICPP (2012), scal-ing them on the baseline frequency scale (see Table 3): Rer=(Rncol·100) /Per=(5.03·100) /80=6.3 yr
Rner=(Rncol·100) /Pner=(5.03·100) /20=25.2 yr
Rexpl=(Rer·100) /Pexpl=(6.3·100) /95.2=6.8 yr
⇒Rplinian/subplinian=(6.5·100) /1.5=434.4 yr
⇒F3Moderate
⇒Rstrombolian=(6.5·100) /3.3=197.4 yr
⇒ F3Moderate
⇒Rash/phreatic=(6.5·100) /95.2=6.8 yr
⇒F6Quasi Permanent
Reff=(Rer·100) /Peff=(6.3·100) /3.4=185.1 yr
⇒Rlavaext=(185.1·100) /75=246.8 yr
⇒F3Moderate,
whereRplinian/subplinian is the return period for
Plinian/sub-Plinian eruptions,Rstrombolianthe return period for
Strombo-lian eruptions,Rash/phreaticthe return period for ash/phreatic
eruptions, andRlavaextreturn period for lava eruptions.
Com-bining the results using the indexes of Tables 2, 3, and 5, we obtain threat values for each phenomenon as shown in Ta-ble 7.
3.3 Multi-hazard map construction
Thanks to the recently acquired new data on the geology and geomorphology of Kanlaon, we divide the volcano into sev-eral sectors, each of them corresponding to different prob-abilities of a given event to occur. Then, we provide a best estimate of the distance reached by each phenomenon, with-out attempting to provide a more sophisticated approach, due to the poor amount of available data.
We firstly took into account the existing lava hazard map, and the pyroclastic flow and lahar hazard map of Kanlaon edited by the Philippine Institute of Volcanology and Seis-mology (PHIVOLCS), both available at http://www.phivolcs. dost.gov.ph. Therefore, we revisited these documents, taking into account the results from a fieldwork overview and from the remote sensing data analysis (see Sect. 3). The resulting hazard maps related to lava flows, pyroclastic flows and mud-flows (lahars) are shown in Fig. 7.
Figure 7a shows the areas prone to lava invasion. We dis-tinguished two zones characterized by high and low hazard, respectively. The map is compiled considering the position of the active and potentially active summit vents, the mor-phology of the volcano and the characteristics of lava flows cropping out on its flanks. None of the cities and the villages are located in these areas.
Figure 7b illustrates the zones potentially invaded by py-roclastic flows, mudflows and lahars, and potentially threat-ened by the fall of ballistic products due to phreatic and/or phreatomagmatic explosions erupted from the summit vents. The red line 4 km away from the summit vents circumscribes the area with greatest hazard, while the other contours mark zones with progressively less volcanic hazard. The longest pyroclastic flow is imaged to reach a maximum distance of about 10–12 km, along the southern half of the volcanic ed-ifice, in agreement with field evidence (Von Biedersee and Pichler, 1995; http://www.phivolcs.dost.gov.ph). Moreover, we have plotted the drainage system on the map, highlighting the zones potentially affected by mudflows and lahars deriv-ing from potentially violent and long-lastderiv-ing rainfalls.
Table 7.Threat index calculated for each considered phenomenon.
Phenomenon Intensity Numerical Frequency Index Threat class equivalent of class of index
intensity frequency
class class
Plinian/Sub-Plinian eruptions I5 100 F3 0.2 20
Strombolian eruptions I1 0.5 F3 0.2 0.1
Phreatic/Ash eruptions I2 2.5 F6 10 25
Effusive eruptions I1 0.5 F3 0.2 0.1
Fig. 7. Volcanic hazard map of Kanlaon (modified from http:// www.phivolcs.dost.gov.ph).(a)Lava hazard map: 1 – active sum-mit vents; 2 – area prone to high hazard of lava invasion; 3 – area prone to slight hazard of lava invasion; 4 – main towns and villages.
(b) Pyroclastic and lahar hazard map: 1 – active summit vents; 2 – areas highly prone to pyroclastic flows; 3 – areas highly prone to lahars; 4 – main towns and villages; 5 – drainage system. The elliptical blue lines show areas progressively further away from the summit active vent. The area within 4 km from the summit vents, highlighted in red, indicates the area of maximum volcanic hazard.
4 Discussion
In this paper, we propose a multi-hazard mapping method ap-plied to Kanlaon, an active volcano with more than 300 000 inhabitants in its vicinity, distributed in many villages located on its slopes, or close to the base of the volcano. The hazard assessment regarding the local population is, therefore, not a trivial exercise. We improve the previous existing hazard map by integrating new areas identified as prone to volcanic and volcanic-derived hazards. In particular, we redefined the summit active area by extending the potentially active area towards the north; we also define an overlooked area prone to potential mudflows and pyroclastic flows located on the eastern side of the volcano.
Kanlaon volcano is characterized by two main concerns: (1) its eruptive activity is poorly understood and rather un-even over time; and (2) the volcano is located in a sub-equatorial climate zone, namely in an area characterized by seasonally abundant and violent rainfall, able to mobilize ma-terials deposited during previous eruptions (e.g. ashfall) and to generate almost instantly voluminous lahars, debris and mudflows.
4.1 Limitations
The main limitation consists in the lack of knowledge of the timing of volcanic phenomena. Geological knowledge of Kanlaon is incomplete and still needs improvement, es-pecially for mudflow and lahar mapping. Using existing in-complete data allows broadly deciphering the type and ex-tent of eruptive phenomena at Kanlaon, and their overall stratigraphy. However, very few time markers are available in the stratigraphic succession. Therefore, the main difficulty is to determine the occurrence frequency of each geological event.
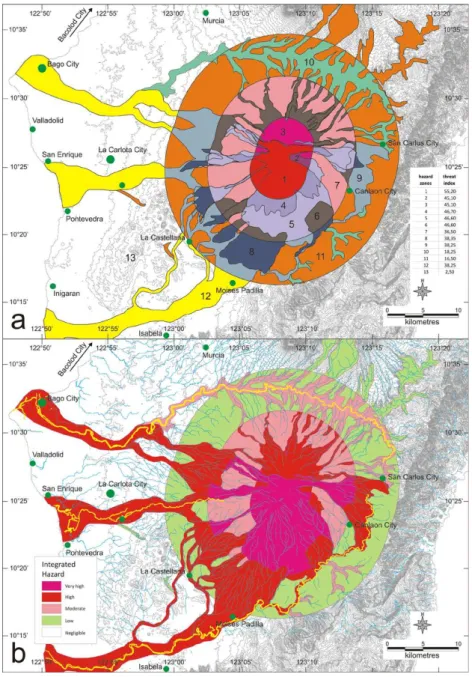
Fig. 8.Multi-hazard map of Kanlaon.(a)Preliminary map obtained by overlapping the values of threat index for each phenomenon in different sectors of the analysed territory.(b)Final multi-hazard map obtained by grouping the threat indexes into five classes. See text for explanation. Blue lines represent the drainage system (in yellow are the main rivers potentially affected by huge lahar and mudflow deposits).
largest spatial and temporal extents, in favour of safety. Such basic hazard maps must of course be modified in the case of future unrest, and might be adapted according to ongoing activity, integrating all available data (e.g. seismicity, ground deformation, etc.).
This methodological application is still lacking in up-to-date detailed topographic data, especially in areas with ex-tensive vegetation. In the case of Kanlaon, this problem has been at least partially overcome by using a new DEM with a good accuracy relative to the summit of the volcano (10 m resolution), which allowed us to better understand the mor-phostructural features of the currently or recently active
erup-tive vents. This new DEM may also allow future modelling of lava flows and mudflows potentially affecting the volcano surroundings.
4.2 Implications for people at risk
Turning to the map shown in Fig. 8b, it is clear that the high slopes of the volcano (0–4 km away from the summit vents) are characterized by the greatest level of hazard.
the S). This hazard is mainly due to potential volcanic activ-ity, and obviously decreases with greater distance from the summit active vents.
At distances of more than 10 km from the summit area, the most hazardous areas fall along almost all the courses of major rivers and streams (Fig. 8). There are three main rivers, two of which are fairly long, bounding the volcano to the N, S and E, draining the water towards the W until the sea coast. Along these rivers the highest hazard may be pro-duced by lahar phenomena combined with volcanic phenom-ena (pyroclastic flows). Again, heavy rains can swell rivers, thereby triggering dangerous alluvial events and/or volumi-nous lahars, mudflows and landslides. The latter phenomena can also occur irrespective of the eruptive activity, due to the regular frequency characterizing the intense rainfall in sub-equatorial regions. The resident population living on the slopes and at the base of the volcano amounts to a total of more than 300 000 people; some urban areas fall within or are close to areas with moderate to high hazard (Bago City, St Charles City, Moises Padilla, San Enrique, La Castellana, La Carlota City), for a total of approximately 50 000 inhabi-tants.
4.3 Relevance and adaptability of the approach to other contexts
Multiple kinds of adverse events may typically occur at vol-canoes. In such areas, evaluations of the various threats that are not cross-referenced may lead to inappropriate hazard mapping and land use planning recommendations (Bell and Glade, 2004). The key point in holistic multi-hazard map-ping methods is thus a common baseline upon which the var-ious threats can be evaluated. Here, we proposed a common baseline based on potential impacts of each adverse event. This baseline provides a reference scale for assessing the fre-quency and intensity of each kind of hazard at each location, thus making the comparison of threats possible. While this issue is particularly critical in volcanic areas, it may also be applied to a wide range of natural and human hazards.
One limitation of the multi-hazard mapping approach pre-sented in Thierry et al. (2008) was its complex applicability to volcanoes having many different eruption modes. Implic-itly, a limited number of eruptive modes were considered in mapping the hazards at Mount Cameroon, including the most probable effusive modes and the unlikely large-scale debris avalanche and phreatomagmatic eruption (plus other adverse events such as landslides). In more complex volcanoes, con-sidering the probabilities associated with each eruption re-quires a more formalized approach. We found that the event tree approach (Newhall and Hoblitt, 2002) proved highly ap-propriate to this end. We believe that this structured approach toward various eruptive scenarios enables the application of this hazard mapping method to other poorly studied volcanic areas, as a first-order hazard estimate.
There is undoubtedly much added value in applying ad-vanced numerical modelling to further refine hazard mapping (e.g. Mac´ıas et al., 2008). However, these modelling exer-cises should not only address the maximal extent or possible intensity of adverse events. They should also provide some insight into their frequency of occurrence (e.g. Favalli et al., 2012). Finally, given the multiplicity of threats affecting vol-canic areas, producing a complete multi-hazard map will re-quire a combination of advanced modelling approaches to-gether with sometimes approximate approaches.
The resulting multi-hazard maps could be used for raising public awareness, together with other tools, e.g. for alert de-cision support (Aspinall et al., 2006). However, Haynes et al. (2007) showed they may not be sufficient to help people to comprehend the spatial significance of the actual threats. For this wider user application, participatory methods are prob-ably needed in addition to knowledge of the hazards (e.g. Cronin et al., 2004). In effect, the main purpose of such multi-hazard maps is to help local authorities and civil de-fence make more conscious land use planning decisions. For these users, we believe that such multi-hazard maps are a significant improvement to susceptibility maps, because they relate practical and understandable recommendations to the various levels of threats. However, in order to effectively serve disaster mitigation, the generic recommendations as-sociated with each threat level in the hazard map (Table 5) should be adapted to the local context (e.g. geographical, cul-tural and social, etc.), which was not undertaken within this methodological study.
5 Conclusions
Beyond their limitation on the application at Kanlaon, the obtained results constitute a useful enhancement of the already existing hazard maps. The proposed multi-hazard method was found to produce maps that are relevant towards land use planning. We believe that this approach is pertinent and may be applied to other poorly known volcanic areas and possibly in more generic multi-hazard assessments.
Acknowledgements. This work was undertaken under the MI-AVITA project, financed by the European Commission under the 7th Framework Programme for Research and Technological Development, Area “Environment”, Activity 6.1 “Climate Change, Pollution and Risks”. The authors would like to thank A. Vagner, J. Douglas, P. Gehl, J. Loiseau and E. Vanoudheusden for useful comments that led to the improvement of the proposed method. Very special thanks go to PHIVOLCS and particularly V. Antonia Bornas, M. Martinez-Villegas M. and E. Bariso for the invaluable support during fieldwork, and highly useful discussions on the ge-ology of Kanlaon. S. Conway has improved the English language. We thank Dmitri Rouwet and two anonymous reviewers for their constructive comments that greatly improved the paper.
Edited by: A. Costa
Reviewed by: D. Rouwet and two anonymous referees
References
Acocella, V., Porreca, M., Neri, M., Mattei, M., and Funiciello, R.: Fissure eruptions at Mount Vesuvius (Italy): insights on the shal-low propagation of dikes at volcanoes, Geology, 34, 673–676, doi:10.1130/G22552.1, 2006a.
Acocella, V., Neri, M., and Scarlato, P.: Understanding shallow magma emplacement at volcanoes: Orthogonal feeder dikes dur-ing the 2002–2003 Stromboli (Italy) eruption, Geophys. Res. Lett., 33, L17310, doi:10.1029/2006GL026862, 2006b. Aspinall, W. P.: Structured elicitation of expert judgment and its use
for probabilistic hazard and risk assessment in volcanic erup-tions, in: Statistics in Volcanology, edited by: Mader, H. M., Coles, S. G., Connor, C. B., and Connor, L. J., Geol. Soc. Lon-don, International Association of Volcanology and Chemistry of the Earth’s Interior, IAVCEI Publications, London, 1–268, 2006. Aspinall, W. P., Carniel, R., Jaquet, O., Woo, G., and Hincks, T.: Using hidden multi-state Markov models with multi-parameter volcanic data to provide empirical evidence for alert level decision-support, J. Volcanol. Geoth. Res., 153, 112–124, doi:10.1016/j.jvolgeores.2005.08.010, 2006.
Ayonghe, S. N., Ntasin, E. B., Samalang, P., and Suh, C. E.: The June 27, 2001 landslide on volcanic cones in Limbe, Mount Cameroon, West Africa, J. Afr. Earth Sci., 39, 435–439, 10.1016/j.jafrearsci.2004.07.022, 2004.
Barreca, G., Bonforte, A., and Neri, M.: A pilot GIS database of active faults of Mt. Etna (Sicily): A tool for integrated hazard evaluation, J. Volcanol. Geoth. Res., 251, 170–186, doi:10.1016/j.jvolgeores.2012.08.013, 2013.
Bell, R. and Glade, T.: Multi-hazard analysis in natural risk assess-ments, in: Risk Analysis IV, edited by: Brebbia, C. A., WIT Press Southampton, 197–206, doi:10.2495/RISK040181, 2004.
Bignami, C., Ruch. J., Chini, M., Neri, M., and Buongiorno, F.: Py-roclastic density current volume estimation after the 2010 Merapi volcano eruption using X-band SAR, J. Volcanol. Geoth. Res., doi:10.1016/j.jvolgeores.2013.03.023, in press, 2013.
Boiteux, M. and Baumstark, L.: Transport: choix des investisse-ments et coˆut des nuisances, Report, Commissariat G´en´eral du Plan, La Documentation franc¸aise, Paris, France, 328 pp., available at: http://www.ladocumentationfrancaise.fr/var/ storage/rapports-publics/014000434/0000.pdf, last access: July 2013, 2001 (in French).
Cash, D. W., Clark, W. C., Alcock, F., Dickson, N. M., Eckley, N., Guston, D. H., Jager, J., and Mitchell, R. B.: Knowledge systems for sustainable development, P. Natl. Acad. Sci. USA, 100, 8086– 8091, doi:10.1073/pnas.1231332100, 2003.
Crisci, G. M., Avolio, M. V., Behncke, B., D’Ambrosio, D., Di Gre-gorio, S., Lupiano, V., Neri, M., Rongo, R., and Spataro, W.: Pre-dicting the impact of lava flows at Mount Etna, Italy, J. Geophys. Res., 115, B04203, doi:10.1029/2009jb006431, 2010.
Cronin, S. J., Gaylord, D. R., Charley, D., Alloway, B. V., Wallez, S., and Esau, J. W.: Participatory methods of incorporating sci-entific with traditional knowledge for volcanic hazard manage-ment on Ambae Island, Vanuatu, B. Volcanol., 66, 652–668, doi:10.1007/s00445-004-0347-9, 2004.
Douglas, J.: Physical vulnerability modelling in natural hazard risk assessment, Nat. Hazards Earth Syst. Sci., 7, 283–288, doi:10.5194/nhess-7-283-2007, 2007.
Favalli, M., Tarquini, S., Papale, P., Fornaciai, A., and Boschi, E.: Lava flow hazard and risk at Mt. Cameroon volcano, B. Vol-canol., 74, 423–439, doi:10.1007/s00445-011-0540-6, 2012. Grunthal, G., Thieken, A. H., Schwarz, J., Radtke, K. S., Smolka,
A., and Merz, B.: Comparative risk assessments for the city of Cologne – Storms, floods, earthquakes, Nat. Hazards, 38, 21–44, doi:10.1007/s11069-005-8598-0, 2006.
Gurioli, L., Sulpizio, R., Cioni, R., Sbrana, A., Santacroce, R., Lu-perini, W., and Andronico, D.: Pyroclastic flow hazard assess-ment at Somma–Vesuvius based on the geological record, B. Vol-canol., 72, 1021–1038, doi:10.1007/s00445-010-0379-2, 2010. Hayes, S. K., Montgomery, D. R., and Newhall, C. G.:
Flu-vial sediment transport and deposition following the 1991 eruption of Mount Pinatubo, Geomorphology, 45, 211–224, doi:10.1016/s0169-555x(01)00155-6, 2002.
Haynes, K., Barclay, J., and Pidgeon, N.: Volcanic hazard commu-nication using maps: an evaluation of their effectiveness, B. Vol-canol., 70, 123–138, doi:10.1007/s00445-007-0124-7, 2007. IPCC: Managing the Risks of Extreme Events and Disasters to
Ad-vance Climate Change Adaptation, A Special Report of Work-ing Groups I and II of the Intergovernmental Panel on Climate Change, edited by: Field, C. B., Barros, V., Stocker, T. F., Qin, D., Dokken, D. J., Ebi, K. L., Mastrandrea, M. D., Mach, K. J., Plattner, G.-K., Allen, S. K., Tignor, M., and Midgley, P. M., Cambridge University Press, Cambridge, UK, and New York, NY, USA, 582 pp., 2012.
Kappes, M. S., Keiler, M., von Elverfeldt, K., and Glade, T.: Chal-lenges of analyzing multi-hazard risk: a review, Nat. Hazards, 64, 1925–1958, doi:10.1007/s11069-012-0294-2, 2012.
Klose, C. D.: Health risk analysis of volcanic SO2
Lavigne, F., de B´elizal, E., Cholik, N., Aisyah, N., Picquout, A., and Tyas Wulan Mei, E.: Lahar hazards and risks following the 2010 eruption of Merapi volcano, Indonesia, EGU General Assembly, Vienna, Austria, 3–8 April 2011, EGU2011-4400, 2011. Mac´ıas, J. L., Capra, L., Arce, J. L., Espindola, J. M.,
Garcia-Palomo, A., and Sheridan, M. F.: Hazard map of El Chich´on volcano, Chiapas, M´exico: Constraints posed by eruptive history and computer simulations, J. Volcanol. Geoth. Rese., 175, 444– 458, doi:10.1016/j.jvolgeores.2008.02.023, 2008.
Mart`ı, J., Aspinall, W. P., Sobradelo, R., Felpeto, A., Geyer, A., Ortiz, R., Baxter, P., Cole, P., Pacheco, J., Blanco, M. J., and Lopez, C.: A long-term volcanic hazard event tree for Teide-Pico Viejo stratovolcanoes (Tenerife, Ca-nary Islands), J. Volcanol. Geoth. Res., 178, 543–552, doi:10.1016/j.jvolgeores.2008.09.023, 2008.
Marzocchi, W. and Woo, G.: Principles of volcanic risk metrics: Theory and the case study of Mount Vesuvius and Campi Flegrei, Italy, J. Geophys. Res., 114, B03213, doi:10.1029/2008jb005908, 2009.
Marzocchi, W., Sandri, L., Gasparini, P., Newhall, C., and Boschi, E.: Quantifying probabilities of volcanic events: The example of volcanic hazard at Mount Vesuvius, J. Geophys. Res., 109, B11201, doi:10.1029/2004jb003155, 2004.
Marzocchi, W., Mastellone, M. L., Di Ruocco, A., Novelli, P., Romeo, E., and Gasparini, P.: Principles of multi-risk assess-ment, Interaction amongst natural and man induced risks, Euro-pean Commission EUR23615, Brussels, Belgium, 72 pp., 2009. Marzocchi W., Sandri L., and Selva J.: BET VH: a probabilistic
tool for long-term volcanic hazard assessment, B. Volcanol., 72, 717–733, doi:10.1007/s00445-010-0358-7, 2010.
Neri, A., Aspinall, W. P., Cioni, R., Bertagnini, A., Baxter, P. J., Zuccaro, G., Andronico, D., Barsotti, S., Cole, P. D., Ongaro, T. E., Hincks, T. K., Macedonio, G., Papale, P., Rosi, M., San-tacroce, R., and Woo, G.: Developing an Event Tree for prob-abilistic hazard and risk assessment at Vesuvius, J. Volcanol. Geoth. Res., 178, 397–415, 10.1016/j.jvolgeores.2008.05.014, 2008.
Neri, M., Lanzafame, G., and Acocella, V.: Dike emplacement and related hazard in volcanoes with sector collapse: the 2007 Stromboli eruption, J. Geol. Soc. London, 165, 883–886, doi:10.1144/0016-76492008-002, 2008.
Newhall, C. G. and Hoblitt, R. P.: Constructing event trees for volcanic crises, B. Volcanol., 64, 3–20, doi:10.1007/s004450100173, 2002.
Newhall, C. G. and Self, S.: The Volcanic Explosivity Index (VEI) – An Estimate of Explosive Magnitude for Historical Volcanism, J. Geophys. Res., 87, 1231–1238, doi:10.1029/JC087iC02p01231, 1982.
Rae, A. J., Cooke, D. R., Phillips, D., and Zaide-Delfin, M.: The nature of magmatism at Palinpinon geothermal field, Ne-gros Island, Philippines: implications for geothermal activity and regional tectonics, J. Volcanol. Geoth. Res., 129, 321–342, doi:10.1016/s0377-0273(03)00280-4, 2004.
Sandri, L., Jolly, G., Lindsay, J., Howe, T., and Marzocchi, W.: Combining long- and short-term probabilistic volcanic hazard assessment with cost-benefit analysis to support decision mak-ing in a volcanic crisis from the Auckland Volcanic Field, New Zealand, B. Volcanol., 74, 705–723, doi:10.1007/s00445-011-0556-y, 2012.
Selva, J., Costa, A., Marzocchi, W., and Sandri, L.: BET VH: ex-ploring the influence of natural uncertainties on long-term haz-ard from tephra fallout at Campi Flegrei (Italy), B. Volcanol., 72, 717–733, doi:10.1007/s00445-010-0358-7, 2010.
Siebert, L., Simkin, T., and Kimberly, P.: Volcanoes of the World. Smithsonian Institution, Washington D.C., University of Califor-nia Press, 551 pp., 2010.
Simkin, T., Siebert, L., McClelland, L., Bridge, D., Newhall, C., and Latter, J. H.: Volcanoes of the World, Smithsonian Institution, Hutchinson Ross, Pennsylvania, USA, 1981.
Solaro, G., Acocella, V., Pepe, S., Ruch, J., Neri, M., and Sansosti, E.: Anatomy of an unstable volcano from InSAR: Multiple pro-cesses affecting flank instability at Mt. Etna, 1994–2008, J. Geo-phys. Res., 115, B10405, doi:10.1029/2009jb000820, 2010. Solidum, R. U., Castillo, P. R., and Hawkins, J. W.: Geochemistry
of lavas from Negros Arc, west central Philippines: Insights into the contribution from the subducting slab, Geochem. Geophy. Geosy., 4, 9008, doi:10.1029/2003gc000513, 2003.
Spence, R. J. S., Kelman, I., Baxter, P. J., Zuccaro, G., and Petrazzuoli, S.: Residential building and occupant vulnerabil-ity to tephra fall, Nat. Hazards Earth Syst. Sci., 5, 477–494, doi:10.5194/nhess-5-477-2005, 2005.
Stieltjes, L.: Vuln´erabilit´e aux ph´enom`enes volcaniques: m´ethodologie et ´evaluation. Application `a la Martinique: rapport d’´etape 1997, BRGM Report R39735, Orl´eans, France, 205 pp., 1997 (in French).
Thierry, P., Stieltjes, L., Kouokam, E., Ngueya, P., and Salley, P. M.: Multi-hazard risk mapping and assessment on an active volcano: the GRINP project at Mount Cameroon, Nat. Hazards, 45, 429– 456, doi:10.1007/s11069-007-9177-3, 2008.
Vecchia, A. V.: A unified approach to probabilistic risk assessments for earthquakes, floods, landslides, and volcanoes, in: Proceed-ings of a multidiscipilinary workshop held in Golden, Colorado November 16–17, 1999, Open-File Report 01-324, US Geologi-cal Survey, 2001.
Vicari, A., Ganci, G., Behncke, B., Cappello, A., Neri, M., and Del Negro, C.: Near-real-time forecasting of lava flow hazards during the 12–13 January 2011 Etna eruption, Geophys. Res. Lett., 38, L13317, doi:10.1029/2011gl047545, 2011.
Von Biedersee, H. and Pichler, H.: The Canlaon and its neighboring volcanos in the Negros Belt Philipines, J. Southe. Asian Earth, 11, 111–123, doi:10.1016/0743-9547(94)00042-d, 1995. Zogning, A.: Le Mont Cameroun, un volcan actif: contribution `a