UNIVERSIDADE NOVA DE LISBOA
Faculdade de Ciências e Tecnologia
Departamento de Ciências e Engenharia do Ambiente
Matching CO
2large point sources and potential
geological storage sites in mainland Portugal
Ana Sofia Ferrada Gomes
Dissertação apresentada na Faculdade de Ciências e Tecnologia
da Universidade Nova de Lisboa para obtenção do grau de
Mestre em Engenharia do Ambiente, Perfil Gestão e Sistemas
Ambientais.
Orientação: Prof. Doutor Carlos Nunes da Costa
Prof. Doutor João Joanaz de Melo
Acknowledgments
I would like to thank Professor João Joanaz de Melo and Professor Carlos Nunes da Costa for their supervision and suggestions during this work. I would also like to thank Daniel Vendas from CIGA for all his help mapping the geological formations.
I am very grateful to my colleagues at Euronatura for all the support and mainly for understanding my absence. I also express my gratitude to Sapo for his precious help in the difficult task of mapping the installations included in the phase II of the European Union Emissions Trading Scheme. Special thanks to Sara Dourado for all her help and revisions to my work and for being always available and motivating me.
I would like to thank to my colleagues at CCIAM for all the support. Special thanks to Katalina Mauer for her help in the revision of this thesis.
I also express my gratitude to Daniel Borrego for his priceless guidance, advices and help, and for motivating me to start and finish this thesis.
I would like to thank to all my friends for their patience and support. Special thanks to Ana Poças, Ana Rovisco, Carolina Patrocínio, Catarina Morgado, Diana Brandão, Filipa Nobre, Hugo Costa, Maria João Belo and Sara Belga for all the help and support. I would also like to thank my cousin Filipa Ferrada for the motivation and support.
Special thanks to Lecas for the Idrisi lessons, the infinite patience and support, and for motivating me constantly.
I am very grateful to my parents, my brother Pedro and my sister (in law) Mariana for all the support and patience.
Abstract
Fossil fuel combustion is the major source of the increasing atmospheric concentration of carbone dioxide (CO2) since the pre-industrial period. Combustion systems like
power plants, cement, iron and steel production plants and refineries are the main stationary sources of CO2 emissions. The reduction of greenhouse gas emissions in one
of the main climate change mitigation measures. Carbon dioxide capture and storage (CCS) is one of the possible mitigation measures.
The objective of this study was to analyze the hypothesis for the implementation of CCS systems in mainland Portugal based on source-sink matching. The CO2 large point
sources (LPS) considered in mainland Portugal were the largest installations included in the Phase II of the European Emissions Trading Scheme with the highest CO2
emissions, representing about 90% of the total CO2 emissions of the Trading Scheme,
verified in 2007. The potential geological storage locations considered were the geological formations formerly identified in existing studies.
After the mapping of LPS and potential geological sinks of mainland Portugal, an analysis based on the proximity of the sources and storage sites was performed. From this it was possible to conclude that a large number of LPS are within or near the potential storage areas. An attempt of estimating costs of implementing a CCS system in mainland Portugal was also performed, considering the identified LPS and storage areas. This cost estimate was a very rough exercise but can allow an order of magnitude of the costs of implementing a CCS system in mainland Portugal. Preliminary results suggest that at present CCS systems are not economically interesting in Portugal, but this may change with increasing costs of energy and emission permits.
Resumo
A queima de combustíveis de fósseis, é desde do período pré-industrial, o maior responsável pelo aumento da concentração atmosférica de dióxido de carbono (CO2).
Entre as maiores fontes estacionárias de CO2 encontram-se centrais termoeléctricas,
refinarias, cimenteiras e indústrias de produção de metais ferrosos. A redução das emissões de gases de efeito estufa é uma das principais medidas de mitigação das alterações climáticas. Entre estas medidas encontra-se a captura e o sequestro de CO2
(CSC). O objectivo deste estudo foi analisar as hipóteses de implementação de um sistema de CSC em Portugal continental, baseada no cruzamento entre as fontes e os locais de sequestro. As grandes fontes de emissão de CO2 (GFE) consideradas foram o
grupo de instalações incluidas na fase II do Comércio Europeu de Licenças de Emissão (CELE), com maior volume anual de emissões de CO2, representando 90% do total das
emissões verificadas em 2007 no conjunto nacional do CELE. As potenciais áreas de sequestro geológico consideradas foram as formações geológicas previamente identificadas em estudos existentes.
Após o mapeamento das GFE e das potenciais áreas de sequestro geológico, foi realizada uma análise baseada na proximidade entre as fontes e os locais de armazenamento. Desta análise foi possível concluir que existem muitas GFE dentro ou na vizinhança das potencias áreas de sequestro. Foi também efectuada uma tentiva para estimar os custos de implementação de um sistema de CSC em Portugal continental, considerando as GFE e as áreas de sequestro identificadas. Esta estimativa de custos, apesar de ser um exercício grosseiro, permite-nos ter uma ideia da ordem de grandeza dos custos de implementação de um sistema de CSC em Portugal continental. Resultados preliminares indicam que neste momento os sistemas CSC não têm interesse económico, mas a situação poderá mudar se os custos da energia e das licenças de emissão aumentarem.
A actual lacuna de informação em relação aos locais de sequestro geológico de CO2 é
Acronyms
AGR Acid gas removal
APA Portuguese Environmental Agency
CBM Coal bed methane
CCGT Combined cycle gas turbine
CCS Carbone capture and storage
CDM Clean development mechanism
CER Certified emission reductions
CIAGEB Global Change, Energy, Environment and Bioengineering RDID&D Unit, Fernando Pessoa University
COS Carbonyl sulfide
DPEP Divisão para a Pesquisa e Exploração de Petróleo
EC European Commission
ECBMR Enhanced coal bed methane recovery
EGR Enhanced gas recovery
EOR Enhanced oil recovery
ERU Emission reduction units
ET Emissions trading
EU-ETS European Union Emissions Trading Scheme
EU – 15 Austria, Belgium, Denmark, Finland, France, Germany, Greece, Ireland, Italy, Luxembourg, Netherlands, Portugal, Spain, Sweden and United Kingdom
FEP Features Events and Processes
FGD Flue gas desulphurisation
GHG Greenhouse gases
HHV Higher Heating Value
IEA GHG International Energy Agency Greenhouse Gas R&D Programme
IGCC Integrated gasification combined cycles
INETI National Institute of Engineering, Technology and Innovation
IPCC Intergovernmental Panel on Climate Change
IPPC Integrated Pollution Prevention and Control
JI Joint Implementation
KP Kyoto Protocol
LHV Lower Heating Value
LPS Large Point Sources
MAOTDR Portuguese Ministry for Environment, Spatial Planning and Regional
Development
MDEA MethylDiEthanolAmine
MEA Monoethanolamine
MMV Monitoring, Mitigation and Verification systems
NAP National Allocation Plan
NGCC Natural gas combined cycles
NIR National Inventory Report
OSPAR Convention for the Protection of the Marine Environment of the North-East Atlantic
PC Pulverised coal power plants
PF Pulverised fuel-fired stations
ppm Parts per million
SCR Selective catalytic reduction
UNCLOS United Nations Convention on the Law of the Sea
UNFCCC United Nations Framework Convention on Climate Change
Table of contents
1
Introduction ... 1
1.1 Background... 1
1.2 Goals... 3
1.3 Dissertation organization... 4
2
State of the art ... 7
2.1 Problem definition... 7
2.2 Carbon dioxide capture systems and technologies... 10
2.2.1 CO2 capture technologies... 10
2.2.2 CO2 capture systems... 12
2.2.3 CO2 capture in power plants... 17
2.3 CO2 transport... 20
2.3.1 CO2 pipeline transportation ... 21
2.3.2 CO2 transportation by ship ... 22
2.4 Carbon dioxide storage... 22
2.4.1 Underground geological storage... 23
2.4.2 Ocean storage ... 31
2.4.3 Industrial fixation of CO2... 32
2.5 Environmental impact assessment and risk evaluation... 33
2.6 Monitoring, mitigation and verification systems... 37
2.6.1 Monitoring of CO2 transport ... 38
2.6.2 Monitoring of CO2 storage ... 38
2.7 Energy and emissions balance... 42
2.7.1 Comparison of CO2 capture in different power plant technologies... 45
2.8 CCS legal and political aspects... 48
2.8.1 Legal and regulatory framework for CCS ... 48
2.8.2 CCS and the international climate policy framework ... 50
3
Implementation of a CCS system ... 53
3.1 Assessment of CO2 storage capacity... 53
3.2 Identification of potential CO2 geological storage locations... 59
3.2.1 Deep saline aquifers... 61
3.2.2 Coal beds ... 65
3.3 Sources characterisation... 67
3.4 Worldwide CCS projects... 68
3.5 CCS costs... 69
3.5.1 CO2 capture costs ... 69
3.5.2 CO2 transport costs ... 73
3.5.3 CO2 storage costs... 74
4
Hypotheses for the implementation of a CCS system in
mainland Portugal – source sink matching ... 77
4.1 Methods overview... 77
4.2 Sources of CO2 in mainland Portugal... 78
4.2.1 Overview of GHG emissions in Portugal ... 78
4.2.2 Identification of CO2 stationary sources in mainland Portugal ... 79
4.3 Potential geological CO2 storage sites in mainland Portugal... 87
4.3.2 Identification of potential geological CO2 storage sites in mainland
Portugal 90
4.4 Source sink matching... 91
4.5 Attempt of costs estimation... 97
5
Conclusions ... 101
6
References ... 105
List of Figures
Figure 1.1 - Schematic diagram representing anthropogenic drivers, impacts of and
responses to climate change, and their linkages (IPCC, 2007a)... 2
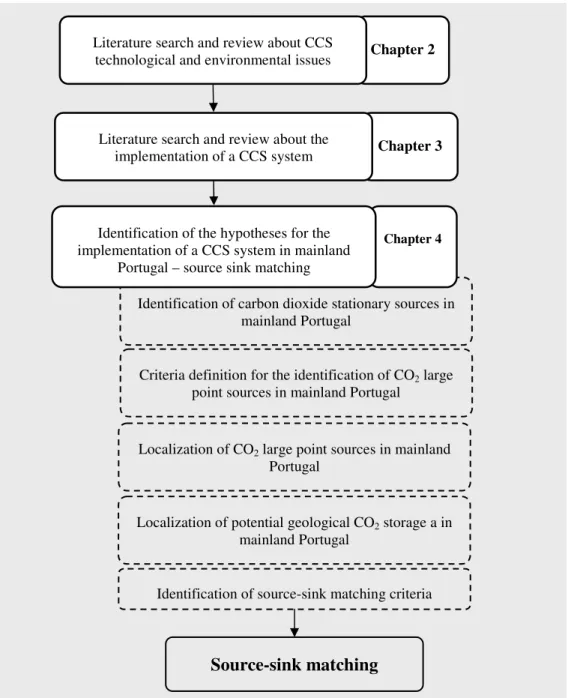
Figure 1.2- Main steps of the method... 4
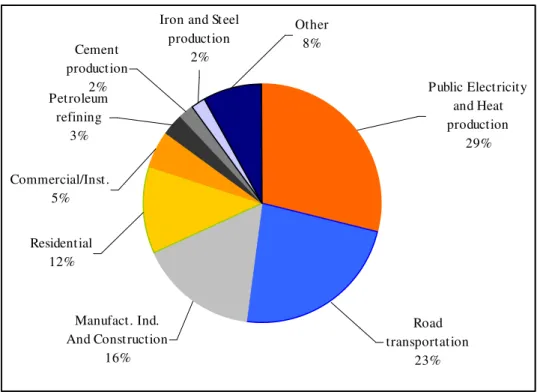
Figure 2.1 – Share of largest CO2 key sources categories in 2006 for EU-15 (EEA, 2008)... 7
Figure 2.2 – Technical components of CCS (Fernando et al., 2008)... 9
Figure 2.3 - General scheme of separation with sorbents/solvents (IPCC, 2005)... 11
Figure 2.4 - General scheme of separation with a membrane (IPCC, 2005)... 12
Figure 2.5 - General scheme of separation by cryogenic distillation (IPCC, 2005)... 12
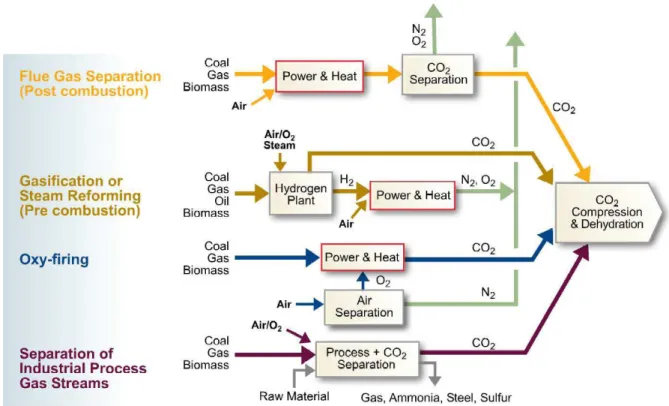
Figure 2.6 - Carbon dioxide capture processes in the four capture systems (IPIECA and API, 2007). ... 13
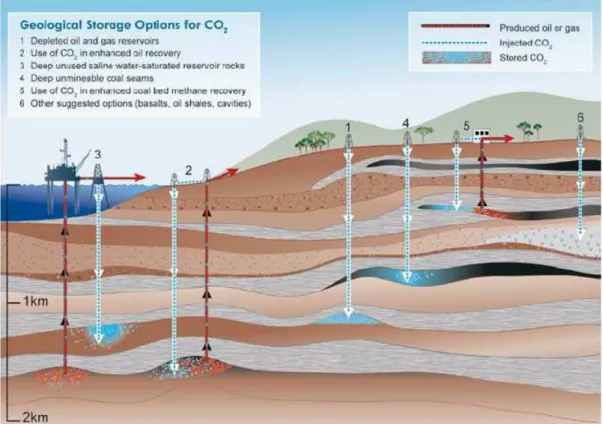
Figure 2.7 - Options for storing CO2 in deep underground geological formations (IPCC, 2005)... 24
Figure 2.8 - CO2 storage potential per type of underground reservoirs (Hendricks et al., 2004)... 24
Figure 2.9 - CO2 storage potential per world region (Hendricks et al., 2004). ... 24
Figure 2.10 Injection of CO2 for enhanced oil recovery with some storage of retained CO2 (IPCC, 2005)... 26
Figure 2.11 – Adsorption of different gases on coal (Bachu et al., 2007a)... 27
Figure 2.12 Storage security of physical and geochemical trapping mechanisms after injections stops (IPCC, 2005)... 31
Figure 2.13 – Operating timeframe of processes involved in CO2 geological storage (Bachu et al., 2007). ... 31
Figure 2.14 Illustration of ocean storage strategies (IPCC, 2005). ... 32
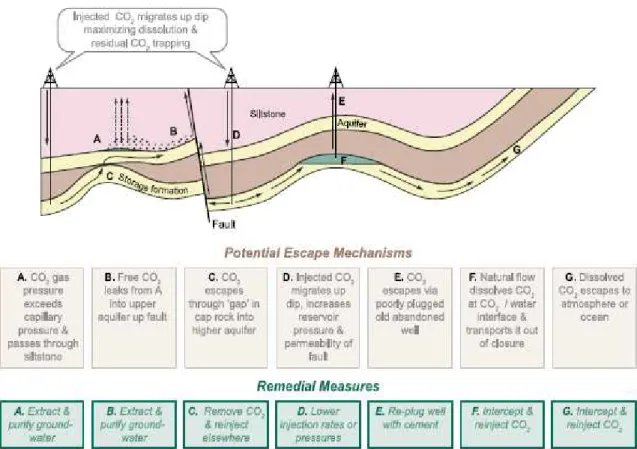
Figure 2.15 Some potential escape routes for CO2 injected into saline formations (IPCC, 2005)... 34
Figure 2.16 Scheme of potential GHG emissions sources in a CCS system (Adapted from (IPIECA and API, 2007)). ... 43
Figure 2.17 Potential emission reduction of a CCS project (Adapted from (IPIECA and API, 2007)). ... 45
Figure 2.18 – Efficiency penalty for CO2 capture in different power plants types (IEA, 2007)... 47
Figure 3.1- Variation in size and resolution of different storage capacities (Bachu et al., 2007)... 54
Figure 3.2 - High level resource pyramid for CO2 geological storage (Bradshaw et al., 2005)... 55
Figure 3.3 - Trap type and effectiveness resource pyramid for capacity for CO2 geological storage (Bradshaw et al., 2005). ... 55
Figure 3.4 - Techno-Economic resource pyramid (Bradshaw et al., 2005). ... 56
Figure 3.5 – Techno-economic pyramid after (Bradshaw et al., 2007) and (Bradshaw et al., 2005) (Bachu et al., 2007)... 58
Figure 3.6 Phases of the identification of a site for CO2 geological storage (Adapted from Chadwick et al., 2006)... 60
Figure 3.7 Steps for geochemical impacts assessment of the storage site (Adapted from Chadwick et al., 2006)... 65
Figure 3.8 – CO2 capture projects (http://www.co2captureandstorage.info/docs/IEAGHGccsworldmap.pdf). ... 68
Figure 3.10 Costs of CO2 transport against distance, for onshore and offshore pipelines,
and ships (IPCC, 2005)... 74
Figure 4.1 – GHG emissions in Portugal by sector in 2006 (adapted from Ferreira et al., 2008)... 78
Figure 4.2 - 2006 source categories of CO2 in mainland Portugal (from Ferreira et al., 2008)... 79
Figure 4.3 – Number of installations included in the NAP I (2005-2007) and in the NAP II (2008-2012) per sector (PNALE I, 2005) (PNALE II, 2008)... 80
Figure 4.4 – Emissions allowances (tCO2/year) attributed per sector in the NAP I (2005-2007) and in the NAP II (2008-2012) (PNALE I, 2005) (PNALE II, 2008). ... 81
Figure 4.5 - Sectoral emissions in 2007 (APA, 2008a)... 82
Figure 4.6 Installations mapping methodology. ... 83
Figure 4.7- Location of the 204 installations included in PNALE II per sector... 84
Figure 4.8 – The 24 LPS identified in mainland Portugal per sector (data from (APA; 2008b)). ... 86
Figure 4.9 – Location of the 24 LPS. ... 87
Figure 4.10 Mainland Portugal’s large morpho-structural units (Adapted from SNIRH, 2008)... 88
Figure 4.11 Portuguese inner and outer Mesocenozoic sedimentary basins (DPEP, 2008)... 89
Figure 4.13 – Sectors and annual CO2 emissions in megatons per year of the identified LPS (data from (APA; 2008b)). ... 93
Figure 4.14 – Location of the potential geological sinks in mainland Portugal... 95
List of Tables
Table 2.1 Capture toolbox (IPCC, 2005)... 14 Table 2.2 - Key parameters that determine the technical and economic operation of a CO2 absorption system (IPCC, 2005). ... 15
Table 2.3 Remediation options for geological CO2 storage projects (IPCC, 2005)... 36
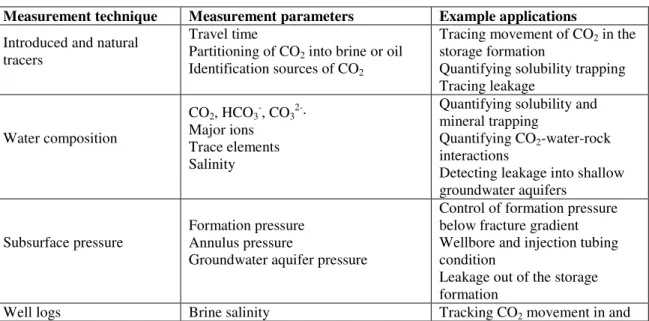
Table 2.4 Summary of direct and indirect techniques that can be used to monitor CO2
storage projects (IPCC, 2005). ... 40 Table 2.5 - Emissions sources, emission type and GHG species of a CCS system
(IPIECA and API, 2007). ... 44 Table 2.6 Power plant thermal efficiency and CO2 emissions in gas and coal-fired
power plants with and without CO2 capture (IEA, 2007)... 46
Table 2.7 Existent European legislation that can be also applied to CCS... 50 Table 3.1 - Estimation of the CO2 storage capacity in depleted oil and gas reservoirs,
deep saline aquifers and coal beds (Bachu et al., 2007)... 54 Table 3.2 - Technical and economic categories of the techno-economic resource
pyramid (Bradshaw et al., 2005) (Bradshaw, J., et al., 2007)... 57 Table 3.3- Technical and economic categories of the Bachu et al., 2007, version of the techno-economic resource pyramid (Bachu et al., 2007)... 58 Table 3.4 Geological criteria to storage site suitability (Chadwick et al., 2006). ... 61 Table 3.5 – CO2 storage projects (IPCC, 2005). ... 68
Table 3.6 Costs and plant characteristics for power with CO2 capture (Hendricks et al.,
2004)... 71 Table 3.7 Typical costs of CO2 capture for industrial plants (Hendricks et al., 2004). 71
Table 3.8 CO2 capture costs for existing and new pulverized-coal (PC) power plants
using current technology (IPCC, 2005)... 72 Table 3.9 Estimates of CO2 storage costs (IPCC, 2005). ... 75
1
Introduction
In this chapter, an introduction to the dissertation theme as well as the goals of the dissertation and its organisation is presented.
1.1
Background
The first evidences of the increase of carbone dioxide (CO2) concentration in the
atmosphere appeared in the 60’s and 70’s. In 1988, the World Meteorological Organisation and the United Nations Environment Programme created the Intergovernmental Panel on Climate Change (IPCC). The IPCC published its first report on climate change (IPCC First Assessment Report) in 1990, stating that global warming is real and that it is urgent to take measures to tackle it.
Figure 1.1 - Schematic diagram representing anthropogenic drivers, impacts of and responses to climate change, and their linkages (IPCC, 2007a).
The IPCC fourth assessment report on climate, published in 2007, states that even with emissions restraining within the next few decades climate change consequences are more likely to happen than not to happen. If the emissions remain at 2000 levels, the Earth average temperature is expected to increase 0,1 ºC per decade throughout the next century (IPCC, 2007a).
CO2 is the most important anthropogenic greenhouse gas (GHG) and its emissions level
rose from a pre-industrial level of about 280 ppm to 379 ppm in 2005 (IPCC, 2007b). In the 1995-2005 decade the average annual CO2 concentration growth rate was 1,9
ppm per year, being higher than the previous verified (1960-2005 average: 1,4 ppm per year). Fossil fuel combustion is the major source of the increasing atmospheric concentration of CO2 since the pre-industrial period. Land use change is another main
source, although smaller than fossil fuel combustion (IPCC, 2007b). In the 1970-2004 period there was an increase of about 70% in the emissions of the GHG covered by the Kyoto Protocol (KP) (CO2, N2O, CH4, SF6, PFCs, HFCs), CO2 being the largest source
The reduction of GHG emissions is one of the main climate change mitigation measures. Carbon capture and storage (CCS) is one of the possible mitigation measures, although it is recognized that no single category of mitigation measures is sufficient. Fossil fuels will continue to play a dominant role in power generation and combustion in industrial processes because they are relatively abundant, cheap, available and globally distributed (Bachu, 2007a). In the particular case of coal, it is abundant in North America, China and India, which are becoming the largest CO2 emitters in the
world (Bachu, 2007b). CO2 capture and geological storage is considered an option to
reduce emissions from the large stationary sources of CO2.
1.2
Goals
The objective of this study is to analyze the hypotheses for the implementation of CCS systems in mainland Portugal based on source-sink matching. This analysis will consider the CO2 large point sources (LPS) in mainland Portugal, because they are
considered main applicants to CCS.
The identification of CO2 LPS in mainland Portugal will be based on the installations
included in the Phase II of the European Emissions Trading Scheme (EU-ETS) corresponding to the Kyoto Protocol commitment period of 2008-2012, and on the verified annual CO2 emissions per installation.
The potential geological storage locations that will be considered are the geological formations identified in existing studies. After the mapping of LPS and potential geological sinks of mainland Portugal, an analysis based on the proximity of the sources and storage sites is performed. An estimation of the costs of implementing a CCS system in mainland Portugal is also attempted considering the identified LPS and storage areas.
Figure 1.2- Main steps of the method.
1.3
Dissertation organization
The dissertation is organized as follows:
Chapter 2 presents the literature search and review about CCS technological and environmental issues considering CO2 capture systems and technologies and transport,
CO2 storage, monitoring, mitigation and verification systems, environmental impact
assessment and risk evaluation, energy balance and the legal and political aspects related to CCS.
Criteria definition for the identification of CO2 large
point sources in mainland Portugal
Chapter 2
Literature search and review about CCS technological and environmental issues
Identification of carbon dioxide stationary sources in mainland Portugal
Chapter 3
Literature search and review about the implementation of a CCS system
Chapter 4
Identification of the hypotheses for the implementation of a CCS system in mainland
Portugal – source sink matching
Localization of CO2 large point sources in mainland
Portugal
Localization of potential geological CO2 storage a in
mainland Portugal
Source-sink matching
Chapter 3 presents the literature search and review about the selection of CO2 storage
sites, the assessment of CO2 storage capacity, the process of identification of potential
sites for CO2 geological storage, namely deep saline aquifers and coal beds, CO2
sources and CCS costs.
Chapter 4 presents the hypotheses for the implementation of a CCS system in mainland Portugal, based on the source-sink matching, considering the proximity of the sources and storage sites. An attempt at estimating costs is also presented.
Chapter 5 presents and discusses the main conclusions of the previous chapters.
2
State of the art
This chapter intends to give a brief overview of CCS technological and environmental issues considering CO2 capture systems and technologies and transport, CO2 storage,
monitoring, mitigation and verification systems, environmental impact assessment and risk evaluation and energy balance, as well the legal and political aspects related to CCS.
2.1
Problem definition
From a simple conceptual perspective, a CCS system has three phases: capture, transport and storage. However, in each of these phases not only technological characteristics but also to environmental and safety aspects have to be considered. In the implementation of a CCS system as a mitigation option, costs as well the energy balance and consequently the net GHG emissions are high weighted decision factors. All these technological and environmental issues make CCS a complex system.
Combustion systems like power plants, gas processing, cement, iron and steel production plants and refineries are the main stationary sources of CO2 emissions.
Figure 2.1 shows the share of largest key CO2 source categories in 2006 for EU-15.
Iron and Steel production
2% Cement
production 2% Petroleum
refining 3%
Commercial/Inst. 5%
Residential 12%
Manufact. Ind. And Construction
16%
Road transportation
23% Other
8%
Public Electricity and Heat production
29%
The first international step to tackle climate change happened in 1992 with the establishment of the United Nations Framework Convention on Climate Change (UNFCCC) whose ultimate objective is to achieve “(…) stabilization of greenhouse gas concentrations in the atmosphere at a level that would prevent dangerous anthropogenic interference with the climate system”. UNFCCC has been accepted in 1994 and has today been ratified by 192 nations. The international climate negotiations under the UNFCCC lead to the adoption of the Kyoto Protocol in 1997. The Kyoto Protocol entered into force on 2005, and has been ratified until today by 183 Parties of the UNFCCC. The Kyoto Protocol shares the basic principles and institutions of the UNFCCC, but established binding targets of GHG emissions reduction for 37 industrialised countries and the European community. The overall target is a reduction of five per cent of GHG emissions against 1990 levels over the five-year period 2008-2012. In order to meet their targets, Parties must apply national measures and the Kyoto Protocol also established three market-based mechanisms: emissions trading scheme, the clean development mechanism and joint implementation. The EU target is a reduction of eight per cent of GHG emissions against 1990 levels over the first commitment period of the Kyoto Protocol (2008-2012). In this period Portugal is allowed to increase GHG emissions by 27% in relation to 1990 levels.
CO2 can be captured from installations that use of fossil fuels and/or biomass by four
different systems: capture from industrial process streams, post-combustion capture, oxy-fuel combustion capture and pre-combustion capture. CO2 can be transported in the
gas, liquid and solid stage and transported by tanks, pipelines and ships in gaseous and liquid stages. There are three potential CO2 storage methods: geologic storage, ocean
storage (direct release into the ocean water column or onto the deep seafloor) and industrial fixation of CO2 into inorganic carbonates (IPCC, 2005). Amongst the
geological CO2 storage reservoirs types are deep saline formations, depleted natural gas
reservoirs, depleted oil reservoirs, deep unmineable coal seams, deep saline-filled basalt formations and others like salt caverns, organics shales and methane hydratebearing formations (Dooley et al., 2006).
A CCS system has also to be analysed in terms of the environmental impacts and risks, considering the operational, closure and post closure phases. The remediation options in case of CO2 leakage from the storage location are defined in this stage. For all of the
and storage providing crucial information to the operational system and to environment impact assessment and risk management (NETL, 2008).
As the implementation of a CCS system requires additional energy, an emissions and energy balance is required to assess its mitigation potential. The costs also have to be assessed to all the components of the CCS systems: capture and compression, transport, injection and storage, including monitoring costs and remediation costs if necessary. Another important aspect is how the application of a CCS system will reflect in the cost of the final product, like electricity in the case the system is applied on a power plant.
In Figure 2.2 , the technical components of CCS and the respective state of development are presented.
Figure 2.2 – Technical components of CCS (Fernando et al., 2008).
The legal and regulatory aspects of CCS are of major importance. However, CCS has not been yet subjected to an effective framework including legal and regulatory templates and guidelines at national or international level, particularly concerning long-term issues. This is a big constraint and until today the regulatory issues have been defined on a case-by-case basis (Robertson et al., 2006). In 2008, the European Commission (EC) published a proposal for a directive1 on the geological storage of
1COM (2008) 18 final – Proposal for a Directive of the European Parliament and of the Council on the
CO2. Part of the existent European legislation can be applied to CCS and the proposal of
directive establishes which terms of the existing legislation should apply to which aspects of CCS. With the international climate change negotiations, CCS is not explicitly included in the UNFCCC or the KP.
The criteria for the selection of CO2 storage sites and matching with CO2 sources are,
according to Bachu, 2007b: “volume, purity and rate of the CO2 stream; proximity of
the source and storage/storage sites; level of infrastructure for CO2 capture and delivery;
existing wells, for injection and for leak prevention; injection and production strategies; terrain and right of way; proximity to population centres; and overall costs, and economics” (Bachu, 2007b). Beyond these technical suitability criteria, further considerations on source-sink matching are controlled by economic, safety and environmental aspects. According to the IPCC Special Report on CCS “assigning technical risks is important for matching of CO2 sources and storage sites, for five risk
factors: storage capacity, injectivity, containment, site and natural resources” (IPCC, 2005).
The analysis that will be performed in this study will be based on the proximity of the CO2 sources and storage sites. This analysis will consider the CO2 large point sources in
mainland Portugal, because they are considered main applicants to CCS. To classify the mainland Portugal LPS, the chosen criterion is the identification of the group of installations with the highest CO2 emissions until representing about 90% of the total
CO2 emissions verified in 2007. The potential geological storage locations that will be
considered are the prior geological formations identified in a preliminary study of The National Institute of Engineering, Technology and Innovation (INETI – Instituto Nacional de Engenharia, Tecnologia e Inovação) and the Douro coalfield basin, which is being studied for CO2 sequestration by the Global Change, Energy, Environment and
Bioengineering RDID&D Unit (CIAGEB) from the Fernando Pessoa University.
2.2
Carbon dioxide capture systems and technologies
2.2.1 CO2 capture technologies
CO2 capture systems use many of the technologies used for gas separation which are
integrated into the referred CO2 capture systems. Among capture technologies are
separation with sorbents /solvents, separation with membranes and separation by cryogenic distillation.
In CO2 separation with sorbents/solvents, the gas contacts with a solid sorbent or a
liquid absorbent that has the capacity to capture CO2. A general scheme of this
separation process is presented in Figure 2.3.
Figure 2.3 - General scheme of separation with sorbents/solvents (IPCC, 2005).
During the process the sorbent within the captured CO2 is transported to another vessel
and the CO2 is released after a change in the conditions around the sorbent (which can
be temperature increase, pressure decrease or other). This process step is called regeneration. Following regeneration, the resultant sorbent is cyclically sent back to capture more CO2, if the sorbent is liquid. When the sorbents are solid, sorption and
regeneration occur by cyclic changes in the vessel where the sorbent is contained. During the process a make-up of fresh sorbent is necessary to compensate the decay of activity or losses. The spent sorbent circulates to another vessel where it is re-oxidized for reuse. This capture technology has a problem: as the flow of sorbent between vessels is large, large size equipment and energy is required, implying added cost and efficiency penalty (IPCC, 2005).
As membranes allow selective permeation, it is possible to use them to separate different gases. Membrane selectivity to different gases depends on the material, but the pressure difference across the membrane drives the flow of gas through it. This technology can have different applications in a CO2 capture system. It allows
separating H2 from a fuel gas stream, CO2 from a range of process streams or O2 from
air (to aid the production of a highly concentrated CO2 stream) (IPCC, 2005). A
Figure 2.4 - General scheme of separation with a membrane (IPCC, 2005).
In CO2 separation by cryogenic distillation, after a series of compression, cooling and
expansion steps, a gas can become liquid. In the liquid form the gas components can be separated in a distillation column, as demonstrated in Figure 2.5 .
Figure 2.5 - General scheme of separation by cryogenic distillation (IPCC, 2005).
This technology can be applied in different CO2 capture systems like oxy-fuel
combustion and pre-combustion capture (IPCC, 2005).
2.2.2 CO2 capture systems
CO2 can be captured from installations that use of fossil fuels and/or biomass by four
different systems: capture from industrial process streams, post-combustion capture, oxy-fuel combustion capture and pre-combustion capture. CO2 is produced in several
industrial processes like natural gas sweetening, steel, hydrogen, ethanol, cement and ammonia production, fermentation processes for food and drink processes. As these industrial processes emit large CO2 quantities, they represent opportunities to capture it.
In post-combustion capture, CO2 from flue gas produced by fossil fuels and/or biomass
combustion can be captured. In the oxy-fuel combustion capture, as in combustion, almost pure oxygen is used instead of air, originating a flue gas composed mainly of H2O and CO2, being readily captured. In pre-combustion capture2, a hydrocarbon reacts
to produce separate streams of CO2 for storage and H2. (IPIECA and API, 2007) (IPCC,
2005). The four capture systems are illustrated in Figure 2.6.
Figure 2.6 - Carbon dioxide capture processes in the four capture systems (IPIECA and API, 2007).
Table 2.1 Capture toolbox (IPCC, 2005). Separation
task Technologies Capture Solvents (Absorption) Membranes
Solid
sorbents Cryogenic
Current Physical solvents
Chemical solvents Polymeric
Zeolites Activated carbon Ryan-Holmes process Process streams
(CO2/CH4) Emerging
Improved solvents Novel contacting equipment Improved
design of processes
Ceramic Facilitated transport Carbon Contactors
Current Chemical solvents Polymeric Activated Zeolites
carbon Liquefaction
Post-combustion capture
(CO2/N2) Emerging
Improved solvents Novel contacting equipment Improved
design of processes
Ceramic Facilitated transport Carbon Contactors Carbonates Carbon based sorbents Hybrid processes Current n. a. Polymeric Activated Zeolites
carbon
Distillation
Oxy-fuel combustion
capture
(O2/N2) Emerging
Biomimetic solvents, e.g. hemoglobinederivatives Ion transport membranes Facilitated transport Adsorbents for O2/N2 separation, Perovskites Oxygen chemical looping Improved distillation
Current Physical solvents
Chemical solvents Polymeric
Zeolites Activated carbon Alumina Liquefaction Pre-combustion capture
(CO2/H2) Emerging
Improved solvents Novel contacting equipment Improved
design of processes
Ceramic Palladium Reactors Contactors Carbonates Hydrotalcites Silicates Hybrid processes
Notes: Processes shown in bold are commercial processes that are currently preferred in most circumstances. Some process streams involve CO2/H2 or CO2/N2 separations but this is covered under pre-combustion capture and post-combustion capture.
Post-combustion capture
Large scale combustion systems fired with fossil fuels generate huge flows of gases due to the high nitrogen concentration in air, the low pressure and the large scale of the units. The CO2 concentration in flue gas (product of combustion) depends on the type of
fuel that is used in combustion. Post-combustion capture systems can be applied to combustion systems with any type of fuel. The fuel impurities are very important for the plant design and costs calculation because the plant may have to have additional units to remove it prior to CO2 capture, like in absorption-based processes (IPCC, 2005).
common option to post-combustion capture, the absorption processes based on chemical sorbents, which is commercially available (IPCC, 2005).
The absorption processes in post-combustion capture take advantage of the reversibility of chemical reactions between an aqueous alkaline solvent, normally amine, with an acid or sour gas (IPCC, 2005). Table 2.2 presents the key parameters that determine the technical and economic operation of a CO2 absorption system.
Table 2.2 - Key parameters that determine the technical and economic operation of a CO2 absorption
system (IPCC, 2005).
Flue gas flow rate Determines the size of the absorber which represents a substantial contribution to the overall cost. CO2 content in flue gas
Flue gas is usually at atmospheric pressure and the partial pressure of CO2 will be as low as 3-15 kPa – at these conditions, aqueous amines
are the most suitable absorption solvents.
CO2 removal
CO2 recoveries are in practice between 80% and 95%. “The exact
recovery choice is an economic trade-off, a higher recovery will lead to a taller absorption column, higher energy penalties and hence increased costs” (IPCC, 2005).
Solvent flow rate Determines the size of most equipment apart from the absorber.
Energy requirement
“The energy consumption of the process is the sum of the thermal energy needed to regenerate the solvents and the electrical energy required to operate liquid pumps and the flue gas blower or fan. Energy is also required to compress the CO2 recovered to the final
pressure required for transport and storage” (IPCC, 2005).
Cooling requirement
“Cooling is needed to bring the flue gas and solvent temperatures down to temperature levels required for efficient absorption of CO2.
Also, the product from the stripper will require cooling to recover steam from the stripping process” (IPCC, 2005).
The post-combustion based on absorption processes has a high energy requirement resulting in a penalty on power cycles efficiency. The high energy requirement of this process is mainly due to “the heat necessary to regenerate the solvent, steam use for stripping and to a lesser extent the electricity required for liquid pumping, the flue gas fan and finally compression of the CO2 product” (IPCC, 2005). Other solvents for the
absorption process are being studied aiming to make it less energy consuming. Other technologies of post-combustion capture like adsorption processes, membranes and solid sorbents are also being developed (IPCC, 2005).
Pre-combustion capture
oxidation” (when applied to gaseous and liquid fuels) or ‘gasification’ (when applied to a solid fuel) (2). After this step occurs a reaction to convert CO to CO2 adding steam (3)
(IPCC, 2005).
Steam reforming
CxHy + xH2O ↔ xCO + (x+y/2)H2 ∆H +ve (1)
Partial oxidation
CxHy + x/2O2 ↔ xCO + (y/2)H2 ∆H –ve (2)
Water Gas Shift Reaction
CO + H2O ↔ CO2 + H2 ∆H -41 kJ mol-1 (3)
Then the CO2 is removed from the mixture produced in reaction 3. “The concentration
of CO2 in the input to the CO2/H2 separation stage can be in the range 15-60% (dry
basis) and the total pressure is typically 2-7 MPa. The separated CO2 is then available
for storage” (IPCC, 2005).
The pre-combustion capture can have two applications: it can be used in the production of a carbon-free fuel (hydrogen) or to decrease the carbon content of fuels, with the excess carbon (usually removed as CO2) being made available for storage (IPCC, 2005).
Among the existing technologies for H2 production with CO2 capture are: steam
reforming of gas and light hydrocarbons, partial oxidation of gas and light hydrocarbons, auto-thermal reforming of gas and light hydrocarbons, gas heated reformer, gasification of coal, petroleum residues, or biomass, integrated gasification combined cycle (IGCC) for power generation, hydrogen from coal with CO2 capture,
carbon-based fuels and multi-products, pressure swing adsorption, chemical solvent processes and physical solvent processes. There are also several emerging technologies in both natural gas reforming and coal gasification like sorption enhanced reaction, membrane reactors for hydrogen production with CO2 capture, micro channel reformer,
Oxy-fuel combustion capture systems
In the oxy-fuel combustion process the combustion of a hydrocarbon or a carbonaceous fuel (that can be biomass) in pure oxygen or in a mixture of pure oxygen and a CO2-rich
recycled flue gas eliminates nitrogen from the flue gas. The combustion temperature3 of fuel combustion with pure oxygen is about 3500°C while in an typical gas turbine cycle it is about 1300-1400°C and in an oxy-fuel coal-fired boiler it is about 1900ºC. The flue gas is constituted mainly of CO2, water vapour and oxygen in excess, which is
necessary to guarantee the complete fuel combustion. The CO2 content in the net flue
gas is about 80-98% depending on the fuel and the oxy-fuel combustion process. The efficiency of oxy-fuel combustion systems to capture CO2 is very near to 100%.
Although is still necessary to develop this technology to a commercial scale (IPCC, 2005).
The oxy-fuel combustion systems can be classified according to “how the heat of combustion is supplied and whether the flue gas is used as a working fluid” (IPCC, 2005) in: oxy-fuel indirect heating – steam cycle, oxy-fuel direct heating – gas turbine cycle and oxy-fuel direct heating – steam turbine cycle. In oxy-fuel combustion systems oxygen is a requisite and the existing large scale production methods are: cryogenic oxygen production and high temperature oxygen ion transport membranes (IPCC, 2005).
2.2.3 CO2 capture in power plants
A large percentage of the electricity that is produced worldwide has origin in fossil-fuel power plants. According to the International Energy Agency scenarios, fossil fuels will continue to play an important role in electricity production (IEA and OECD, 2003). Fossil-fuel power plants are responsible for about one third of total global CO2
emissions. So they are major candidates for the application of CCS. There is a variety of techniques that could be applied to various types of large-scale power plant and industrial activities fired on fuels but as originally most of these techniques were not developed for CCS, further research and development is required until they are considered viable IEA and OECD, 2003).
3 “The combustion temperature is controlled by the proportion of flue gas and gaseous or liquid-water
Post-combustion capture in power plants
Post-combustion capture uses a solvent to capture CO2 from the flue gas of power
plants that is then regenerated. These solvents can be physical, chemical or intermediate. Chemical solvents are less dependent on partial pressure than physical solvents are, and the partial pressure of CO2 in the flue gas is low (usually 4-14% by
volume). On the other hand, chemical solvents require more energy (as steam) to regenerate (to break the relatively strong chemical link between CO2 and the solvent)
(IEA, 2007)4.
The most mature option for post-combustion capture is the capture by amines absorption, which is a chemical solvent. For this reason amines are the most likely to be used for the first generation of CO2 post-combustion capture. In this technology the
presence of oxygen can be a problem because it causes the degradation of some solvents and the corrosion of equipment. To avoid this problem, inhibitors can be mixed into the solvent to counteract the oxygen activity. The concentration of oxides of nitrogen and sulphur (NO2 and SOx) in the flue gas must be very low before it is scrubbed of CO2
because these two compounds can react with amines to form stable, non-regenerable salts, causing the steady loss of amine (IEA, 2007).
Currently the process of scrubbing CO2 with amines does not operate on the scale of
power plants (IEA, 2007). However, it is referred in (IEA, 2007) that increasing the technology to power plants scale is not considered a major problem. This study also mentioned that for large coal-fired power plants, a demonstration of these technologies is necessary. In these types of power plants the application of post-combustion CO2
capture requires an upstream de-NOx and flue gas desulphurisation5 (FGD) facilities
(IEA, 2007).
In a study made by the IEA GHG6, two post-combustion capture of CO2 processes were
assessed: monoethanolamine7 (MEA) and hindered amine solvent, concluding that the
4 Sterically hindered amines need less steam for regeneration (IEA, 2007). Hindered amines are chemical
compounds containing an amine functional group surrounded by a crowded steric environment. They have uses such as gas scrubbing, as stabilizers against light-induced degradation of polymers, and as reagents for organic synthesis (http://en.wikipedia.org/wiki/Hindered_amine).
5 Flue gas desulfurization (FGD) is the current state-of-the art technology used for removing sulfur
dioxide (SO2) from the exhaust flue gases in power plants that burn coal or oil to produce steam for the
steam turbines that drive their electricity generators.
(http://en.wikipedia.org/wiki/Flue_gas_desulfurization)
6 International Energy Agency Greenhouse Gas R&D Programme (http://www.ieagreen.org.uk/).
7 Monoethanolamine (MEA) is an organic chemical compound that is both a primary amine (due to an
hindered amine process loses less energy primarily due to the solvent consuming less heat for regeneration than MEA solvents (IEA, 2007).
Pre-combustion capture in power plants
In the pre-combustion capture process a fuel is reacted with air or oxygen to produce a fuel that contains CO and H2. Then in a shift reactor this reacts with steam to produce a
mixture of CO2 and H2. Subsequently the CO2 is separated and the H2 is as fuel (IEA,
2007).
This technology can be used for gas turbine combined cycles, in natural gas or coal based plants. The separated H2 is used as fuel in a gas turbine combined cycle. If coal is
the primary fuel and the key process is its gasification8, it is known as an integrated gasification combined cycle (IGCC) (IEA, 2007).
The IEA GHG assessed IGCC plants based on two types of gasifier: a slurry feed gasifier (in which the gas product is cooled by quenching with water) and a dry feed gasifier (in which the gas product is cooled in a heat recovery boiler). In an IGCC plant without CO2 capture and with a slurry feed gasifier, “the coal is ground and slurried
with water and then pumped to the gasifier vessels where it reacts with oxygen. The products from gasification are quenched with water, the saturated gas is cooled and condensed water and minor impurities are removed. The sulphur compounds are removed from the gas by passing it through a reactor and feeding it to a Selexol9 acid gas removal (AGR) plant. The clean fuel gas is fed to the gas turbine combined cycle plant” (IEA, 2007). If the IGCC plant has CO2 capture, “the gas from the gasifier is fed
to a CO2-shift converter prior to cooling and the Selexol unit removes CO2 as well as
sulphur compounds. The Selexol is regenerated to produce separate CO2 and sulphur
compounds steams. The CO2 stream is compressed and dried for transport by pipeline”
(IEA, 2007). In this process the removal rate of CO2 is 90%, meaning that an overall
CO2 capture rate of 85% can be achieved (IEA, 2007). In an IGCC plant without CO2
monoethanolamine acts as a weak base. MEA is used in aqueous solutions for scrubbing certain acidic gases. (http://en.wikipedia.org/wiki/Ethanolamine).
8 Gasification is the partial oxidation of a fossil fuel to a gas, often known as syngas, which main
components are CO and H2. Gasification acts as a bridge between the fossil fuel and gas turbines with the
target of high energy efficiency and minimum emissions to the environment. (IEA, 2007)
9 Selexol is a physical solvent, unlike amine based acid gas removal solvents that rely on a chemical
capture and with a dry feed gasifier, “the coal is dried, ground and then fed to the gasifier vessels. The gasifier product gas is quenched, cooled and then fed to a dry particulate removal unit. Some of the gas is recycled as quench gas and the remainder is scrubbed with water, reheated, the carbonyl sulfide (COS) is removed and it is fed to an MDEA (MethylDiEthanolAmine) solvent acid removal plant. The clean fuel gas is fed to the gas turbine combined cycled plant. The configuration of the plant with CO2
capture is the same except that the COS removal process is replaced by a two-stage shift converter and H2S and CO2 are separated in a Selexol AGR unit” (IEA, 2007).
Oxy-combustion capture in power plants
In the oxy-combustion capture process the fuel is combusted with nearly pure oxygen and recycled flue gas or CO2 and water/steam to produce a flue gas consisting
essentially of CO2 and water. This technology may have potential as a part of a system
for capturing and storing CO2 because the nitrogen concentration in the flue gas is much
lower than when air is used. This means that CO2 can be stored with less downstream
process (IEA, 2007).
The pulverised fuel-fired stations (PF) are a type of coal power station. The PF oxy-combustion plant uses the same steam conditions as the other post-oxy-combustion capture plant. This process requires a large amount of oxygen for combustion that is obtained from an air separation unit. The flue gas from oxy-combustion is compressed and cooled to separate nitrogen, oxygen and other impurities, obtaining a CO2 concentration
of about 95mol%. The NOX and SOX are converted to acid and condensed from the CO2
stream, so selective catalytic reduction10 (SCR) and FGD units may be not needed. Oxy-combustion capture technology is still in a relatively early stage of development but pilot plants are being built and the plans for the construction of commercial power are at an advanced stage (IEA, 2007).
2.3
CO
2transport
In comparison to CO2 capture and storage, the transport technology is considered
relatively mature. CO2 can be transported in the gas, liquid and solid stage and
10 Selective catalytic reduction (SCR) is a means of converting nitrogen oxides, also referred to as NOx
with the aid of a catalyst into diatomic nitrogen, N2, and water, H2O. A gaseous reductant, typically
anhydrous ammonia, aqueous ammonia or urea, is added to a stream of flue or exhaust gas and is absorbed onto a catalyst. Carbon dioxide, CO2 is a reaction product when urea is used as the reductant.
transported by tanks, pipelines and ships for gaseous and liquid stages at a commercial-scale. Dedicated CO2 pipelines are referred as the most efficient transport mode for
shipment (Fernando et al., 2008).
As a gas transported at a pressure close to the atmospheric pressure occupies a large volume, the gas must be compressed before the transport (IPCC, 2005). The compression of CO2 into a supercritical11 fluid makes it easier and cheaper to transport,
gas compression being a mature technology (Fernando et al., 2008).
The compressed gas occupies less volume and then is transported by pipeline, the volume being reduced by transporting at a high pressure. Other processes like liquefaction, solidification or hydration can reduce further the gas volume. Liquefaction being an established technology for gas transport by ship, this knowledge can be transferred to the transport of CO2 in the liquid stage. Solidification requires much more
energy than the other options. The commercially viable technologies are currently used for CO2 transport (IPCC, 2005).
2.3.1 CO2 pipeline transportation
In CO2 transportation by pipeline, the transport infrastructure has to be considered. For
a large scale CO2 transport a large pipelines network is required and important factors
such as the rights-of-way for the pipelines and security issues if they cross densely populated zones have to be carefully taken into account in the network design (IPCC, 2005).
CO2 pipeline transportation systems have several specifications: the minimum
percentage of CO2, the content of H2S, N2, NOx and SOx contaminants, the content of
water, oxygen and the adequate temperature and pressure. These specifications have to be determined beforehand and are very relevant to the transport phase because of the corrosion rate of the pipeline material. Field experience demonstrates that there are very few problems with transportation of high-pressure dry CO2 in carbon steel
pipelines. If relative humidity is inferior to 60%, dry CO2 does no corrode the carbon
manganese steel that is generally used for pipelines. In the presence of free water, corrosion rates are much higher. In practice it is unlikely that wet CO2 can be
11 Supercritical: at a temperature and pressure above the critical temperature and pressure of the
transported in low-alloy carbon steel pipeline due to the high corrosion rate in the presence of water. However if CO2 can not be dried, the pipeline material has to be of a
corrosion-resistant alloy. Although this is an established technology it may not be economically viable (IPCC, 2005).
After the CO2 is dried and all the transportation specifications and criteria are met, it is
measured and transported to the final destination (IPCC, 2005). In pipelines CO2 flow is
driven by pumps at high pressure and ambient temperature (IPIECA and API, 2007).
The pipeline design is determined by physical, environmental and social factors. The conceptual design considers the physical characteristics of product mixture characteristics, the optimal size and pressure, the mechanical material (valves, pumps, etc.), the topography, geotechnical considerations, among others. It also has to consider how the pipeline will accommodate existing and future infrastructure and will have to obey legal and regulatory requirements. After all these considerations the study is the basis of a safety review. Pipelines operational aspects are daily operations, maintenance, and health, safety and environment (IPCC, 2005).
2.3.2 CO2 transportation by ship
As already mentioned, pipelines are not the only option to CO2 transport. For small CO2
amounts the transport can occur by truck or rail. It can also be transported by ship but on a smaller scale. Ship transportation occurs in insulated containers at low temperatures and much lower pressures than pipeline transport (IPIECA and API, 2007). CO2 transportation by ship is usually more suitable for short distances and for
picking up CO2 from smaller and/or scattered sources (Fernando et al., 2008).
As a CCS system is a continuous system, CO2 transportation by ship must include a
temporary storage on land and a loading facility near the capture site. The delivery to the storage system depends on whether the delivery point is onshore or offshore. Thus the operational aspects of a marine transportation system include loading, transport to the site, unloading and return to the port (IPCC, 2005).
2.4
Carbon dioxide storage
CO2 geological storage refers to the process of injecting CO2 into deep reservoirs, where
physical and geochemical trapping mechanisms prevent the CO2 from migrating to the
disposal in geological media permanently and CO2 storage is its disposal in geological
media for significant time periods (Bachu, 2007a). A primary trapping requisite is a layer of impermeable caprock overlying the sequestration site. CO2 storage requires
cautious characterization of storage sites to ensure that CCS project can sequester CO2
for geologic periods of time (Fernando et al., 2008).
Generally CO2 is injected as a supercritical fluid that means it is dense as a liquid but
has a gas-like viscosity that allows it to flow very easily through the pipeline and into the storage site. In reservoirs at depths grater than 800 m, CO2 can be maintained as a
supercritical fluid (Dooley et al., 2006).
There are three potential CO2 storage methods: geologic storage, ocean storage (direct
release into the ocean water column or onto the deep seafloor) and industrial fixation of CO2 into inorganic carbonates (IPCC, 2005).
2.4.1 Underground geological storage
Geological storage of CO2 is a natural process in the Earth’s upper crust, where the CO2
derived from biological activity, igneous activity and chemical reactions between rocks and fluids accumulates in the subsurface as carbonate minerals, in solution or in a gaseous or supercritical form, either as gas mixture or pure. It is possible to store CO2
onshore and offshore. The injection into deep geological formations is achieved by pumping fluids down into a well (IPCC, 2005).
Among the geological CO2 storage reservoirs types are deep saline formations, depleted
Figure 2.7 - Options for storing CO2 in deep underground geological formations (IPCC, 2005). Hendricks et al., 2004, developed a series of methodologies to calculate the underground storage potential of different reservoir types. However, when storage capacity is mentioned, this does not mean that all storage capacity is currently available for CO2 storage12 (Hendricks et al., 2004). In Figure 2.8 and Figure 2.9, the results
achieved by Hendricks et al., 2004, are presented, relating the CO2 storage potential per
type of underground reservoirs and per world region.
Figure 2.8 - CO2 storage potential per type of
underground reservoirs (Hendricks et al., 2004).
Figure 2.9 - CO2 storage potential per world region
(Hendricks et al., 2004).
12This is due to many factors like: hydrocarbon fields may not already be exploited or are not yet empty;
The assessment of the potential of storage of CO2 in geological formations has mostly
been made at regional or global level. However, the levels of detail and assessment methods vary substantially, and besides an increase in knowledge about technical issues, there has also been an increase in the uncertainties associated with the details used in the assessment scheme (Bradshaw et al., 2004). Thus, and because one of the aims of capacity estimation is to guide policy directions, it is necessary that this estimations take into account several factors like injection depth and distance between source and sink (Bradshaw et al., 2004), and the range of trapping mechanisms that are possible at each site, considering its different geological constraints and the different time scales (Bradshaw et al., 2007).
Saline formations are deep sedimentary rocks saturated with formation waters or brines containing high concentration of dissolved salts. Due to the high salt concentration, these waters are unsuitable for agriculture and human consumption. However, the estimation of the storage capacity in deep saline formations is not simple because of the multiplicity, complexity and interactions of mechanisms that occur to store CO2 in these
formations. Among these mechanisms are physical trapping beneath low permeability caprock, dissolution and mineralization. They occur simultaneously and on different time scales. These reasons result in a main focus on physical trapping mechanisms and/or dissolution in the majority of estimates of CO2 capacity storage in deep saline
formations, making a simplifying assumption that no geochemical reactions occur simultaneous with CO2 injection, flow and dissolution (IPCC, 2005).
As oil and gas reservoirs have accumulated these in structural and stratigraphical traps over time, they are major candidates to CO2 storage. This also shows their integrity and
safety. Furthermore, the movement and displacement behaviour and trapping of hydrocarbons is well known and as the infrastructures are already in place they can be used to CO2 storage operations. Nevertheless these infrastructures have to be assessed to
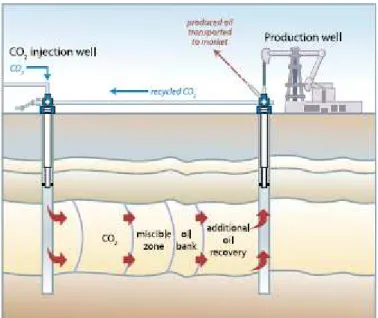
guarantee the safety of CO2 injection and storage. Enhanced oil recovery (EOR) by
CO2 injection provides potential economic benefits because of incremental oil
production, in average 13.2%. Usually, CO2 is separated from the produced oil and
reinjected into the formation, as demonstrated in Figure 2.10. For CO2 storage in EOR
operations, oil reservoirs need to meet additional criteria like depths greater than 600m. Enhanced gas recovery by CO2 injection could enhance gas recovery by repressurizing
the reservoir but some authors argue that CO2 injection might result in lower gas
been yet implemented on a pilot scale while there are several worldwide projects of CO2-EOR (IPCC, 2005).
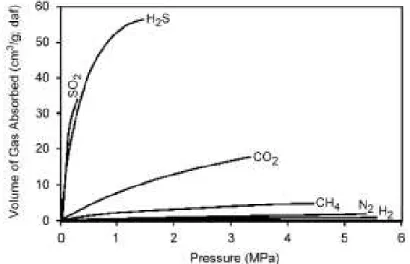
Figure 2.10 Injection of CO2 for enhanced oil recovery with some storage of retained CO2 (IPCC, 2005). Coal contains cleats that impart some permeability and between these, solid coal has a very large number of micropores into which gas molecules from the cleats can diffuse and be tightly adsorbed. Coal can physically adsorb many gases and has higher affinity to adsorb gaseous CO2 than CH4 (see Figure 2.11). Consequently when CO2 is injected
to coal, it seems it can displace CH4, thereby enhancing coal bed methane recovery
(ECBMR) (IPCC, 2005). Considering that the injected CO2 will replace the CH4 in coal
and will remain adsorbed in it, the freed CH4, also a GHG, has to be captured and may
be used as an energy source in ECBMR (Bachu, 2007). Compared to conventional recovery, CO2 – ECBM has the potential to increase the amount of produced methane to
Figure 2.11 – Adsorption of different gases on coal (Bachu et al., 2007a).
Before geological storage, CO2 must be compressed, generally as a supercritical fluid.
Due to the geothermal gradient13the density of CO2 increases with depth, until about
800m or greater, and the injected CO2 will be in a dense supercritical state (IPCC,
2005).
The subsurface geological formations are composed of transported and deposited rock grains organic material and minerals that form after the rocks are deposited. Pore spaces as well open cavities and fractures are occupied by fluid. Thus the injection of CO2 into
the pore spaces and fractures of a permeable formation can displace the in situ fluid or the CO2 can dissolve in or mix with the fluid or react with the mineral grains, or there
may be some combination of these processes (IPCC, 2005).
As injection increase the pressure near the well, CO2 occupies the pores initially filled
by the in situ formation fluids. The amount and spatial distribution of pressure depends on the rate of injection, the permeability and thickness of the injection formation, the presence or absence of low permeability barriers and the geometry of the hydrogeological system. After the injection, the primary flow and transport mechanisms that control the spread of CO2 include: migration in response to pressure gradients
created by the injection process; fluid flow in response to natural hydraulic gradients; buoyancy caused by the density difference between CO2 and the formation fluids;
diffusion; dispersion and fingering caused by formation heterogeneities and mobility contrast between CO2 and formation fluid; dissolution into the formation fluid;
mineralization; pore space trapping; and adsorption of CO2 onto organic material
(IPCC, 2005).
The rate of fluid flow depends on the number and properties of the fluid phases present in the formation - if CO2 is injected into a deep saline formation in a liquid or liquid-like
supercritical dense phase it is immiscible in water; if it is injected into a gas reservoir, it will locally form a miscible fluid phase of CO2 and natural gas. As supercritical CO2 is
much less viscous than water and oil, migration is controlled by the contrast in mobility of CO2 and the in situ formation fluids – because of the high mobility of CO2 only some
of the fluid will be displaced leading to an average saturation in the range of 30 -60 %. The comparatively large density differences between CO2 and water in deep saline
formations create strong buoyancy forces that drive CO2 upwards – in gas reservoirs, as
CO2 is denser than natural gas, it will migrate downwards under buoyancy forces. The
existence of a low permeability layer forms a barrier, slowing the upwards migration of CO2, as it migrates laterally filling any stratigraphical or structural trap it encounters
(IPCC, 2005).
During the migration through the formation, some of the CO2 dissolves into the
formation water. The time of dissolution depends on the flow of the formation water, taking much longer time in formations with no flow because of the absence of contact with unsaturated water. After CO2 is dissolved in the formation fluid it will migrate with
the groundwater flow. Water saturated with CO2 is slightly denser, depending on the
salinity of the original formation water. The solubility of CO2 in brine decreases with
increasing pressure, decreasing temperature and increasing salinity. During migration, CO2 is also retained in pore spaces by capillary forces, dissolving over time in the
formation water (IPCC, 2005).
CO2 effective permanence on geological formations depends on the existent trapping
mechanisms, the most effective sites being those where CO2 is trapped under a tick, low
permeability seal, or is converted to solid minerals, or is adsorbed on the surfaces of coal micropores. CO2 trapping depends on a combination of physical and geochemical
trapping mechanisms (IPCC, 2005). According to Bachu, 2007a, physical trapping of CO2 occurs when it is immobilised as a free gas or supercritical fluid depending on the
available storage volume; and chemical trapping of CO2 can occur as adsorption