Revista Brasileira de Fisioterapia
O
RIGINALA
RTICLE479 479
Behavior of respiratory muscle strength in
morbidly obese women by using different
predictive equations
Comportamento da força muscular respiratória de obesas mórbidas por diferentes
equações preditivas
Eli M. Pazzianotto-Forti1,2, Fabiana S. Peixoto-Souza1, Camila Piconi-Mendes2, Irineu Rasera-Junior3, Marcela Barbalho-Moulim4
Abstract
Background: Studies on the behavior of respiratory muscle strength (RMS) in morbidly obese patients have found conflicting results.
Objectives: To evaluate RMS in morbidly obese women and to compare the results by using different predictive equations. Method:
This is a cross-sectional study that recruited 30 morbidly obese women and a control group of 30 normal-weight women. The subjects underwent anthropometric and maximal respiratory pressure measurement. Visual inspection of the Bland-Altman plots was performed to evaluate the correlation between the different equations, with a p value lower than 0.05 considered as statistically significant. Results:
The obese women showed a significant increase in maximal inspiratory pressure (MIP) values (-87.83±21.40 cmH2O) compared with
normal-weight women (-72±15.23 cmH2O) and a significant reduction of MIP (-87.83±21.40 cmH2O) according to the values predicted
by the EHarik equation (-130.71±11.98 cmH2O). Regarding the obtained maximal expiratory pressure (MEP), there were no
between-group differences (p>0.05), and no agreeement was observed between obtained and predicted values of MEP and the ENeder and ECosta equations. Conclusions: Inspiratory muscle strength was greater in the morbidly obese subjects. The most appropriate equation for calculating the predicted MIP values for the morbidly obese seems to be Harik-Khan equation. There seem to be similarities between the respiratory muscle strength behavior of morbidly obese and normal-weight women, however, these findings are still inconclusive.
Keywords: morbid obesity; maximal respiratory pressures; respiratory muscles; reference values; physical therapy.
Resumo
Contextualização: Estudos sobre o comportamento da força muscular respiratória (FMR) em obesos mórbidos têm produzido
resultados conflitantes. Objetivos: Avaliar a FMR de obesas mórbidas e comparar com os valores preditos por diferentes equações
matemáticas encontradas na literatura. Método: Estudo transversal realizado com 30 obesas mórbidas e grupo controle constituído
por 30 eutróficas. Foram avaliadas as características antropométricas e as pressões respiratórias máximas. Foi utilizada análise visual de Bland-Altman para avaliar o viés de concordância entre as equações estudadas, considerando significativo p<0,05.
Resultados: As obesas mórbidas apresentaram aumento significativo nos valores obtidos de pressão inspiratória máxima (PImáx) (-87,83±21,40 cmH2O) em comparação com as eutróficas (-72±15,23 cmH2O) e redução significativa da PImáx (-87,83±21,40 cmH2O)
segundo os valores previstos pela equação EHarik (-130,71±11,98 cmH2O). Quanto à pressão expiratória máxima (PEmáx), não houve
diferenças nos valores obtidos entre os grupos (p>0,05), assim como não foram observadas concordâncias dos valores obtidos e previstos de PEmáx segundo as equações ENeder e ECosta. Na análise de Bland-Altman, foi observada maior validade na equação de Harik-Khan para predizer a PImáx nas obesas, já, para a predição da PEmáx, não foi possível visualizar qual das equações apresentou maior validade. Conclusões: Mulheres obesas mórbidas apresentaram maior força muscular inspiratória do que eutróficas. Das três equações utilizadas, a de Harik-Khan parece ser a mais apropriada para calcular os valores de referência das medidas de Plmáx para obesas mórbidas. Mulheres obesas mórbidas e eutróficas parecem apresentar semelhança no comportamento da força dos músculos expiratórios, entretanto esses achados são inconclusivos.
Palavras-chave: obesidade mórbida; pressões respiratórias máximas; músculos respiratórios; valores de referência; fisioterapia.
Received: 01/10/2012 – Revised: 03/15/2012 – Accepted: 06/26/2012
1Postgraduate Physical Therapy Program, Universidade Metodista de Piracicaba (UNIMEP), Piracicaba, SP, Brazil 2Faculty of Physical Therapy, Universidade Metodista de Piracicaba (UNIMEP), Piracicaba, SP, Brazil
3Gastroenterology and Obesity Surgery Center of Piracicaba, Piracicaba, SP, Brasil
4Postgraduate Physical Therapy Program, Universidade Federal de São Carlos (UFSCar), São Carlos, SP, Brasil
480
Introduction
Obesity is the most common metabolic disease worldwide, and its prevalence has been strongly increasing1. Obesity is
considered a signiicant risk factor for cardiovascular diseases, type 2 diabetes, rheumatoid arthritis and neoplasms2-4. Obesity
is also associated with the development of respiratory diseases such as sleep apnea and hypoventilation syndrome3.
Studies on the behavior of respiratory muscle strength (RMS) in morbidly obese patients have produced conlicting results. Ac-cording to Magnani and Cataneo5,neither excess body mass nor
fat distribution in the upper region promote respiratory muscle dysfunction. On the other hand, respiratory muscle dysfunction has been reported in this population, which could be due to an increase in tensile strength caused by excessive adipose tissue in the thoracic cage and abdomen that could lead to a mechanical disadvantage in the respiratory muscles6,7.
However, there are also reports that RMS increases in mor-bidly obese patients, which could be justiied by adaptations in the skeletal muscle ibers and the musculoskeletal structures due to the daily physical efort involved in movement and in maintaining the body in an erect position8,9. Tanner et al.10
investigated rectus abdominis muscle ibers in obese during bariatric surgery, and found a high percentage of type II ibers, which are related to low resistance and high contraction power.
A reduction in respiratory muscle strength may delay or compromise postoperative evolution in the morbidly obese patients, especially those who underwent to bariatric surgery11.
It is known that RMS is associated with age, gender, body mass, height and body surface area12. In this context, equations have
been formulated to obtain predictive values for normal RMS in diferent populations13, but not for obese patients.
However, there is no study that either provides recommended RMS values speciically for the morbidly obese population or that indicates which of the mathematical formulas available in the literature best apply to this population. herefore, the objec-tives of this study were to evaluate this population’s RMS and to compare these estimates with the predictive values for diferent mathematical equations available in the literature.
Method
Population studied
his cross-sectional study involved 60 adult women who were divided into 2 groups of 30 participants each: a morbidly
obese group (BMI 44.7±4.11 kg/m²) and a normal-weight control group (BMI 22.1±1.8 kg/m²). he volunteers were told about the study’s objectives and signed an informed consent form. he study was approved by the Research Ethics Commit-tee of the Universidade Metodista de Piracicaba (UNIMEP), Piracicaba, SP, Brazil, (reference number 19/10).
he morbidly obese women were screened in a Bariatric Clinic where meetings were held with the multidisciplinary team to prepare for gastroplasty, and the normal-weight women were recruited from the community with an invitation to participate in the study.
he inclusion criteria were: morbidly obese women (BMI≥40 kg/m2) and normal-weight women (BMI between 18.5
and 24.9 kg/m2) aged between 25 and 50 years with a sedentary
lifestyle, (i.e., scoring up to 816 on the Baecke, Burema and Frijters
Questionnaire14 (validated in Brazil by Florindo and Latorre15)),
with no comorbidities such as systemic arterial hypertension, diabetes, cardiovascular or pulmonary diseases, with no altera-tions in the thoracic and/or abdominal region that would afect respiratory dynamics, who did not use tobacco and who could understand how to perform the maneuvers.
Pre-operative medical records were used to verify that there were no comorbidities among the morbidly obese participants. he health status of normal-weight volunteers was determined using standardized questions based on current guidelines for pulmonary function tests17.
To verify that the volunteers had no respiratory disorders, spirometric testing, i.e., forced vital capacity (FVC), forced ex-piratory volume in the irst second (FEV1) and FEV1/FVC rate above 80%, were conducted. To perform the tests, an ultrasonic computerized spirometer with a low sensor (Microquark;
Cosmed, Roma, Italy) was used according to American horacic
Society guidelines18. Values were expressed as a percentage of
the predicted Brazilian population estimates19.
Anthropometric evaluation
he volunteers were barefoot and wearing light clothing, remained in an upright standing position for the anthropo-metric assessments. Body weight was measured using a prop-erly calibrated digital scale (Filizola®
, Brazil) with a 300 kg maximum capacity and an absolute error (precision) of 100 g. Height was veriied using a wall stadiometer (Wiso) with a resolution in millimeters.
he BMI was calculated using the weight/height2 (kg/m2)
equation. Neck circumference (NC) was measured at the cri-coid cartilage level20. Waist circumference (WC) was measured
481
upper margins of the iliac crest. Hip circumference was meas-ured at the level of the greater trochanter of the femur21.
Evaluation of maximal respiratory pressures
An analog vacuum manometer (Critical Med, USA, 2002) with an operating range of 0 to ±300 cmH2O was used to measure maximal respiratory pressure (MRP). This model is composed by a hard plastic mouthpiece with a small hole of 2 mm in internal diameter, which serves as a relief valve for preventing elevated pressure in the oral cavity due to the simultaneous contraction of facial mus-cles and the closing of the glottis22. A disposable cardboard
mouthpiece was used (De Marchi).
Before testing, the volunteers were shown the correct way to perform the maneuvers, i.e., keeping the lips irmly in place around the mouthpiece so that no air could escape23.
Maximal inspiratory pressure (MIP) was measured from the residual volume, and maximal expiratory pressure (MEP) was measured from the total lung capacity. There was a 1 min interval between measurements24. The
volun-teers were instructed to avoid puffing out their cheeks in order to prevent air leakage. The position reached at the end of the maximal force was maintained to ascertain plateau pressure25. While performing these measurements,
the volunteers remained seated with their feet supported and used a nose clip.
All volunteers performed a minimum of three, and maxi-mum of ive times of the maximal inspiration and expiration maneuver, provided each maneuver was technically accept-able and reproducible, i.e., without air leakage, sustained for at least 1 second and similar to the other values (≤10%). When an exceptionally high value (>10% above previous attempts) was obtained in the inal maneuver, the test continued until a value close to it (≤10%) was obtained. As such, the number of maneuvers could exceed ive attempts. he highest value was used in the data analysis25,26.
he values obtained for maximal respiratory pressures were compared to the predicted values for MIP and MEP using the equations proposed by Harik-Khan, Wise and Fozard12, Neder
et al.25 and Costa et al.27, as described below:
Harik-khan (EHarik): Harik-Khan, Wise and
Fozard
12Equation
Women: MIP=171-0.694 x age +0.861 x body mass (kg) -0.743 x height (cm)
Neder (ENeder): Neder et al.
25Equation
Women: MIP=-0.49 x age+110.4 MEP=-0.61 x age +115
Costa (ECosta): Costa et al.
27Equation
Women: MIP=-0.46 x age +74.25 MEP=-0.68 x age+119.35
Statistical analysis
Data distribution was veriied using the Shapiro-Wilk test, and once normality was conirmed, the data were expressed as means and standard deviations.
To compare the anthropometric characteristics, physical activity level and RMS values obtained between the groups, Student’s t-test was used for parametric data and the Mann-Whitney test for non-parametric data.
To compare the MIP and MEP values obtained with those pre-dicted for subjects of normal weight, the Friedman test was used for MIP, and repeated measures ANOVA with Bonferroni post-hoc
was used for MEP. For the morbidly obese, repeated measures ANOVA with Bonferroni post-hoc was used for MIP and MEP.
Visual inspection of the Bland-Altman plots was carried out to evaluate the agreement bias between the equations studied. he statistical signiicance level adopted was p<0.05. All statistical procedures were performed in BioStat 5.0 and
Medcalc 12.2.1 (MedCalSoftware, Mariakerke, Belgium).
Results
Table 1 shows that there were no between-group statisti-cal diferences in age or height. In relation to body mass, BMI, WC, WHR and NC, the morbidly obese women had signii-cantly higher values than the normal-weight subjects. here were no between-group signiicant diferences in the FVC and FEV1/FVC ratio values; FEV1 was signiicantly lower in the obese women. here were no signiicant diferences found in the volunteers’ physical activity level (Table 1). he morbidly obese subjects returned signiicantly higher MIP values than those of normal weight.
482
signiicantly higher than those obtained. here was no difer-ence between the values obtained and those predicted by the ENeder equation; the values predicted by the ECosta equation were signiicantly lower than those obtained. here was a sig-niicant diference between the values predicted by the three equations, as shown in Table 2.
Regarding the normal-weight volunteers, there was no diference in the values obtained and those predicted by the EHariK equation; the values predicted by the ENeder equation were signiicantly higher than those obtained, and the values predicted by the ECosta equation were signiicantly lower than those obtained (Table 2).
here were no between-group diferences in the obtained MEP values. However, there was a signiicant statistical difer-ence between the MEP values obtained and those predicted by the ENeder and ECosta equations. here was no diference between the equations for predicted MEP values (Table 3).
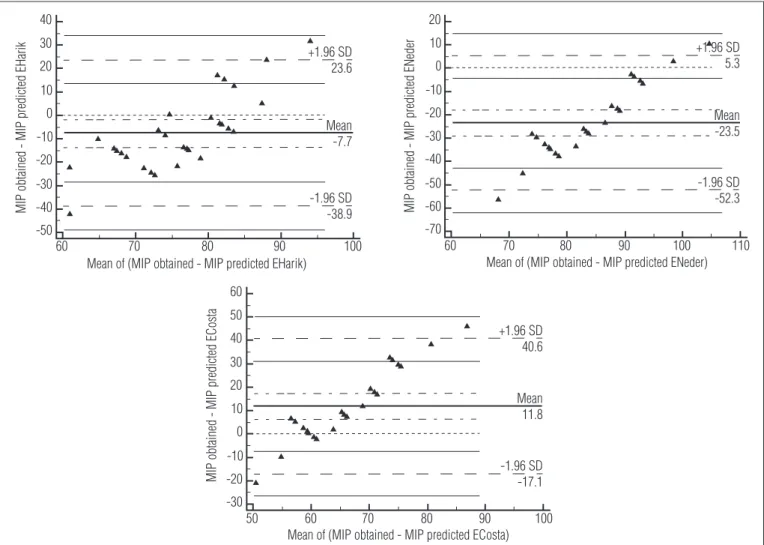
For MIP, the statistical graph analysis from the Bland-Altman test between the obtained values and those predicted by the EHarik equation showed a mean diference of -7.7 cmH2O and an agreement interval of -38.9 cmH2O to 23.6 cmH2O. he obtained values and those predicted by the ENeder equation produced a mean diference of -23.5 cmH2O and an agreement interval of -52.3 cmH2O to 5.3 cmH2O. he obtained values and those predicted by ECosta showed a mean diference of 11.8 cmH2O and an agreement interval of -17.1 cmH2O to 40.6 cmH2O. Regarding MEP, the Bland-Altman graph analysis between the obtained values and those predicted by ENeder showed a mean diference of 14.4 cmH2O and an agreement interval of -53.2 cmH2O to 24.1 cmH2O. he values obtained
and those predicted by ECosta showed a mean diference of -16.1 cmH2O and an agreement interval of -54.9 cmH2O to 22.6 cmH2O (Figures 1 and 2).
Discussion
he analysis of RMS parameters becomes relevant espe-cially when the morbidly obese individual is a candidate for gastroplasty surgery28. According to Barbalho-Moulin et al.29,
respiratory muscle dysfunction is the main cause of pulmo-nary complications after abdominal surgery and, because of this, respiratory muscle training is recommended. his study is informative for physical therapists and health professionals regarding the diiculties in using predictive RMS formulas that do not take body mass into account.
Respiratory muscle function can be severely compromised with obesity, which is due to the load placed on the diaphragm muscle. As a result of the reduced functional residual capacity (FRC), there is an increase in ventilation, and high lows are needed to perform maximal voluntary ventilation30.
It may be noted that there was no diference between the MIP values obtained and those predicted by the EHarik equa-tion in the normal-weight group. For the equaequa-tion proposed by Neder et al.25, however,we noted anoverestimation of RMS; on
the other hand, the values predicted for MIP by Costa et al.27
were underestimated.
For the morbidly obese, therefore, depending on which RMS equation is used, three diferent conclusions could be drawn
Table 1. Age, anthropometric data and values attributed to habitual physical activity in morbidly obese and lean women.
Morbidly Obese (n=30) Lean Women (n=30) p-value
Age (years) 33.06±5.4 30.6±5.4 0.1738
Height (m) 1.62±4.5 1.62±4.9 0.8303
Body weight (kg) 116.8±13.4 58.8±6.1 <0.0001
BMI (kg/m2) 44.7±4.11 22.1±1.8 <0.0001
WC (cm) 124.1±10.4 78.7±7.4 <0.0001
WHR 0.92±0.07 0.80±0.11 <0.0001
NC (cm) 40.2±2.8 31.8±1.2 <0.0001
FVC (%P) 95.27±15.54 99.10±10.9 0.2749
FEV1(%P) 88.31±4.31 102.75±13.2 <0.001
FEV1/FVC (%P) 102.16±6.08 102.81±6.19 0.6834
LPA score 2.11±0.43 1.97±0.6 0.3377
Score LLPA 1.23±1.05 1.36±0.72 0.3418
Total score 3.35±1.28 3.33±1.09 0.9526
Values were expressed as mean and standard deviation. BMI: body mass index, WC: waist circumfe-rence, WHR: waist-to-hip ratio, NC: neck circumfecircumfe-rence, FVC (%P): Forced vital capacity in percentage predicted, FEV1/FVC (%P), Ratio of FEV1/FVC in percentage predicted, LPA: leisure physical activity, LLPA: leisure physical activity and locomotion. (*) p<0.05, difference between the values obtained from morbidly obese and lean women.
MIP Obtained EHarik ENeder ECosta
Morbidly
obese -87.83±21.40** -130.71±11.98*
# -94.55±3.05# -50.37±2.86*#
Lean
Women -72±15.23 -79.76±5.31
# -95.47±2.57*# -60.23±2.41*#
Table 2. Values of MIP and provided by the equations obtained EHarik, ENeder and ECosta the morbidly obese and lean women in cmH2O.
Values are expressed as mean±standard deviation. EHarik: equation proposed by Harik-Khan, Wise and Fozard12, ENeder: equation proposed by Neder et al.25, ECosta: equation proposed by Costa et al.27.
(*p<0.05) significant difference between the values obtained and provided. (**p<0.05) significant di-fference between the values obtained from morbidly obese and lean women. (#p<0.05) significant difference between the values provided. MIP: maximal inspiratory pressure.
MEP Obtained ENeder ECosta
Morbidly obese 85.83±20.76 95.87±3.80* 97.36±4.23*
Lean Women 82.5±19.85 97.04±3.14* 98.63±3.57*
Table 3. Values of MEP and provided by the equations obtained EHarik, ENeder and ECosta the morbidly obese and lean women in cmH2O.
Values are expressed as mean±standard deviation. ENeder: equation proposed by Neder et al.25,
ECosta: equation proposed by Costa et al.27. (*p<0.05) significant difference between the values
483
MIP obtained - MIP predicted ECosta
10
-10 0
-20
-30 30 40 50 60
Mean of (MIP obtained - MIP predicted ECosta)
50 60 70 80 90
-1.96 SD -17.1 Mean 11.8 +1.96 SD 40.6
20
100
Figure 1. Concordance between the mean values of MIP (obtained and predicted) for EHarik, ENeder ECosta, using Bland-Altman plots. Mean± standard deviation (SD) 1.96 (in cmH2O), 95%CI vs. mean differences between the mean values (obtained MIP - MIP provided).
0
MIP obtained - MIP predicted EHarik
-10
-30 -20
-40
-50 10 20 30 40
Mean of (MIP obtained - MIP predicted EHarik)
60 70 80 90 100
-1.96 SD -38.9 Mean -7.7 +1.96 SD 23.6
MIP obtained - MIP predicted ENeder
-30
-50 -40
-60
-70 -10 0 10 20
Mean of (MIP obtained - MIP predicted ENeder)
60 70 80 90 100
-1.96 SD -52.3 Mean -23.5 +1.96 SD 5.3
-20
110
Figure 2. Concordance between the mean values of MEP (measured and predicted) for ENeder ECosta, using Bland-Altman plots. Mean±standard deviation (SD) 1.96 (in cmH2O), 95%CI vs. mean difference between the mean values (obtained MIP - MIP provided).
MEP obtained - MEP predicted ENeder
-40
-60
-80 -10 40
20
Mean of (MEP obtained - MEP predicted ENeder)
70 80 90 100 110
-1.96 SD -53.2 Mean -14.5 +1.96 SD 24.1
-20
130 120
MEP obtained - MEP predicted ECosta
-40
-60
-80 -10 40
20
Mean of (MEP obtained - MEP predicted ECosta)
70 80 90 100 110
-1.96 SD -54.9 Mean -16.1 +1.96 SD 22.6
-20
130 120
for the same value, which conirms the study’s hypothesis that the mathematical formulas in question cannot reliably predict the RMS of the morbidly obese. his fact may also explain the diferent results of studies attempting to evaluate the strength of respiratory muscles in the morbidly obese28,31,32.
484
normal-weight volunteers to have reduced or increased RMS. Since this formula is the only one that includes the volunteers’ body mass and height, it was selected in this study as the most reliable for measuring the maximal respiratory pressure of the morbidly obese. his being the case, it can be conirmed that the inspiratory muscle strength of obese subjects is reduced.
his result may be explained by a restriction of the thoracic cage resulting from the excessive deposit of fat in the thora-coabdominal region, which would alter the mobility of the diaphragm muscles33. Apart from this, in obese patients, the
weight of the abdomen brings the diaphragm to the cephalic position in the supine position, leading to closure of the small air passageways at the base of the lungs and intrinsic positive end expiratory pressure, resulting in increased ventilatory work and consequent muscle disadvantage34.
he EHarik equation for MIP was most suitable for the control group. his result was also found by Leal et al.35, who
evaluated the respiratory pressure of 475 healthy sedentary adults and concluded that the most suitable equations for that population were Harik-Kahn and Wise and Fozard12
for MIP, which consider body mass, age and height and the Neder et al.25 equation for MEP, which considers age. However,
since the predicted values of Neder et al.25 it those of normal
weight subjects in the present study, the equation was not con-sidered as suitable for predicting expiratory muscle strength in morbidly obese patients.
In another study published by Parreira et al.36, it was
con-cluded that the equations proposed by Neder et al.25 could not
predict MIP or MEP values in a population of healthy non-obese individuals, and these diferences were attributed to methodological diferences between the studies.
As in the present study, other researchers using the Neder et al.25 equations have found contradictory results regarding
RMS behavior in the morbidly obese. Magnani and Cataneo5
performed a study with a group of obese individuals who had been recommended for bariatric surgery (with an aver-age BMI of 44.42 kg/m2) and observed that both the MIP and
MEP were within normal limits. Castello et al.28 found that
morbidly obese women had lower values for MIP (76% of the predicted) and for MEP (67% of the predicted) compared to normal-weight women in the same age range. It could be said that the results for the obese individuals in this study were similar to those of Castello et al.28, but the values predicted
by Harik-Kahn, Wise and Fozard12 for MIP and those of Neder
et al.25 and/or Costa et al.27 for MEP would have to be taken
into account.
he results obtained for MIP, considered separately, cor-roborate those of Costa et al.32, who evaluated 57 obese
individuals and 46 sedentary normal-weight individuals, conirming that obese individuals have greater MIP and MEP
than normal-weight individuals. Costa et al.32 did not calculate
predicted values according to established equations, although they highlighted the importance of a normal-weight control group for evaluating RMS due to the numerous diferent equa-tions for estimating pressure values.
he increased respiratory muscle strength in the obese participants may be explained by an adaptation to the chronic overload that accompanies obesity, shown by the greater quan-tity of type II ibers and the reduced quanquan-tity of type I ibers37.
However, because of the diference between obtained and predicted MEP values in the normal-weight subjects and the fact that the Bland-Altman analysis indicated the predicted values were overestimated, the expiratory muscle strength of the morbidly obese in this study remains inconclusive.
Costa et al.27 conducted a study comparing MIP and MEP
measurements in healthy individuals with values predicted by the Neder et al.25 equations in order to determine reference
equations for the Brazilian population. hey observed that the predicted value for IP was signiicantly greater than their obtained value, although there was no diference between pre-dicted and obtained MEP values. hey attributed their indings to the fact that the Neder et al.25 study did not specify the size of
the hole in the mouthpiece to reduce buccinator muscle pres-sure. his information could help explain our indings on the inspiratory muscle strength of normal-weight individuals with respect to the ENeder equation.
Enright et al.38 reported that the positive predictors for MIP
are gender, FVC, handgrip strength and quantity of lean mass. Some studies have speciically shown that obese individuals have greater peripheral muscle strength than normal-weight individuals, which is probably associated with a greater fat-free mass39,40. Since the volunteers’ body composition was not
evaluated in this study, the MRP indings cannot be attributed to the amount of fat.
Bruschi et al.41 reported great variety in the results of studies
on MRP. hey attribute the variability to the diferent method-ologies involved, such as the type of mouthpiece, the number of maneuvers performed, body position and diferences in the populations studied.
Some limiting factors to be considered for this study are the lack of a cardio-pulmonary test, the lack of a body composi-tion evaluacomposi-tion and the lack of analysis of other RMS studies, especially those involving Brazilian populations.
Conclusion
485
women. Of the three equations used in this study, that of Harik-Khan et al.12 seems the most suitable for
calculat-ing the MIP measurement reference values of the morbidly obese. Morbidly obese and normal-weight women appear to show similarities in expiratory muscle strength behavior, but these findings are still inconclusive.
Acknowledgements
To the Coordenação de Aperfeiçoamento de Pessoal de Nível Superior
(CAPES/PROSUP) and the Programa Institucional de Bolsas de Iniciação
Científica (PIBIC/CNPQ) for financial support, and to Maria Imaculada
de Lima Montebello for contributing to the statistical analysis.
References
1. Sood A. Altered resting and exercise respiratory physiology in obesity. Clin Chest Med. 2009;30(3):445-54.
2. McClean KM, Kee F, Young IS, Elborn JS. Obesity and the lung: 1. Epidemiology. Thorax. 2008;63(7):649-54.
3. Murugan AT, Sharma G. Obesity and respiratory diseases. Chron Respir Dis. 2008;5(4):233-42.
4. Conway B, Rene A. Obesity as a disease: no lightweight matter. Obes Rev. 2004;5(3):145-51. 5. Magnani KL, Cataneo AJM. Respiratory muscle strength in obese individuals and influence
of upper-body fat distribution. São Paulo Med J. 2007;125(4):215-9.
6. Weiner P, Waizman J, Weiner M, Rabner M, Magadle R, Zamir D. Influence of excessive weight loss after gastroplasty for morbid obesity on respiratory muscle performance. Thorax. 1998;53(1):39-42.
7. O’Brien PE, Dixon JB. The extent of the problem of obesity. Am J Surg. 2002;184(6B):4-8. 8. Simoneau JA, Veerkamp JH, Turcotte LP, Kelley DE. Markers of capacity to utilize fatty
acids in human skeletal muscle: relation to insulin resistance and obesity and effects of weight loss. FASEB J. 1999;13(14):2051-60.
9. Hulens M, Vansant G, Lysens R, Claessens AL, Muls E, Brumagne S. Study of differences in peripheral muscle strength of lean versus obese women: an allometric approach. Int J Obes Metab Disord. 2001;25(5):676-81.
10. Tanner CJ, Barakat HA, Dohm GL, Pories WJ, MacDonald KG, Cunningham PR, et al. Muscle fiber type is associated with obesity and weight loss. Am JPhysiol Endocrinol Metab. 2002;282(6):E1191-6.
11. Eichenberger A, Proietti S, Wicky S, Frascarolo P, Suter M, Spahn DR, et al. Morbid obesity and postoperative pulmonary atelectasis: an underestimated problem. Anesth Analg. 2002;95(6):1788-92.
12. Harik-Khan RI, Wise RA, Fozard JL. Determinants of maximal inspiratory pressure. The Baltimore Longitudinal Study of Aging. Am J Respir Crit Care Med. 1998;158(5 Pt 1):1459-64.
13. Simões RP, Deus APL, Auad MA, Dionísio J, Mazzonetto M, Borghi-Silva A. Maximal respiratory pressure in healthy 20 to 89 year-old sedentary individuals of central São Paulo State. Rev Bras Fisioter. 2010;14(1):60-7.
14. Baecke JA, Burema J, Frijters JE. A short questionnaire for the measurement of habitual physical activity in epidemiological studies. Am J Clin Nutr. 1982;36(5):936-42. 15. Florindo AA, Latorre MRDO. Validação e reprodutibilidade do questionário de Baecke
de avaliação da atividade física habitual em homens adultos. Rev Bras Med Esporte. 2003;9(3):121-8.
16. Neder JA, Andreoni S, Castelo-Filho A, Nery LE. Reference values for lung function tests. I. Static volumes. Braz J Med Biol Res. 1999;32(6):703-17.
17. Pereira CAC. Diretrizes para testes de função pumonar. J Pneumol. 2002;28(3):1-82. 18. Miller MR, Hankinson J, Brusasco V, Burgos F, Casaburi R, Coates A, et al. Standardisation
of spirometry. Eur Respir J. 2005;26(2):319-38.
19. Pereira CAC, Barreto SP, Simões JG, Pereira FWL, Gerstler JG, Nakatami J. Valores de
referência para espirometria em uma amostra da população brasileira adulta. J Pneumol. 1992;18(1):10-22.
20. Gonçalves MJ, do Lago STS, Godoy EP, Fregonezi GAF, Bruno SS. Influence of neck circumference on respiratory endurance and muscle strength in the morbidly obese. Obes Surg. 2010;21(8):1250-6.
21. Sievenpiper JL, Jenkins DJ, Josse RG, Leiter LA, Vuksan V. Simple skinfold-thickness measurements complement conventional anthropometric assessments in predicting glucose tolerance. Am J Clin Nutr. 2001;73(3):567-73.
22. Black LF, Hyatt RE. Maximal respiratory pressures: normal values and relationship to age and sex. Am Rev Respir Dis. 1969;99(5):696-702.
23. Badr C, Elkins MR, Ellis ER. The effect of body position on maximal expiratory pressure and flow. Aust J Physiother. 2002;48(2):95-102.
24. American Thoracic Society/ European Respiratory Society. ATS/ERS statement on respiratory muscle testing. Am J Respir Crit Care Med. 2002;166(4):518-624.
25. Neder JA, Andreoni S, Lerario MC, Nery LE. Reference values for lung function tests. II. Maximal respiratory pressures and voluntary ventilation. Braz J Med Biol Res. 1999;32(6):719-27. 26. Souza RB. Pressões respiratórias estáticas máximas. J Pneumol. 2002;28(Suppl. 3):S155-S65. 27. Costa D, Gonçalves HA, Lima LP, Ike D, Cancelliero KM, Montebelo MIL. Novos values de
referência para pressões respiratórias máximas na população brasileira. J Bras Pneumol. 2010;36(3):306-12.
28. Castello V, Simões RP, Bassi D, Mendes RG, Borghi-silva. A força muscular respiratory é marcantemente reduzida em women obesas mórbidas. Arq Méd ABC. 2007;32(2):74-7. 29. Barbalho-Moulin MC, Miguel GPS, Forti EMP, Campos FA, Costa D. Effects of preoperative
inspiratory muscle training in obese women undergoing open bariatric surgery: respiratory muscle strength, lung volumes, and diaphragmatic excursion. Clinics. 2011;66(10):1721-7. 30. Sahebjami H. Dyspnea in obese healthy men. Chest. 1998;114(5):1373-7.
31. Teixeira CA, Santos JE, Silva GA, Souza EST, Martinez JAB. Prevalência de dispnéia e possíveis mecanismos fisiopatológicos envolvidos em indivíduos com obesity graus 2 e 3. J Bras Pneumol. 2007;33(1):28-35.
32. Costa TR, Lima TP, Gontijo PL, Carvalho HA, Cardoso FPF, Faria OP, et al. Correlação da força muscular respiratory com variáveis antropométricas de women eutróficas e obesas. Rev Assoc Med Bras (1992). 2010;56(4):403-8.
33. Parameswaran K, Todd DC, Soth M. Altered respiratory physiology in obesity. Can Respir J. 2006;13(4):203-10.
34. Lin CK, Lin CC. Work of breathing and respiratory drive in obesity. Respirology. 2011;17(3):402-11.
35. Leal AH, Hamasaki TA, Jamami M, Di Lorenzo VAP, Pessoa BV. Comparação entre values de força muscular respiratory medidos e predicted por diferentes equations. Fisioter Pesqui. 2007;14(3):25-3.
486
37. Santiago-Recuerda A, Gómez-Terreros FJ, Caballero P, Martin-Duce A, Soleto MJ, Vesperinas G, et al. Relationship between the upper airway and obstructive sleep apnea-hypopnea syndrome in morbidly obese women. Obes Surg. 2007;17(5):689-97. 38. Enright PL, Kronmal RA, Manolio TA, Schenker MB, Hyatt RE. Respiratory muscle strength
in the elderly. Correlates and reference values. Cardiovascular Health Study Research Group. Am J Respir Crit Care Med. 1994;149(2 Pt 1):430-8.
39. Rolland Y, Lauwers-Cances V, Pahor M, Fillaux J, Grandjean H, Vellas B. Muscle strength
in obese elderly women: effect of recreational physical activity in a cross-sectional study. Am J Clin Nutr. 2004;79(4):552-7.
40. Lafortuna CL, Maffiuletti NA, Agosti F, Sartorio A. Gender variations of body composition, muscle strength and power output in morbid obesity. Int J Obes (Lond). 2005;29(7):833-41. 41. Bruschi C, Cerveri I, Zoia MC, Fanfulla F, Fiorentini M, Casali L, et al. Reference values