Carlos Pestana Barros & Nicolas Peypoch
A Comparative Analysis of Productivity Change in Italian and Portuguese Airports
WP 006/2007/DE _________________________________________________________
Tanya Araújo and Francisco Louçã
Bargaining Clouds, or Mathematics as a Metaphoric
Exploration of the Unexpected
WP 27/2008/DE/UECE
Department of Economics
W
ORKINGP
APERSISSN Nº0874-4548
School of Economics and Management
Bargaining Clouds, or Mathematics as a
Metaphoric Exploration of the Unexpected
Tanya Ara´
ujo
∗and Francisco Lou¸c˜a
ISEG (School of Economics and Management)
Technical University of Lisbon (TULisbon)
Rua do Quelhas, 6 1200-781 Lisboa Portugal
Research Unit on Complexity in Economics (UECE)
†April 29, 2008
1
Introduction
In the very first page of his highly regarded novel, One Hundred Years of Solitude, Gabriel Garcia Marquez writes that, when arriving at Macondo and discovering so many unknown objects, Aurelio Buendia had to point out these things because no words were defined for them. This metaphor of the process of metaphorisation is an apt description of the scientific process itself, as science points out to what it ignores: denotation generates connota-tion. Even when science is defined as a self-contained logic, as mathematics once presumed to be, it dares into the territories of the unknown and of the unexpected; the more rigorous, the more daring it ought to be.
Yuri Manin [1], in the paper ”Mathematics as Metaphor”, commented precisely on this metaphoric quality of mathematics:
”Considering mathematics as a metaphor, I want to stress that the interpretation of the mathematical knowledge is a highly cre-ative act. In a way, mathematics is a novel about Nature and
∗corresponding author: [email protected]
Humankind. One cannot tell precisely what mathematics teaches us, in much the same way as one cannot tell what exactly we are taught by ”War and Peace”.
The epic ”War and Peace” tells us much about Humankind, as the rigor of mathematics proposes to do. In each case, an exploration into the nature of evolution and change is at stake. The metaphors consequently produced, either as imaginary descriptions or as precise formal models, suggest new interpretations that therefore produce new meanings. Mathematics is se-mantics.
In particular, complexity - a metaphor of natural and social relations to be precisely analyzed by mathematical methods - defines an approach which is more insightful to understand dynamics than traditional determinism and positivism. In this paper, we argue that this metaphor is powerful enough to suggest new methods to interpret the emergence of new patterns. In the current example, a stochastic geometry and topological technique are used to describe the structural change in the stock market for the last years.
This new method suggests evidence for a transition of regimes in these markets, measures its dynamics and metaphorically provides a graphic de-scription of the ongoing process.
Mathematics for Complex Systems Science
Complex Systems make use of a plenty of metaphorical developments where the interpretation of the mathematical knowledge (the creative pro-cess) gives place to at least two different (and apparently conflicting) per-ceptions of the system.
The description of Complex Systems generally follows one of two strate-gies:
1. Simple System with Complex Behaviour: They are simple sys-tems because they are characterized by having few degrees of freedom. Nevertheless the display unpredictable behaviour: deterministic and yet apparently random.
• Mathematical tools: non-linear dynamics
– algebra, – set theory
2. Complex Systems with Simple collective Dynamics : They are complex systems because they are characterized by having many de-grees of freedom. Nevertheless their collective dynamics display pat-terns that can be observed at different levels. These patpat-terns usually obey to Scale Laws, giving place to the emergence of simple structures that contrast to the huge amount of complexity that characterizes the individual components of the system.
• Mathematical tools: creation of structures and self-organization
– Ergodic Invariants – measure theory, – algebra,
– set theory, – graph theory
An interpretation of the apparently random financial market behaviour would require, as a first step, an incursion in the territory of non-linear dy-namics. To this purpose, it is usual to compute some Ergodic Invariants (Lyapunov exponents, entropy measures) as an alternative to traditional modelling of simple stochastic processes.
In the example here considered, we approach the stock market complexity from the Collective Dynamics perspective. To this end, a stochastic geometry technique is used to describe structural change. Topological tools help to complete the picture, and provide a metaphorically approximation through a graphic description of the ongoing market process.
Geometrical and Topological Tools for Complex Markets
This paper develops and applies a stochastic geometry technique designed in order to highlight the definition of a simple object that emerges from the collective behaviour of a complex system. In the current case, the market is described according to the evolution of the 253 stocks consistently measured in the S&P500 index for the last 20 years.
The stochastic geometry proceeds to the metaphorical representation of a stock market as a cloud of points in the space. The use of a properly defined distance (computed from the correlation coefficients between stock returns) gives a meaning to geometric and topological notions in the study of the market.
Given that set of distances between points, our geometrical metaphor discusses three semantic questions:
1. Has the cloud a characteristic dimension?
This is, in other words, the embedding question: what is the smallest manifold that contains the set which has obviously many degrees of freedom? Our strategy is based upon the intuition that, if the propor-tion of systematic informapropor-tion present in correlapropor-tions between stocks is small, then the corresponding manifold is a low-dimensional entity, which can be described.
2. Has the cloud any typical shape?
Again, the intuition is that, if the cloud is described as a low dimen-sional object, its dynamics can be observed as the evolution of its form as it is shaped by the occurrence of bubbles and crises.
3. Finally, does the evolution of the cloud follow any specific pattern? Groups of stocks, having their position on the cloud determined by the distance metric, are observed to evolve in a synchronous fashion. The identification of this behaviour suggests the recourse to the application of topological notions, in addition to the geometrical ones.
In a previous work, we used network coefficients to characterize the existence of topological regimes: the clustering coefficient is proved to contain maximal information on such processes of synchronization . As in other fields of science [2], synchronization in the market plays an important role in the identification of abnormal periods. When the stock market is investigated, synchronization is at the root of the disproportionate impact of public events relative to their intrinsic in-formation content. Paradoxically, this applies to unanticipated public events but also to pre-scheduled news announcements.
A new method is proposed in order to address these three questions.
2
A stochastic geometry to describe the
mar-ket
The stochastic geometry strategy is simply stated in the following terms [3]:
1. Pick a representative set of N stocks and their historical data of re-turns over some time interval and, from the rere-turns data, using an appropriate metric, compute the matrix of distances between the N stocks.
separate these two effects. The following stochastic geometry technique is used:
2. From the matrix of distances compute the coordinates for theN stocks in an Euclidean space of dimension smaller than N and then apply the standard analysis of reduction of the coordinates to the center of mass and compute the eigenvectors of the inertial tensor.
3. Apply the same technique to surrogate data, namely to data obtained by independent time permutation for each stock and compare these eigenvalues with those obtained in (2), in order to identify the directions for which the eigenvalues are significantly different as being the market characteristic dimensions.
In so doing, we are attempting to identify the empirically constructed variables that drive the market and the number of surviving eigenvalues is the effective dimension of this economic space.
4. From the eigenvalues of order smaller than the number of characteristic dimensions, compute the difference between eigenvalues in (2) with those in (3). The normalized sum of those differences is the index S, which measures the evolution of the distortion effect in the shape of the market space.
For both surrogate and actual data, the sorted eigenvalues, from large to small, decrease with their order. In the surrogate case, the amount of decrease is linear in the order number, proving that the directions are being extracted from a spherical configuration. The display of a uniform and smooth decrease in the values of the sorted eigenvalues is characteristic of random cases and is also experimentally observed when the market space is built from historical data corresponding to a period of business as usual.
From the returns for each stock
r(k) = log(pt(k))−log(pt−1(k)) (1)
a normalized vector
−→ρ(k) = −→r(k)−h−→r(k)i
q
is defined, where n is the number of components (number of time labels) in the vector−→ρ. With this vector one defines the distance between the stocks k and l by the Euclidian distance of the normalized vectors.
dij = p
2 (1−Cij) = k−→ρ(k)− −→ρ(l)k (3)
as proposed in ([4],[5]) with Cij being the correlation coefficient of the returns r(i),r(j) .
The fact that this is a properly defined distance gives a meaning to geo-metric notions and geogeo-metric tools in the study of the market. Given that set of distances between points, the question now is reduced to an embedding problem: one asks what is the smallest manifold that contains the set. If the proportion of systematic information present in correlations between stocks is small, then the corresponding manifold will be a low-dimensional entity. The following stochastic geometry technique was used for this purpose.
After the distances ( dij) are calculated for the set of N stocks, they are embedded in RD, whereD < n, with coordinates −→x(k). The center of mass
− →
R is computed and coordinates reduced to the center of mass.
− →
R = Σ−k→x(k)
k (4)
−
→y(k) = −→x(k)−−→R (5)
and the inertial tensor
Tij = Σk−→yi(k)−→yj(k) (6)
is diagonalized to obtain the set of normalized eigenvectors { λi,−→ei}. The eigenvectors −→ei define the characteristic directions of the set of stocks. The characteristic directions correspond to the eigenvalues ( λi) that are clearly different from those obtained from surrogate data. They define a reduced subspace of dimension f, which carries the systematic information related to the market correlation structure. In order to improve the decision criterion on how many eigenvalues are clearly different from those obtained from surrogate data, a normalized difference τ is computed:
τ(i) =λ(i) + 1−λ′(i) (7)
2.1
Index of the market structure
As market spaces can be described as low dimension objects, the geometric analysis is able to provide crucial information about their dynamics. In previous papers, we developed different applications of this technique, namely for the identification of periods of stasis and of mutation or crashes. Indeed, market spaces tend to contract during crises along their effective dimensions, but each crisis may act differently on specific dimensions. It is in order to capture that distortion, namely the lack of uniformity along the market effective dimensions, that we defined the market structure index,S [5]. Since the largest f eigenvalues define the effective dimensionality of the economic space, at time t, we compute S as:
St= Σ f
i=1
λt(i)−λ′t(i)
λ′
t(i) = Σ f
i=1
λt(i)
λ′
t(i) −1 (8)
where λt(1), λt(2), ..., λt(f) are the largest f eigenvalues of the market space and λ′
t(1), λ′t(2), ..., λ′t(f) are the largest f eigenvalues obtained from surrogate data, namely from data obtained by independent time permutation of each stock. In computingS, at a given timet, bothλt andλ′tare obtained over the same time window and for the same set of stocks.
3
Results and discussion
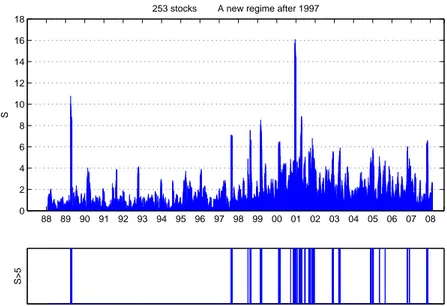
The application of this measure allows for a description of the evolution of the market for the period under consideration, identifying the shock waves of crashes and measuring their impacts.
Furthermore, considering the lack of uniformity among the market effec-tive dimensions, we are able to characterize the extent to which crashes act differently on specific directions, causing changes in the shape of the mar-ket space. The strategy of this measure is thus to identify the distortion of the geometric object describing the market as a basis for the analysis of its dynamics [6].
88 89 90 91 92 93 94 95 96 97 98 99 00 01 02 03 04 05 06 07 08 0
2 4 6 8 10 12 14 16 18
253 stocks A new regime after 1997
S
S>5
Figure 1: Chronological concentration of crashes in the period under consid-eration
The index provides information on the evolution of the cloud describing the dynamics of the markets. It indicates the moments of perturbations, proving that the dynamics is driven by shocks and by a structural change. These changes are interpretable as a general dynamics, as suggested by Fig-ures 5 and 6, which demonstrates how crashes cluster in the turn of the century period and since then. But they are also interpretable as a dif-ferential sectoral dynamics, since the market is also driven by speculative processes which are fuelled by institutional decisions (such as changes in the reference interest rate, for regulatory reasons) just as it is driven by the spell of differential return and profit rates across sectors.
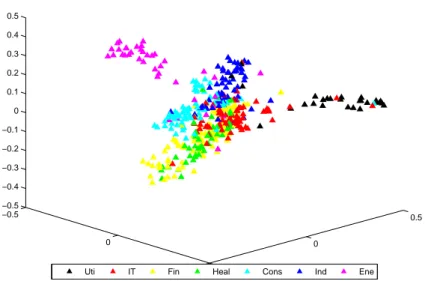
−0.5
0
0.5 −0.5
0
0.5 −0.5
−0.4 −0.3 −0.2 −0.1 0 0.1 0.2 0.3 0.4 0.5
Mar.1998 to Mar.2008
Uti IT Fin Heal Cons Ind Ene
Figure 2: 3-dimensional representation of a turbulent period
the nineteenth-century.
Considering the cumulative history of the index of market structure, it emerges that a major change is occurring since around 1997, imposing a new dynamic structure.
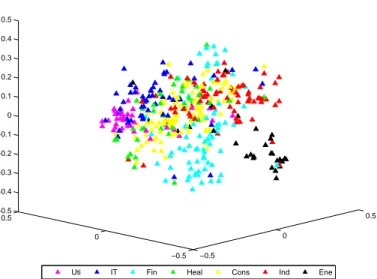
−0.5
0
0.5
−0.5 0
0.5 −0.5 −0.4 −0.3 −0.2 −0.1 0 0.1 0.2 0.3 0.4 0.5
Jul.1998 to Jul.2000
Uti IT Fin Heal Cons Ind Ene
Figure 3: 3-dimensional representation of a business-as-usual period
References
[1] Manin, Yuri I. 1991, Mathematics as Metaphor, Proceedings of the In-ternational Congress of Mathematicians, Kyoto, Japan, 1665-1671
[2] Stanley, EH, 2000, H. E. Stanley, Exotic Statistical Physics: Applica-tions to Biology, Medicine, and Economics, Physica A 285, 1-17.
[3] R. Vilela Mendes, T. Ara´ujo and F. Lou¸c˜a (2003), “Reconstructing an Economic Space from a Market Metric”, Physica A, 323, 635-50.
[4] Mantegna R.N. (1999), Hierarchical structure in financial markets, Eu-ropean Physics Journal B 11.
[5] Mantegna, R.N., Stanley, H.E. (2000), An Introduction to Econophysics: Correlations and Complexity in Finance, Cambridge, Cambridge Uni-versity Press.