www.jped.com.br
ORIGINAL
ARTICLE
Determining
the
frequency
of
morphological
characteristics
in
a
sample
of
Brazilian
children
夽
,
夽夽
Eduardo
Perrone
a,∗,
Thais
Arbocese
Zanolla
a,
Rodrigo
Ambrosio
Fock
a,
Ana
Beatriz
Alvarez
Perez
a,
Decio
Brunoni
baUniversidadeFederaldeSãoPaulo(UNIFESP),DepartamentodeMorfologiaeGenética,SãoPaulo,SP,Brazil
bUniversidadePresbiterianaMackenzie,CentrodeCiênciasBiológicasedaSaúde,ProgramadePós-Graduac¸ãoemDistúrbiosdo
Desenvolvimento,SãoPaulo,SP,Brazil
Received13August2016;accepted20December2016 Availableonline27July2017
KEYWORDS
Anomalies; Morphological; Frequency; Brazilian; Children
Abstract
Objective: Toestablishthefrequency of82 morphologicalfeatures inasampleofBrazilian children(between3and13yearsold),tounderstandtheinfluenceofage,gender,andethnicity. Methods: Thiswasacross-sectionalstudythatevaluated239childrenwithtypicaldevelopment (between3and13yearsold)regardingthepresence of82 morphologicalcharacteristics. A previouslydescribedprotocol,basedontheLondonDysmorphologyDatabase,wasappliedto evaluatethesample.ThisprotocolwasculturallyadaptedtoBrazilianPortuguese.
Results: Thefrequencyof82morphologicalcharacteristicswasestablishedinthesample;of 82 characteristics, 50%were considered morphological anomalies(frequency lessthan4%). Atleast25%ofthesamplepresentedmore thanoneminormorphologicalanomaly.Agewas showntoinfluencethefrequencyofthefollowingmorphologicalcharacteristics:widow’speak, prominentantihelix,prominentupperlip,irregularorcrowdedteeth,andclinodactyly,buthad noinfluenceonthefrequencyofminormorphologicalanomalies.Genderinfluenceddysplastic earsand attachedearlobe, but hadno influence onthe frequency ofminor morphological anomalies;ethnicityshowedinfluenceoncamptodactylyandprominentantihelix.Astatistically significantdivergencewasobservedregarding43ofthe73morphologicalcharacteristicsthat couldbecomparedwithliteraturedata(58.9%).
夽
Pleasecitethisarticleas:PerroneE,ZanollaTA,FockRA,PerezAB,BrunoniD.Determiningthefrequencyofmorphologicalcharacteristics inasampleofBrazilianchildren.JPediatr(RioJ).2017;93:592---600.
夽夽
StudycarriedoutatUniversidadeFederaldeSãoPaulo(UNIFESP),SãoPaulo,SP,Brazil. ∗Correspondingauthor.
E-mails:[email protected],[email protected](E.Perrone).
http://dx.doi.org/10.1016/j.jped.2016.12.010
Conclusions: Thestudy determinedthefrequencyof82morphological characteristicsin239 children withtypicaldevelopment.Agewasthevariablethatshowedmoreinfluenceonthe frequencyofmorphologicalcharacteristics,andcomparisonwithliteraturedatashowedthat thefrequencydependsonvariablessuchasageandethnicity.
©2017SociedadeBrasileiradePediatria.PublishedbyElsevierEditoraLtda.Thisisanopen accessarticleundertheCCBY-NC-NDlicense(http://creativecommons.org/licenses/by-nc-nd/ 4.0/).
PALAVRAS-CHAVE
Anomalias; Morfológicas; Frequência; Brasileiras; Crianc¸as
Determinac¸ãodefrequênciadecaracterísticasmorfológicasemumaamostra decrianc¸asbrasileiras
Resumo
Objetivo: Estabelecer afrequência de 82 características morfológicas em uma amostrade crianc¸asbrasileiras(entre3e13anos),paraentenderainfluênciadaidade,sexoeetnia. Métodos: Estefoiumestudotransversal.Avaliamos239crianc¸ascomdesenvolvimentotípico (entre3e13anos),emrelac¸ãoàpresenc¸ade82característicasmorfológicas.Aplicamosum protocolodescritoanteriormente,baseadonoLondonDysmorphologyDatabase,paraavaliar nossaamostra.EsteprotocolofoiculturalmenteadaptadoaoportuguêsdoBrasil.
Resultados: Afrequênciade82característicasmorfológicasfoiestabelecidaemnossaamostra; de82 características,50%foramconsideradasanomaliasmorfológicas(frequênciainferiora 4%).Pelomenos25%danossaamostraapresentoumaisdeumaanomaliamorfológicamenor. Aidademostrouinfluêncianafrequênciadasseguintescaracterísticasmorfológicas:‘‘bicode viúva’’, ‘‘anti-héliceproeminente’’,‘‘lábio superior proeminente’’,‘‘dentes irregulares ou encavalados’’e‘‘clinodactilia’’,masnãoteveinfluêncianafrequênciadeanomalias morfológ-icasmenores.Osexomostrouinfluêncianasseguintescaracterísticas:‘‘orelhasdisplásicas’’e ‘‘lóbulodaorelhaaderente’’,masnãoteveinfluêncianafrequênciadeanomalias morfológ-icasmenores;aetniamostrouinfluênciana‘‘camptodactilia’’e‘‘anti-héliceproeminente’’. Houvedivergência(estatisticamentesignificativa)em43característicasmorfológicasde73que pudemoscompararcomosdadosdaliteratura(58,9%).
Conclusões: Estabelecemosafrequênciade 82característicasmorfológicas em 239crianc¸as comdesenvolvimentotípico.Aidadefoiavariávelquemostroumaiorinfluênciana frequên-ciade características morfológicase acomparac¸ãocomdadosda literaturamostrouque a frequênciadependedevariáveiscomoidadeeetnia.
©2017SociedadeBrasileiradePediatria.PublicadoporElsevierEditoraLtda.Este ´eumartigo OpenAccesssobumalicenc¸aCCBY-NC-ND(http://creativecommons.org/licenses/by-nc-nd/4. 0/).
Introduction
Amorphologicalanomalyisaphenotypethatissubstantially differentfromthatobservedinareferencepopulation.1This differencecanbedefinedastheoccurrenceofthe pheno-typic characteristic in less than 2.5% of the population.1 Some authorsconsiderastatistical thresholdof 4%for its definition.2Morphologicalanomaliesareclassifiedasmajor, when their presence results in medical consequences for the individual, and as minor, when they do not generate sucheffects.2Thepresenceofminormorphological anoma-liesisconsideredanindicatorofanabnormalembryological developmentprocess;therefore,studieshavealready indi-catedacorrelationbetweenminormorphologicalandmajor anomalies.2---4
Most studies on the frequency of morphological char-acteristics assessed newborns,2---5 and it is known that morphological characteristics may change according to age.6---11
Themostrecentsurveyonthefrequencyof morphologi-calcharacteristicswascarriedoutbyMerksetal.inasample ofDutchchildrenagedbetween8and14years.12
There are no data on the frequency of morphological characteristics in a sample of Brazilian children. Addi-tionally,the definition of a minormorphological anomaly involves a statistical concept. Based on these assump-tions, this study aimed to determine the frequency of 82 morphological characteristics in a sample of children with typical development and to verify the influence of the variables age, gender, and ethnicity on their frequency.
Methods
Sampleselection
history,characterizedbytheabsenceofneuropsychomotor developmentaldelayand/orpsychiatricdisorders.
Statisticalconsiderations
Considering a 95% confidence level and a 5% confidence interval,andbasedonpreviousliteraturedataonthe fre-quencyofminoranomalies in thepopulation,2---4 a sample of200childrenwasestimated.Tocompensateforpossible losses,thestudyincluded239children.
Categoricalvariablesweredescribedasfrequencies.To comparethefrequenciesofthemorphological characteris-tics withthosealready described, the Z-test wasused to comparebetweentwoproportions.
To determine whether the frequency of each anomaly showed a statistically significant difference according to gender,age,andethnicity,thechi-squaredtest orFisher’s exact test was used.The results withp≤0.05 were con-sideredsignificant.Statisticalanalysiswascarriedoutusing theSPSSsoftwareforstatisticalanalysis(IBMCorp.Released 2011, IBM SPSS Statistics for Windows, Version 20.0, NY, USA).
Protocoluseandmorphologicalevaluationofthe children
Childrenwere evaluatedaccording toa protocol contain-ing82morphologicalcharacteristicsbasedonthedefinition oftheLondonDysmorphologyDatabase(LDDB),whichlists approximately2000 characteristics. The protocol used to evaluate the 82 characteristics has been previously used byMiles etal.toevaluate children withautismspectrum disorder(ASD).13Thisprotocolisbeingvalidatedforusein childrenwithASDinBrazil,andpartofthisprocessdepends on its application in children with typical development. Thus,theauthorschosetoapplythisprotocoltothepresent sample.
Thedefinitionofsomemorphologicalcharacteristicswas changedinrelation tothepreviousdefinitiongivenbythe LDDB,afteraconsensusamongfourgeneticists(authorsof thestudy),aimingtomakethemmoreobjective.The char-acteristicswiththedescriptionaftertheculturaladaptation areshowninTable1.
For anthropometric data collection, a vertical anthro-pometer and a metric tape were used. During the morphologicalexamination,thefollowingweremeasuredin additiontoheight;ears,hands,middlefingers,andmiddle toes. The curves used to define micro/macrotia; elon-gated/smallfeet;large/small hands;and elongated/short phalangesarethosefoundinSmith’sRecognizablePatterns ofHumanMalformation,14 usingthe±2SD(standard devia-tions)limit.Aheight-for-agemeasurementbelowthethird percentilein theWHOcurvewasdefinedasshortstature. Theothercharacteristicswerescoredasabsentorpresent. The 239children wereevaluatedby thefirstauthorof thisstudy,whoisalsoageneticist,intwomunicipalschools in the city of Barueri (state of São Paulo, Brazil). It was decidedtoevaluatechildrenfromthepublicschoolsystem topreventtheethnicselectionbiasthatmayoccurinprivate schools.
Regulatoryaspects
ThisstudywassubmittedtoandapprovedbytheResearch EthicsCommitteeofUNIFESP.Childrenwereevaluatedafter parentsortutorsgavetheirauthorizationbysigningthefree andinformedconsentform.
Results
Overallsamplecharacteristics
Atotalof239childrenaged3to13yearswereevaluatedin municipalschoolsofthecityofBarueri(SP).
Themeanageofthesamplewas7yearsand9months±2 years and 10 months, with a median of 7 years and 6 months.Thesamplecomprised111malesubjects(46.4%). Regarding ethnicity, the distribution of the analyzed sub-jectsconsistedof 62.3%white(n=149),25.9%mixed-race (n=62),10.9%Africandescendants(n=26),and0.8%native Brazilians(n=2).
Determinationofthefrequencyofmorphological characteristics
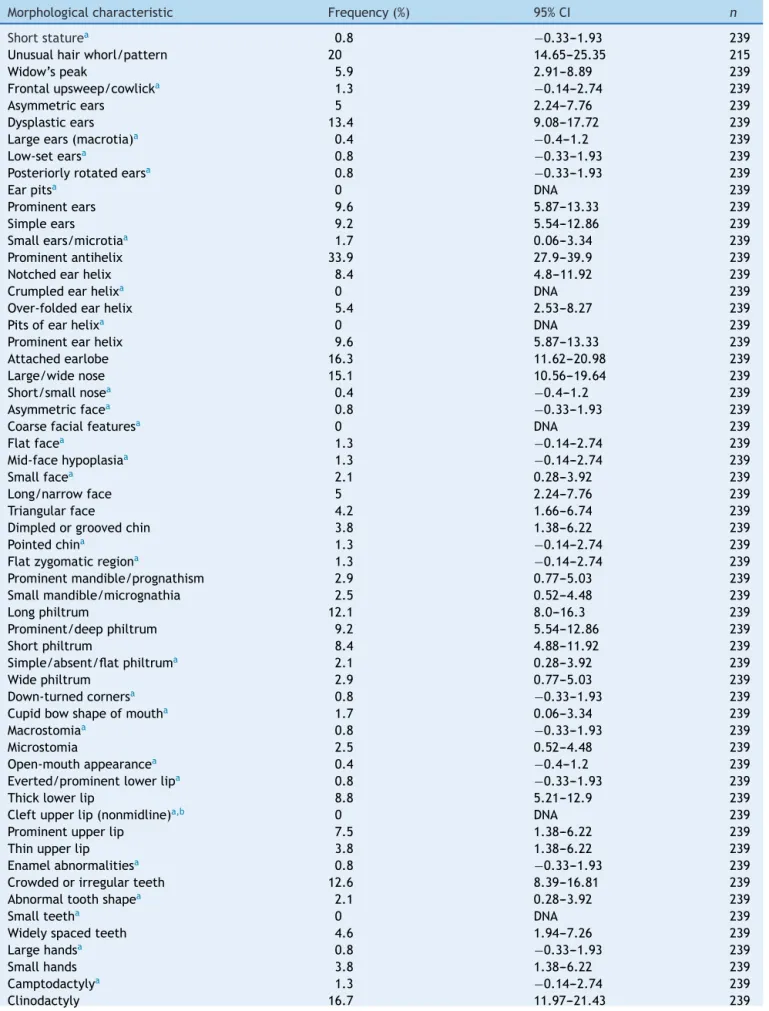
Table1showsthefrequenciesofeachassessed morpholog-icalcharacteristic.
Of the 82 morphological characteristics evaluated, 41(50%)showedafrequency<4%,andcouldbeconsidered asmorphologicalanomalies.Therefore,oneminoranomaly wasobserved in42 subjects (17.5%),twoanomalies in 12 subjects (5%),and threeanomalies in sixsubjects (2.5%). Therefore,60children(25%)hadatleastoneminoranomaly.
Determinationofthefrequencyofmorphological characteristicsbygender
Of the 82 evaluated characteristics, only two showed frequencies with significant differences when divided by gender:dysplasticears(20.7%[13.6---28.2%]in111male sub-jectsvs.7%[2.58---11.4%]in128femalesubjects;p=0.002) and attached earlobe (10.8% [5.03---16.57%] in 111 male subjects vs. 21.2% [14.1---28.28%] in 128 female subjects; p=0.032.
Determinationofthefrequencyofmorphological characteristicsbyagegroup
The239studysubjectsweregroupedintofivegroupswith differentageranges: groupI,from3to5years;GroupII, from5yearsand1monthto7years;GroupIII,from7years and1monthto9years;GroupIV,from9yearsand1month to11years;andgroupV,from11yearsand1monthto13 years.
Fivecharacteristics showedsignificant frequency varia-tionsdependingonage:widow’speak,prominentantihelix, prominentupperlip,crowdedteeth,andclinodactyly.
Table1 Frequencyofmorphologicalcharacteristicsfound.
Morphologicalcharacteristic Frequency(%) 95%CI n
Shortstaturea 0.8 −0.33---1.93 239
Unusualhairwhorl/pattern 20 14.65---25.35 215
Widow’speak 5.9 2.91---8.89 239
Frontalupsweep/cowlicka 1.3 −0.14---2.74 239
Asymmetricears 5 2.24---7.76 239
Dysplasticears 13.4 9.08---17.72 239
Largeears(macrotia)a 0.4 −0.4---1.2 239
Low-setearsa 0.8 −0.33---1.93 239
Posteriorlyrotatedearsa 0.8 −0.33---1.93 239
Earpitsa 0 DNA 239
Prominentears 9.6 5.87---13.33 239
Simpleears 9.2 5.54---12.86 239
Smallears/microtiaa 1.7 0.06---3.34 239
Prominentantihelix 33.9 27.9---39.9 239
Notchedearhelix 8.4 4.8---11.92 239
Crumpledearhelixa 0 DNA 239
Over-foldedearhelix 5.4 2.53---8.27 239
Pitsofearhelixa 0 DNA 239
Prominentearhelix 9.6 5.87---13.33 239
Attachedearlobe 16.3 11.62---20.98 239
Large/widenose 15.1 10.56---19.64 239
Short/smallnosea 0.4 −0.4---1.2 239
Asymmetricfacea 0.8 −0.33---1.93 239
Coarsefacialfeaturesa 0 DNA 239
Flatfacea 1.3 −0.14---2.74 239
Mid-facehypoplasiaa 1.3 −0.14---2.74 239
Smallfacea 2.1 0.28---3.92 239
Long/narrowface 5 2.24---7.76 239
Triangularface 4.2 1.66---6.74 239
Dimpledorgroovedchin 3.8 1.38---6.22 239
Pointedchina 1.3 −0.14---2.74 239
Flatzygomaticregiona 1.3 −0.14---2.74 239
Prominentmandible/prognathism 2.9 0.77---5.03 239
Smallmandible/micrognathia 2.5 0.52---4.48 239
Longphiltrum 12.1 8.0---16.3 239
Prominent/deepphiltrum 9.2 5.54---12.86 239
Shortphiltrum 8.4 4.88---11.92 239
Simple/absent/flatphiltruma 2.1 0.28---3.92 239
Widephiltrum 2.9 0.77---5.03 239
Down-turnedcornersa 0.8 −0.33---1.93 239
Cupidbowshapeofmoutha 1.7 0.06---3.34 239
Macrostomiaa 0.8 −0.33---1.93 239
Microstomia 2.5 0.52---4.48 239
Open-mouthappearancea 0.4 −0.4---1.2 239
Everted/prominentlowerlipa 0.8 −0.33---1.93 239
Thicklowerlip 8.8 5.21---12.9 239
Cleftupperlip(nonmidline)a,b 0 DNA 239
Prominentupperlip 7.5 1.38---6.22 239
Thinupperlip 3.8 1.38---6.22 239
Enamelabnormalitiesa 0.8 −0.33---1.93 239
Crowdedorirregularteeth 12.6 8.39---16.81 239
Abnormaltoothshapea 2.1 0.28---3.92 239
Smallteetha 0 DNA 239
Widelyspacedteeth 4.6 1.94---7.26 239
Largehandsa 0.8 −0.33---1.93 239
Smallhands 3.8 1.38---6.22 239
Camptodactylya 1.3 −0.14---2.74 239
Table1 (Continued)
Morphologicalcharacteristic Frequency(%) 95%CI n
Cutaneoussyndactylyofthefingersa 0.4 −0.4---1.2 239
Taperingfingers 3.8 1.38---6.22 239
Thinfingers 7.5 1.38---6.22 239
Hypoplastic/shortmetacarpalsa 0 DNA 239
Shortphalangesa 1.7 0.06---3.34 239
Widephalangesa 0.4 −0.4---1.2 239
Longphalangesa 1.7 0.06---3.34 239
Broadthumbs 7.5 1.38---6.22 239
Dystrophic(dysplastic),includingstriatednailsa 0.4 −0.41---1.21 235
Hyperconvex 8 4.55---11.45 238
Hypoplastic/smallnails 2.9 0.77---5.03 238
Shortnails 10.5 6.61---14.39 238
Clubfootvarusa 0 DNA 239
Largefeeta 2.1 0.28---3.92 239
Smallfeeta 0.8 −0.33---1.93 239
Widefeet 10.9 6.9---14.85 239
Halluxvalgus 10 6.2---13.8 239
Broadtoes 3.3 1.04---5.56 239
Overlappingtoes(includingclinodactyly) 65.7 59.68---71.72 239
Shorttoes 2.5 0.52---4.48 239
Syndactylyof2---3toesa 0.4 −0.4---1.2 239
Syndactylyoftoes(exceptfor2---3toes)a 0.8 −0.33---1.93 239
Wide-spacedtoes 9.2 5.54---12.86 239
Camptodactyly/hammertoesa 0.4 −0.4---1.2 239
aCharacteristicconsideredasamorphologicalanomaly(consideringthe4%threshold). b Characteristicconsideredasamajormorphologicalanomaly.
DNA,doesnotapply.
comparinggroupsIvs.II;IIvs.III;IIIvs.IV(14.8%vs.31.7% vs.57.5%vs.34.2%; p<0.05inall comparisons);thethird, whencomparinggroups II xIII (11.1%vs. 0.0%;p=0.041); thefourth,whencomparinggroupsIIvs.III(4.2%vs.17.5%; p=0.044); and the fifth, when comparing groups I vs. II (29.6%vs.12.7%;p=0.024).
Agedid notinfluencethe frequency ofindividuals who hadatleastoneminormorphologicalanomaly.GroupIhad 22.2%ofsubjectswithatleastoneminoranomaly;groupII, 19.6%;groupIII,30.7%;groupIV,32.4%;andgroupV,36.3% (p=0.451).
Determinationofthefrequencyofmorphological characteristicsbyethnicity
The proportion of individuals with at least one morpho-logical anomaly did not present a statistically significant differencebetween the ethnic groups; 23.9%, 30.7%, and 34.4% of white, African-descendants, and mixed-race individuals, respectively, presented at least one minor morphologicalanomaly(p=0.407).Theonlycharacteristics that showed variations according to the ethnicity were: prominent antihelix (30.2% vs. 23.0% vs. 48.3% vs. 0% in white, African descendants, mixed-race, and native Brazilians, respectively; p=0.026), and ‘‘camptodactyly’’ (0%vs.7.7%vs.1.6%vs.0%inwhite,Africandescendants, mixed-race,andnativeBrazilians,respectively;p=0.025).
Discussion
Ingeneral,a frequencyofat least25% ofindividualswith at least one morphological anomaly was observed in the presentsample.Thefrequenciesofthemorphological char-acteristics,whencomparedwiththosealreadydescribedin theliterature,showeddiscrepancies.Whenstratifying chil-dren by age, ethnicity,and gender, thevariables age and ethnicityappearedtoinfluencethefrequencyof character-istics.
Frequencyofidentifiedmorphological characteristics
Considering the 4% threshold to define a morphological anomaly, only 41 of theassessed characteristics could be considered assuch.Most ofthese characteristics (39)are minor morphological anomalies, except upper lip cleft non-midline and short stature, which may have clinical implications and association with malformations and skeletal dysplasias, respectively, being considered major morphologicalanomalies.12
Inthepresentstudy,25%ofthesamplehadatleastone minoranomaly.
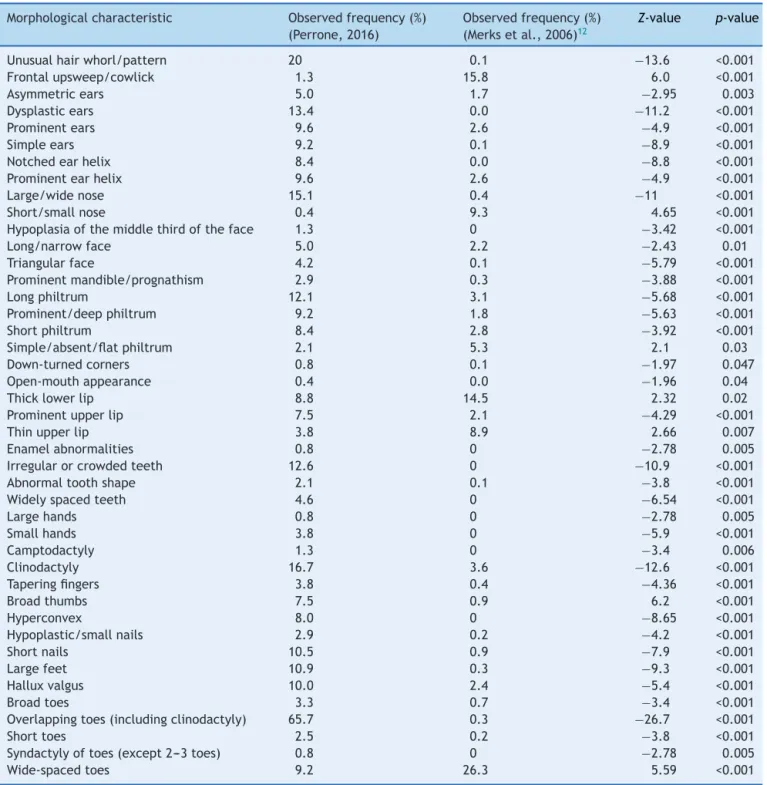
Table2 Morphological characteristicsfound withsignificant statisticaldifference incomparisonswith thestudy by Merks etal.12
Morphologicalcharacteristic Observedfrequency(%) (Perrone,2016)
Observedfrequency(%) (Merksetal.,2006)12
Z-value p-value
Unusualhairwhorl/pattern 20 0.1 −13.6 <0.001
Frontalupsweep/cowlick 1.3 15.8 6.0 <0.001
Asymmetricears 5.0 1.7 −2.95 0.003
Dysplasticears 13.4 0.0 −11.2 <0.001
Prominentears 9.6 2.6 −4.9 <0.001
Simpleears 9.2 0.1 −8.9 <0.001
Notchedearhelix 8.4 0.0 −8.8 <0.001
Prominentearhelix 9.6 2.6 −4.9 <0.001
Large/widenose 15.1 0.4 −11 <0.001
Short/smallnose 0.4 9.3 4.65 <0.001
Hypoplasiaofthemiddlethirdoftheface 1.3 0 −3.42 <0.001
Long/narrowface 5.0 2.2 −2.43 0.01
Triangularface 4.2 0.1 −5.79 <0.001
Prominentmandible/prognathism 2.9 0.3 −3.88 <0.001
Longphiltrum 12.1 3.1 −5.68 <0.001
Prominent/deepphiltrum 9.2 1.8 −5.63 <0.001
Shortphiltrum 8.4 2.8 −3.92 <0.001
Simple/absent/flatphiltrum 2.1 5.3 2.1 0.03
Down-turnedcorners 0.8 0.1 −1.97 0.047
Open-mouthappearance 0.4 0.0 −1.96 0.04
Thicklowerlip 8.8 14.5 2.32 0.02
Prominentupperlip 7.5 2.1 −4.29 <0.001
Thinupperlip 3.8 8.9 2.66 0.007
Enamelabnormalities 0.8 0 −2.78 0.005
Irregularorcrowdedteeth 12.6 0 −10.9 <0.001
Abnormaltoothshape 2.1 0.1 −3.8 <0.001
Widelyspacedteeth 4.6 0 −6.54 <0.001
Largehands 0.8 0 −2.78 0.005
Smallhands 3.8 0 −5.9 <0.001
Camptodactyly 1.3 0 −3.4 0.006
Clinodactyly 16.7 3.6 −12.6 <0.001
Taperingfingers 3.8 0.4 −4.36 <0.001
Broadthumbs 7.5 0.9 6.2 <0.001
Hyperconvex 8.0 0 −8.65 <0.001
Hypoplastic/smallnails 2.9 0.2 −4.2 <0.001
Shortnails 10.5 0.9 −7.9 <0.001
Largefeet 10.9 0.3 −9.3 <0.001
Halluxvalgus 10.0 2.4 −5.4 <0.001
Broadtoes 3.3 0.7 −3.4 <0.001
Overlappingtoes(includingclinodactyly) 65.7 0.3 −26.7 <0.001
Shorttoes 2.5 0.2 −3.8 <0.001
Syndactylyoftoes(except2---3toes) 0.8 0 −2.78 0.005
Wide-spacedtoes 9.2 26.3 5.59 <0.001
morphological anomaly; Mèhes et al.,3 a prevalence of 16.3%; Leppig et al.,4 a prevalence of 39.9%; and Tsai et al.,5 a prevalence of 43.3% in Chinese new borns.
Thedifferenceinfrequenciesfoundbetweenthestudies canbejustifiedbythenumberofcharacteristicsassessed, the evaluation method,and the ethnicityof the assessed children.
The41characteristicsthatwerenotconsideredas mor-phologicalanomalies---astheywereobservedinover4%of
thepresentsample---aremorphologicalvariantsornormal characteristics(frequency>50%).3,4
Influenceofthevariablesage,gender,and ethnicityontheobservedcharacteristics
morphologicalanomaliesoftheassessednewborns.Leppig etal.4alsodidnotconsiderthisissue;however,theystated thatprominent heel, for instance, was an anomaly found onlyingirls.
IncontrastwithLeppigetal.4 andMardenetal.,2 Tsai etal.5emphasizedthatvariablessuchasgender,maternal age, and gestationalage did not influence the frequency ofanomalies foundin theirsample. The influenceof gen-der onmorphological variants wasnot assessed in any of them.
The present study demonstrated that, of the 82 mor-phological characteristics assessed, only two showed a statisticallysignificantdifferencewhenconsideringgender: dysplastic ears and attached earlobe. These two char-acteristics, due to their frequency, would be considered morphologicalvariants.Forallothermorphologicalvariants andmorphological anomalies, no influence of gender was observedontheidentifiedfrequencies.
In short, gender is a variablethat does not appear to influencethemorphologicalcharacteristicsconsidered mor-phologicalanomalies.
Regardingtheinfluenceoftheagerangeonthefrequency oftheassessedcharacteristics,itisknownthatgenetic syn-dromephenotypes,aswellastheindividuals’morphological characteristics,changeovertime6---11;however,noneofthe aforementioned studies allowed the determinationof the agegroup interferenceonthe frequencyof theidentified morphologicalcharacteristics.
The present study was a pioneer in evaluating the influence of this variable.All characteristics that showed statisticallysignificantvariationsinfrequencyaccordingto agewere morphological variants.The characteristics that showedany variation in theirfrequency according toage were:widow’speak,prominentantihelix,prominentupper lip,crowdedteeth,andclinodactyly.
The onsetof the characteristic crowded teeth after 7 yearsofageisperhapsduetotheagegroup,whendeciduous teethstarttobereplacedbypermanentdentition.
Thecharacteristicswidow’speakandprominentantihelix presentedincreased frequencywithage. This mayreflect thefact thatsome characteristics,even thoughtheymay bepresent from birth,are easier toidentifyin older age groups.Incontrast,clinodactylyismoreeasilyperceivedin youngeragegroups.
Merks etal.,12 when comparingthe frequencyof char-acteristicsfound intheirstudy onschoolchildren withthe frequencyidentifiedinprevious studiesonnewborns, also concludedthat thereis an important influence of age on theindividual’sphenotype.
Thesefindingsshowthatstudiesonthefrequencyof mor-phologicalcharacteristicswithlargersamplesinspecificage groups areimportanttodetermine whatis orwhat isnot considered a morphological anomaly for that specific age group.
All characteristics that varied according to age range werepreviously consideredasmorphologicalvariants.Age didnotinfluencethefrequencies observedforminor mor-phologicalanomalies.
Ethnicaspectsarenoteworthy,sincethemorphological characteristicsofskincolorandfacialfeaturesareusedto categorizewhattheliteraturecallsethnicityandcurrently, throughgenomicstudies,asancestry.
Demographic statisticsuse the self-declared skin color asan indicatorof ancestry. Thus, according todata from theBrazilianInstituteofGeographyandStatistics(Instituto BrasileirodeGeografiaeEstatística[IBGE],2010census),15 the Brazilianpopulation consistsof 47.7% ofwhite; 43.1% of mixed-race;7.6% ofAfricandescendants; 1.1%ofAsian descendants; and0.4%of nativeBrazilian individuals.The useofthechi-squaredtestofadherenceindicatedthatthere was adifference between the distributionof the present sampleregardingethnicityinrelationtotheBrazilian pop-ulation(p<0.001).
Suchdifferenceispredictable,sinceinthepresentstudy ethnicdesignationwasderivedfromobservationand phys-icalexamination,whereasthatofIBGEisself-reported.In turn,themiscegenationoftheBrazilianpopulationis con-sideredoneofthewidestintheworld,andinformationon themorphologicalphenotype,eitherdeterminedby physi-calcharacteristicsorself-declared,isnotagoodpredictor ofgenomicancestry.16,17
The absence of a statistically significant difference between the proportionof individuals with morphological anomalies,whenconsideringethnicity,wasexpected,since morphologicalanomaliesrepresentintrinsicdevelopmental alterationsandtherewouldbenoreasonfor themto pre-dominatein aparticular ethnicity.The factthat onlytwo ofthe82morphologicalfeaturesshowedsignificant differ-ences whenstratified by ethnicitycan bejustifiedby the evaluator’s ethnicconsiderationswhendefining character-istics(e.g.,thicklowerlip).
ComparisonwiththestudybyMerksetal.12
Dataon thefrequency of morphological characteristics in children’ssamplesarescarceintheliterature.
Inthissense,thepresentdataarebettercomparedwith thosebyMerksetal.12 Theauthorswerepioneersin deter-miningthefrequencyofmorphologicalcharacteristics ina sample of the Dutch population witha median age of 11 years. Based on the data obtained in the assessment of 683characteristics(usingLDDB)in923children,frequencies wereestablished,allowingtheclassificationofthe charac-teristicsasmorphologicalanomaliesorvariants.
Ofthe73morphologicalcharacteristicsthatwere evalu-atedinbothstudiesandhadafrequencyotherthanzero,in 43(59%)astatisticallysignificant differencewasobserved between the frequencies found in the present study and thoseinthestudybyMerksetal.12Thecharacteristics show-inganydiscrepancyareshowninTable2.
Some hypotheses can beraised toclarify this discrep-ancy:theethniccompositionofMerks’samplewasdifferent fromthatofthepresentsample(thefirstone,consistingof whitechildren, andthesecond oneconsistingofBrazilian children,theresultofmiscegenation);theagerangeofthe evaluatedpatientswasalsodifferent;thesubjectivityand thecontinuityofsomemorphologicalcharacteristicsmakes theirassessmentobserver-dependent.
Someexampleswillbeusedtoillustratethepreviously mentionedhypotheses.
Merks’12sample(8.8%vs.14.5%,respectively).However,as theethnicalcriterionwasconsideredinthedefinitionofa thicklowerlip,andasthischaracteristicissubjectiveand continuous,inthesampleonlychildrenwhohadaverythick lowerlipwereconsideredaspresentingthischaracteristic, leadingtoits.
Tsai et al.,5 after assessing 3345 Chinese newborns, verifiedthatethnicityinfluencedthefrequencyof morpho-logical features (single palmar crease, ascending oblique palpebral fissure, andfrontal bossingwere observed at a frequencyhigherthan4%inasampleofChinesenewborns, beingmorphologicalvariantsinthatsample).
The fact that some characteristics are continuous and subjectivemakesitdifficulttodefinethelimittoconsider them asnormal or altered,whichmayresult inunder-or overestimationoftheirfrequencies.
This reasoningappliestoclinodactyly,whose definition onlystatesa‘‘significantlateralbending,usuallyobserved inthefifthfinger’’.Thischaracteristicwasfoundin16.7% of the assessed individuals, in contrast to 3.6% in the Merksetal.12 sample. Probably,thelatter authors consid-eredhigherdegreesofclinodactylyduringtheirevaluation. If the definition were clearer regarding the degree of acceptable bending,a similarfrequency might have been observed.
Anotherassessedcharacteristicthatshowedhigh preva-lenceintheevaluatedsample(65.7%)andcouldtherefore be considered as a normal variant was overlapping toes (includingclinodactyly). What ledto thishigh prevalence wastheinclusionofthetermclinodactylyinthedefinition, sinceclinodactylyof thefifthtoeinchildrenis acommon findingandhassubjectiveevaluation.
ThemedianageoftheMerksetal.12samplewas differ-ent from the present sample (11 years vs. 7 years and 6 months,respectively). Theage groupof thepatients may haveinfluencedthedifferenceinsomefindings.When the present samplewasdividedintodifferentagegroups, the influenceoftheagevariablewasobserved.
Of the 43 characteristics that presented frequency discrepancy between the studies, 31 (72.1%) could be considered as morphological variants, one (2.4%) as a normal characteristic, and 11 (25.5%) as morphological anomalies. Of the 30 characteristics that showed sim-ilar frequencies between the studies, 22 (73.3%) could be considered morphological anomalies and eight (26.7%) as variants. This indicates that the chance of finding a morphological variantin the groupof patientswitha dis-crepancy in the assessed data waseight-fold higher than inthegroupwithoutdiscrepancy(OR:8;p<0.001;95%CI: 2.7---23.0).
Asthemorphologicalvariantsarecharacterizedbyhaving afrequencyabove4%andbyacontinuumofthe character-istic,itiseasytounderstandtheywillbemoredifficultto evaluate,andthereforemoresusceptibletothediscrepancy infrequencysurveydataintheliterature.
Study
limitations
The evaluation of the morphological characteristics was carriedoutbyonlyoneexaminerandonlyonce;therefore, it was not possible to rule out inter- or intraobserver
variations. Additionally, sample calculation was made basedonthepresenceofatleastoneminormorphological anomalyinthepopulationandnotonthefrequencyofeach them in particular; therefore, the differences not found between the different groups (when stratified by gender, agegroup,ethnicity,andwhencomparedtotheliterature) donot necessarily meanthat the groups are equal, since thedifferencemaynothavebeenobservedduetolackof statisticalpowertodetectthem.
Thepresentstudydeterminedandclassified morpholog-icalcharacteristicsinasample oftheBrazilianpopulation aged3---13years,sothatitwaspossibletodeterminewhatis avariantofnormalityandwhatisamorphologicalanomaly for this population. It showed that some morphological characteristics need tobestandardized tofacilitate their identification.
The study also demonstrated there is an important influence of age and ethnicity on the frequency of some characteristics;studieswithlargersamples,associatingage andethnicitytothefrequencyoftheidentified character-istics,arenecessarytoadequatelyclassifyamorphological characteristic.
Conflicts
of
interest
Theauthorsdeclarenoconflictsofinterest.
References
1.HennekamRC, BieseckerLG,AllansonJE, HallJG,OpitzJM, TempleIK,etal.Elementsofmorphologyconsortium.Elements ofmorphology:generaltermsforcongenitalanomalies.AmJ MedGenetA.2013;161A:2726---33.
2.Marden PM, Smith DW, McDonald MJ. Congenital anomalies inthe newborninfant, includingminor variations.JPediatr. 1964;64:357---71.
3.MehesK,MestyanJ,KnochV,VincellerM.Minormalformations intheneonate.HelvPediatrActa.1973;28:47.
4.LeppigKA,WerlerMM,CannCI,CookCA,HolmesLB.Predictive valueofminoranomalies.I.Associationwithmajor malforma-tions.JPediatr.1987;110:531---53.
5.Tsai FJ,Tsai CH,Peng CT, Wu JY,Lien CH, WangTR. Differ-entrace,differentface:minoranomaliesinChinesenewborn infants.ActaPaediatr.1999;88:323---6.
6.Allanson JE, Hall JG, Hughes HE, Preus M, Witt RD. Noo-nan syndrome: the changing phenotype. Am J Med Genet. 1985;21:507---14.
7.AllansonJE.Rubinstein-Taybisyndrome:thechangingface.Am JMedGenet.1990;6:S38---41.
8.AllansonJE,O’HaraP,FarkasLG,NairRC.Anthropometric cra-niofacialpatternprofilesinDownsyndrome.AmJMedGenet. 1993;47:748---52.
9.AllansonJE,ColeTR.Sotossyndrome:evolutionoffacial phe-notypesubjectiveandobjectiveassessment.AmJMedGenet. 1996;65:13---20.
10.Allanson JE, Hennekam RC, Ireland M. De Lange syndrome. Subjectiveandobjectivecomparisonoftheclassicalandmild phenotypes.JMedGenet.1997;34:645---50.
12.Merks JH, Ozgen HM, Cluitmans TL, van der Burg-van Rijn JM, Cobben JM, van Leeuwen FE, et al. Normal values for morphologicalabnormalitiesinschoolchildren.AmJMedGenet A.2006;140A:2091---109.
13.MilesJH,TakahashiTN,HongJ,MundenN,FlournoyN, Brad-dock SR,etal. Developmentand validationofa measureof dysmorphology:usefulforautismsubgroupclassification.AmJ MedGenetA.2008;146A:1101---16.
14.JonesKL,JonesMG,CasanellesMC.Smith’srecognizable pat-ternsofhumanmalformation.7thed.Elsevier;2013.
15.IBGE---InstitutoBrasileirodeGeografiaeEstatística.Available from: http://www.ibge.gov.br/home/estatistica/populacao/ censo2010/caracteristicasreligiaodeficiencia/caracteristicas religiaodeficienciatabxls.shtm[accessed6.11.16].
16.Parra FC, Amado RC, Rocha J, Antunes C, Pena SD. Color and genomicancestry in Brazilians.Proc Natl AcadSci USA. 2003;100:177---82.