*Correspondence: J. R. Matos. Department of Fundamental Chemistry, Institute of Chemistry, University of São Paulo. Av. Prof. Lineu Pres-tes, 748 – Butantã, CEP: 05508-900 - São Paulo - SP, Brasil. E-mail: [email protected]; [email protected]
A
vol. 49, n. 2, apr./jun., 2013
Study of thermal behavior of phytic acid
André Luis Máximo Daneluti
1, Jivaldo do Rosário Matos
2,*1Department of Pharmacy, Faculty of Pharmaceutical Sciences, University of São Paulo, 2Department of Fundamental Chemistry, Institute of Chemistry, University of São Paulo
Phytic acid is a natural compound widely used as depigmenting agent in galenic cosmetic emulsions. However, we have observed experimentally that phytic acid, when heated to 150 oC for around one hour, shows evidence of thermal decomposition. Few studies investigating this substance alone with regard to its stability are available in the literature. This fact prompted the present study to characterize this species and its thermal behavior using thermal analysis (TG/DTG and DSC) and to associate the results of these techniques with those obtained by elemental analysis (EA) and absorption spectroscopy in the infrared region. The TG/DTG and DSC curves allowed evaluation of the thermal behavior of the sample of phytic acid and enabled use of the non-isothermal thermogravimetric method to study the kinetics of the three main mass-loss events: dehydration I, dehydration II and thermal decomposition. The combination of infrared absorption spectroscopy and elemental analysis techniques allowed evaluation of the intermediate products of the thermal decomposition of phytic acid. The infrared spectra of samples taken during the heating process revealed a reduction in the intensity of the absorption band related to O-H stretching as a result of the dehydration process. Furthermore, elemental analysis results showed an increase in the carbon content and a decrease in the hydrogen content at temperatures of 95, 150, 263 and 380 °C. Visually, darkening of the material was observed at 150 °C, indicating that the thermal decomposition of the material started at this temperature. At a temperature of 380 °C, thermal decomposition progressed, leading to a decrease in carbon and hydrogen. The results of thermogravimetry coupled with those of elemental analysis allow us to conclude that there was agreement between the percentages of phytic acid found in aqueous solution. The kinetic study by the non-isothermal thermogravimetric method showed that the dehydration process occurred in two stages. Dehydration step I promoted a process of vaporization
of water (reaction order of zero), whereas dehydration step II showed an order of reaction equal to ive.
This change in reaction order was attributed to loss of chemically bonded water molecules of phytic acid or to the presence of volatile substances. Finally, the thermal decomposition step revealed an order of reaction equal to one. It was not possible to perform the kinetic study for other stages of mass loss.
Uniterms: Thermal analysis. Phytic acid/thermal behavior. Emulsion/stability. IR/dehydration. EA/thermal decomposition.
de desidratação. Também, os resultados de análise elementar indicaram que nas temperaturas de 95, 150 e 263 oC houve aumento no teor de carbono e diminuição do teor de hidrogênio. Visualmente, observou-se o escurecimento do material a 150 oC, indicando que a decomposição térmica do material iniciou-se nessa temperatura. Na temperatura de 380 oC, a diminuição do teor de carbono e hidrogênio foi devido ao avanço do processo de decomposição térmica. Os resultados da termogravimetria juntamente com aqueles da análise elementar permitiram concluir que há concordância entre as percentagens de ácido fítico encontrado na solução aquosa. O estudo cinético pelo método termogravimétrico não isotérmico mostrou que o processo de desidratação ocorreu em duas etapas. Na etapa I da desidratação ocorreu um processo de vaporização de água (ordem de reação igual a zero). Na etapa II da desidratação foi encontrada uma ordem de reação igual a cinco. Essa mudança na ordem de reação foi atribuída à perda de moléculas de água quimicamente ligada, ao ácido fítico ou à presença de substâncias voláteis. Finalmente, na etapa de decomposição térmica foi observado que a ordem da reação foi igual a um. Para as outras etapas de perda de massa não foi possível a realização do estudo cinético.
Unitermos: Análise térmica. Ácido fítico/comportamento térmico. Emulsão/estabilidade. IV/ desidratação. AE/decomposição térmica.
INTRODUCTION
Phytic acid is a naturally occurring compound formed during the ripening of seeds and cereal grains (Maga, 1982; Torre, Rodriguez, Saura-Calixto, 1991). Also called myoinositolhexaphosphoric acid, it has a molecular mass of 660 g mol–1, molecular formula C
6H18O24P6 and a structural formula as shown in Figure 1. Its physiological role in plants is as a reserve of phosphorus and energy. It is found at high levels in cereals, oilseeds and legumes, with phytate phosphorus being the major component of total phosphorus at 60–82% (Ravindran, Ravindran, Silvalogan, 1994). This substance is widely used as a nutritional supplement due to its antioxidant properties (Urbano et al., 2000), and several studies have addressed its antioxidant activity in meat products and its protective effects against oxidative damage in emulsions, increasing the shelf lives of these products (Empson, Labuza, Graf, 1991).
C u r r e n t l y, p h y t i c a c i d i s l a rg e l y u se d a s a depigmenting agent, acting through the inhibition (by chelating copper and iron ions) of tyrosinase (Arocha, 2003) and also acting as an antioxidant in bleaching hyperchromic spots. Few studies are available in the literature concerning the stability of this substance, used alone or in the presence of adjuvants. However, we have observed experimentally that phytic acid, when heated to 150 oC for around one hour, shows evidence of thermal decomposition. The resultant solution was colorless and became brown. Quirrenbach et al (2009) report the degree of interaction of phytic acid with metal ions Fe (II) and Fe (III). In the cited study it was found that phytic acid, both in solution and in the solid state, interacts strongly with the metal ions Fe (II) and Fe (III). In another study, Carli et al (2006) evaluated the thermal behavior of phytic
acid and complexation with Ni (II) and concluded that phytic acid in the form of dipotassium salt presents eight sites of protonation. In the system of phytic acid with Ni(II), seven stability constants were previously obtained, which reveals that the more deprotonated phytic acid interacts more strongly with the ion Ni (II). This fact prompted the conducting of the present study to characterize this species and its thermal behavior using several physico-chemical and analytical techniques. Of these different approaches, it was decided to opt for thermal analysis, which consists of a number of techniques for measuring a physical property of a substance or its reaction products while the substance is subjected to a controlled temperature program (Matos, Mercuri, Barros, 2009). Thermoanalytical techniques such as differential scanning calorimetry (DSC), thermogravimetry and derivative thermogravimetry (TG/ DTG), are extremely important in evaluating the stability and processes of thermal decomposition of materials, allowing their characterization, and have been used by pharmacists for over 30 years (Felix, Cides, Angnes, Matos, 2009). These techniques are important tools in the pre-formulation stage of medications, mainly because they allow the investigation of potential physical and chemical interactions between active principles and pharmaceutical adjuvants of a formula, thus allowing the prediction of
possible incompatibilities in the inal product (Araújo et al., 2003; Tomassetti et al., 2005; Giron, 1986).
(GC‑MS) (Giron, 2002; Araújo et al., 2003; Tomassetti et al., 2005; Salvio Neto, Novak, Matos, 2009).
Thus, the aim of this study was to characterize and study the thermal behavior of phytic acid by thermogravimetry (TG)/derivative thermogravimetry (DTG) and differential scanning calorimetry (DSC) and non-isothermal or dynamic thermogravimetry, combined with other techniques, such as infrared absorption spectroscopy (IR) and elemental analysis of C, H and N (EA).
MATERIAL AND METHODS
Material
Phytic acid, a product originating from China, was supplied by a distributor. According to the distributor, the sample was a minimum 50% (w/w) solution in water. This work used two different batches: a) batch No. 10072795B, a slightly yellow solution with the presence of suspended particles; b) batch No. 070204774G, a brightly transparent and colorless solution.
Methods
Thermal analysis
The studies of thermal behavior and characterization of phytic acid were performed using a calorimetric cell, model DSC–50, and a thermobalance, model TGA-51 (both of the Shimadzu brand), using the following experimental conditions: a) temperature ranges of
25‑500 °C (DSC) and 25‑900 °C (TG); b) heating rate (β)
of 10 °C min–1; c) dynamic atmosphere of N
2 (DSC) and
air (TG) at a low rate of 100 mL min–1; d) partially closed Al crucibles (DSC) and Pt crucibles (TG); e) sample mass of approximately 2 mg for the DSC experiment, and of approximately 15 mg for the TG experiment.
The non-isothermal or dynamic kinetic study was performed on the basis of thermogravimetric investigations using the method of Ozawa (1965) and the sample of phytic acid (batch 10072795B). The experiments were
performed using a thermobalance, model TGA-51 of the Shimadzu brand, with sample heating to 800 °C, and
β of 2.5, 5.0, 10 and 20 °C min–1, under a dynamic air atmosphere (50 mL min–1) using sample masses of around 18 mg in a Pt crucible. The data was treated using the model proposed by Ozawa (1965) according to the kinetic analysis program developed by Shimadzu Co. The angular
coeficient (slope) of the plot of log β against 1/T (K–1) provides the Ea of the process. Values for the frequency factor, A, and the order of reaction are also obtained in this kinetic study. The order of reaction is obtained from the plot of residual sample mass against reduced time in minutes (Ozawa, 2000; Rodante, Catalani, Vecchio, 2002; CIDES et al., 2006). A TG curve for the empty crucible was obtained for each experimental condition used in non-isothermal tests (blank curves), and subtracted from each
result obtained under the same conditions. Veriication of
the gain or loss of mass was performed using a sample of calcium oxalate CaC2O4.H2O, which exhibits three
well‑deined mass losses. For the DSC experiments, the
calibration data of the calorimetric cell were checked using standard samples of Zn0 and In0. For the temperature axis, the melting temperatures of both metals must be taken into account: 156.6 °C and 419.5 °C, respectively. For
heat low, the expected value for the enthalpy of fusion
of In0 is 28.5 J/g.
Infrared absorption spectroscopy (IR)
The infrared absorption spectra were obtained from the Central Analytical Laboratory at the USP Institute of Chemistry, using a model MB102 spectrometer of the
Bomem brand. Samples were diluted in KBr, transformed
into disks and the spectra obtained in the 4000–400 cm–1 region, with the degree of resolution achieved by 64 scans.
Elemental analysis
Determinations of levels of C, H and N were performed at the Central Analytical Laboratory at USP Institute of Chemistry using an Elemental Analyzer 2400 CHN (Perkin-Elmer).
RESULTS AND DISCUSSION
General aspects and characterization of phytic acid samples by TG/DTG
Phytic acid, the main component of this study, was received in liquid form, as indicated by the supplier as a 50% aqueous solution. The visual appearance of the sample indicated the presence of suspended particles.
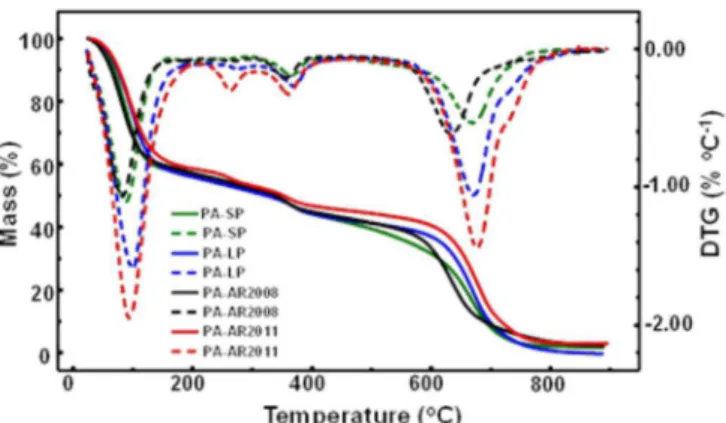
Hence, it was decided to centrifuge this sample to separate the particulate and liquid phases. A volume of 2–3 mL of sample of the material as received was transferred to a centrifuge tube and spun at 2300 rpm for 15 minutes. Two phases were obtained: a) supernatant and b) solid product (SP). The solid and liquid phases were studied by thermogravimetry. The superposition of the TG/DTG curves is shown in Figure 2. It can be observed that the thermogravimetric profiles of the received sample (AP-AR-2008), the solid (PA-SP), and the liquid portion (PA-LP) are similar to each other, indicating they are from the same species, and thus the entire study was conducted with the sample as received
without puriication. However, due to lack of material for the inal tests, a new order was placed with the distributor
who supplied a new sample in early 2011 (PA–AR– 2011). This sample was a clear, colorless, viscous liquid without the presence of particles in suspension. The TG/ DTG curves of this new sample (Figure 2) indicated a lower water content while the DTG curve showed slight differences in mass loss profile in the range between 200 and 300 oC. However, the thermal stability of both samples was similar and thus the last experiment (study of the kinetics of thermal decomposition and IR spectra of the product during heating) was carried out with the sample AR2011-PA.
Evaluation of the intermediate products of the thermal decomposition of phytic acid by infrared spectroscopy and elemental analysis
Figure 3 shows the infrared spectra of phytic acid and samples of the material isolated after heating phytic acid to temperatures of 95, 150, 263 and 380 °C. This
procedure was applied in an attempt to characterize the possible intermediate products of the process of thermal decomposition of phytic acid. It was found that the absorption band at 3500 cm-1 related to OH stretching was altered with increasing temperature. This may be explained by the loss of water and formation of carbonized material, as the sample was gradually darkening with increasing temperature. The other absorption bands of all samples were very similar in wavenumbers, indicating that even at the temperature of 380 oC the infrared spectrum corresponds to that of phytic acid.
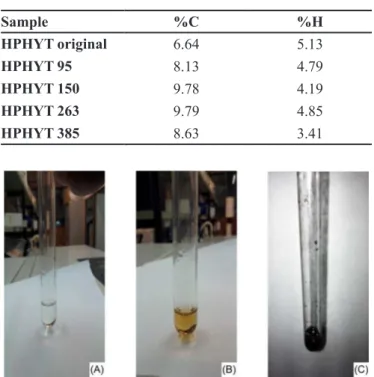
Table I depicts the elemental analysis results for original phytic acid (no heat treatment) and samples heat treated and collected at temperatures of 95, 150, 263 and 380 °C. The samples collected at 95, 150 and 263 °C showed an increase in carbon content and reduction in hydrogen content compared with the original phytic acid sample. This result was expected because upon heating there is initially elimination of H2O followed by the start of carbonization of the material. At the temperature of 380 °C, there was a decrease in carbon and hydrogen due to thermal decomposition with elimination of carbon in the form of CO2. Figures 4 (A), (B) and (C) show photos of phytic acid samples: (A) original, (B) held at 150 °C for approximately 1 hour, (C) held at 150 °C for 24 hours. On visual assessment of the three samples, it was found that the phytic acid sample takes on a chestnut hue after being held at 150 °C for about 1 hour and becomes increasingly dark over time. After 24 hours, it became completely darkened, clearly indicating the occurrence of the carbonization process, even at this temperature.
FIGURE 2 -TG/DTG curves obtained at 10 °C min–1 under a
dynamic air atmosphere for the samples: phytic acid as received (PA–AR2008), phytic acid as received (PA–AR2011), phytic acid solid product (PA–SP) and phytic acid liquid product (PA–LP).
TABLE I - Results of elemental analysis for phytic acid (HPHYT) products isolated at different temperatures
Sample %C %H
HPHYT original 6.64 5.13
HPHYT 95 8.13 4.79
HPHYT 150 9.78 4.19
HPHYT 263 9.79 4.85
HPHYT 385 8.63 3.41
FIGURE 4 - Pictures of phytic acid samples: (A) original; (B) held at 150 °C for 1 h; (C) held at 150 °C for 24 h.
Study of thermal behavior of phytic acid
The TG/DTG plots for phytic acid (Figure 5) show a
loss of mass in four stages. The irst event, with mass loss of
40.8%, occurred between 25 and around 160 oC (DTG T peak = 83 °C) and corresponds to the removal of water present in the solution. However, when the material was maintained at a temperature of 150 °C signs of carbonization can be seen (Figure 4). After one hour, the solution became brownish and after 24 hours at the same temperature turned black. The second event occurred between 162 and 292 oC with
∆m = 5.5%. The expansion of the DTG curve over this temperature range (inserted in Figure 5) showed at least two stages of mass loss (Tpeak = 222 and 256 oC). The third event occurred between 248 and 447 oC with
∆m = 9.2% (DTG Tpeak = 364 oC). The second and third events can be attributed to the carbonization process and dehydration due to the decomposition of OH groups present in the acid. The infrared spectrum of the isolated product at a temperature of 380 oC (Figure 3) was characteristic of the original phytic acid. The fourth event occurred between 447 and 863 oC (∆m = 41.5% and DTG Tpeak = 648 oC) and was due to the process of thermal decomposition of phytate groups and the elimination of elemental carbon formed in the previous steps. At the temperature of 870 oC, the accumulated mass loss was 97%.
The DSC curve showed an endothermic event between 21 °C and 120 °C, characteristic of the elimination of water of solution (Tpeak = 48.17 °C). The second event is endothermic and can be associated with the onset of thermal decomposition due to carbonization of the sample and removal of the OH groups from the acid (Tpeak = 156.90 °C). The third event observed in the DSC curve is exothermic (Tpeak = 325.5 °C) and corresponds to the third mass loss shown in the TG/DTG curves. Table II summarizes the events of TG/DTG and DSC.
The 6.31% carbon content found on elemental analysis of the aqueous solution of phytic acid sample as received, corresponds stoichiometrically to 57.8% free acid. Moreover, the first mass loss of 40.8% seen in the TG/DTG curves of this aqueous solution, which corresponds to the elimination of water, indicates a percentage of free phytic acid of 59.2%. On comparing the results of thermogravimetry to those of elemental analysis, it can be concluded there is agreement for the percentages of phytic acid found in the aqueous solution. According to
the speciications of the supplier, this solution had a phytic
acid content of at least 50%.
Given the thermogravimetric profile exhibited by phytic acid, showing two main stages of mass loss (dehydration and thermal decomposition), it was decided to perform the kinetic study of these steps using non-isothermal thermogravimetric methods.
.
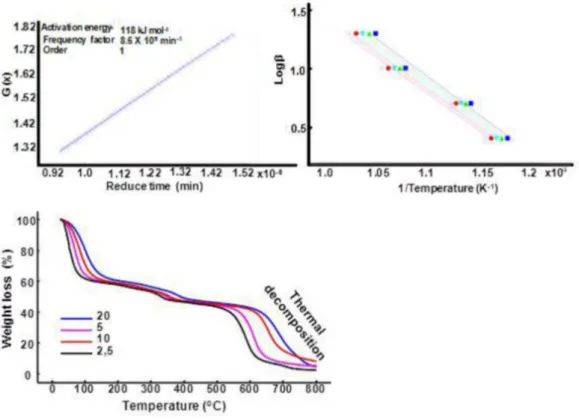
The TG curves (Figures 6, 7 and 8) were obtained at different heating rates (2, 5, 10 and 20 °C min–1), from which it can be seen clearly that with increased heating rate, the thermal processes have shifted to higher
FIGURE 5 - TG/DTG and DSC curves obtained at 10 °C min–1
temperatures, both for the dehydration step and thermal decomposition step. From these results, plots were
obtained of β against log 1/T and of G(X) against reduced time for dehydration step I that occurred in weight loss between 7.5 – 14.8% (Figure 6), dehydration step II that occurred in mass loss between 11.5 - 24% (Figure 7) and the thermal decomposition step that occurred between 70- 80% (Figure 8) using the model proposed by Ozawa and according to the kinetic analysis program developed by
Shimadzu. Ea for each step was obtained from the plots of
log β against 1/T and values corresponding to the order of reaction and frequency factor were determined from plots of G(X) against reduced time.
In dehydration step I (Δm = 7.5 –14.8%), it was
observed that the order of the reaction was equal to zero. This reaction order is consistent with a process of water removal by vaporization. This is explained by the fact the sample is a 50% phytic acid solution in water. The increased concentration of the phytic acid solution due to water evaporation led to a change in the kinetics of dehydration. Therefore, in dehydration step
II (Δm = 11.5 – 24%) it was found that the order of the
reaction was equal to five. This change in kinetics of dehydration may suggest a complex process of loss of chemically bonded water molecules of phytic acid, or the presence of volatile substances due to the beginning of the carbonization process of the sample (Figures 4B and 4C). Finally, in the thermal decomposition step it was observed that the reaction order was equal to one. The other stages of mass loss did not allow perform of a kinetic study because
TABLE II - TG/DTG and DSC phytic acid data
Steps TG/DTG DSC
∆m (%) Tpeak DTG (
oC) T
peak DSC ( oC)
1 40.8 83 48.2
2 5.5 222 and 256 156.9
3 9.2 364 325.5
4 41.5 648
-TABLE III- Values of range of weight loss, Ea, A and reaction order obtained in non-isothermal kinetic study
Step Range of weight loss Ea (kJ mol-1) A (min-1) Order
Dehydration step I 7.5 –14.8% 52 3.9x10⁶ 0
Dehydration step II 11.5 – 24% 46 9.65x10⁵ 5
FIGURE 6 -TG curves obtained in a dynamic air atmosphere (50 mL min–1) with β = 2.5, 5, 10 and 20 °C min–1, and corresponding curves of log heating rate (log β) as a function of inverse temperature (K–1) and the plot of G(X) against inverse temperature for
FIGURE 7 - TG curves obtained in a dynamic air atmosphere (50 mL min–1) with β = 2.5, 5, 10 and 20 °C min–1, and corresponding curves of log heating rate (log β) as a function of inverse temperature (K–1) and the plot of G(X) against inverse temperature for
dehydration step II of phytic acid sample.
FIGURE 8 - TG curves obtained in a dynamic air atmosphere (50 mL min–1) with β = 2.5, 5, 10 and 20 °C min–1, and corresponding curves of log heating rate (logβ) as a function of inverse temperature (K–1) and the plot of G(X) against inverse temperature for
there was no significant temperature offset to higher values when the heating rate was increased. Table II lists the values of the parameters corresponding to the kinetic triplets and range of weight loss for both steps.
CONCLUSION
The results obtained showed the importance of thermoanalytical techniques (TG/DTG and DSC) in the characterization and study of the thermal behavior of phytic acid. The kinetic method by non-isothermal TG allowed the determination of kinetic parameters of the two main stages of mass loss (dehydration and thermal decomposition) of phytic acid. The techniques of infrared absorption spectroscopy and elemental analysis were essential to complement the data from thermal analysis in order to better characterize the sample of phytic acid and evaluate its possible thermal decomposition products. The
kinetic study allowed the assessment of both the irst and
the second dehydration steps, showing both loss of free water in the sample and loss of chemically bonded water molecules of phytic acid.
ACKNOWLEDGEMENTS
The authors acknowledge to Conselho Nacional
de Desenvolvimento Cientíico e Tecnológico (CNPq),
Coordenação de Aperfeiçoamento de Pessoal de Nível Superior (CAPES) and Fundação de Amparo à Pesquisa do Estado de São Paulo (FAPESP).
REFERENCES
ARAÚJO, A.A.S.; STORPIRTIS, S.; MERCURI, L.P.; CARVALHO, F.M.S.; SANTOS FILHO, M.; MATOS, J.R. Thermal analysis of the antiretroviral Zidovudine (AZT) and evaluation of the compatibility with adjuvant used in solid
dosage forms. Int. J. Pharm., v.206, n.2, p.303-314, 2003.
AROCHA, J.R. Nuevas opciones en el tratamiento del melasma. Dermat. Venez. v.41, n.3, p. 11-13, 2003.
CARLI, D.L.; ROSSO, N.D.; SCHNITZLER, E.; CARNEIRO, P.I.B. Estudo da estabilidade do ácido fítico e o íon Ni(II). Cienc. Tecnol. Aliment., v.26, n.1, p.19-26, 2006.
CIDES, L.C.S.; ARAÚJO, A.A.S.; SANTOS-FILHO, M.; MATOS, J.R. Thermal behaviour, compatibility study and decompositions kinetics of glimepiride under isothermal
and non-isothermal conditions. J. Therm. Anal. Calorim.,
v.84, n.2, p.441-445, 2006.
COSGROVE, D.J. The isolation of myoinositolpentaphosphates
from hydrolysates of phytic acid. Biochem. J., v.89, n.1,
p.172-175, 1963.
EMPSON, K.L.; LABUZA, T.P.; GRAF, E. Phytic acid as a
food antioxidant. J. Food Sci., v.56, n.2, p.560-563, 1991.
FELIX, F.S.; CIDES, L.C.S.; ANGNES, L.; MATOS, J.R. Thermal behavior study and decomposition kinetics of Salbutamol under isothermal and non-isothermal
conditions. J. Therm. Anal. Calorim., v.95, n.3, p.877-880,
2009.
G I R O N , D . A p p l i c a t i o n s o f t h e r m a l a n a l y s i s i n t h e
pharmaceutical industry. J. Pharm. Biomed. Anal., v.4,
n.6, p.755-770, 1986.
GIRON, D. Applications of thermal analysis and coupled
techniques in pharmaceutical industry. J. Therm. Anal.
Calorim., v.68, n.2, p.335-357, 2002.
LEE, B.J.; HENDRICKS, D.G. Phytic acid protective effect
against beef round muscle lipid peroxidation. J. Food Sci.,
v.60, n.2, p.241-244, 1995.
MAGA, J.A. Phytate: its chemistry, occurrence, food interactions, nutritional significance, and methods of
analysis. J. Agric. Food Chem., v.30, n.1, p.1-9, 1982.
MATOS, J.R.; MERCURI, L. BARROS, G. Análise térmica aplicada a fármacos e medicamentos. In: STORPIRTIS, S. et al. (Eds.). Biofarmacotécnica. Rio de Janeiro: Guanabara
Koogan, 2009. v.1, n.1, p.32‑48.
OZAWA, T. A new method of analyzing thermogravimetric
data. Bull. Chem. Soc. Jpn., v.38, n.11, p.1881-1886, 1965.
OZAWA, T. Thermal analysis: review and prospect. Thermochim.
Acta, v.355, n.1-2, p.35-42, 2000.
QUIRRENBACH, H.R.; KANUMFRE, F.; ROSSO, N.D.;
CARVALHO FILHO, M.A. Comportamento do ácido fítico
na presença de Fe(II) e Fe(III). Cienc. Tecnol. Aliment., v.29,
n.1, p.24-32, 2009.
RAVINDRAN, V.; RAVINDRAN, G.; SILVALOGAN, S. Total and phytate phosphorus contents of various foods and
feedstuffs of plant origin. Food Chem., v.50, n.2,
RODANTE, F.; CATALANI, G.; VECCHIO, S. Kinetic analysis
of single or multi-step decomposition processes. J. Therm.
Anal. Calorim., v.68, n.2, p.689-713, 2002.
SALVIO NETO, H.; NOVÁK, C.; MATOS, J.R. Thermal
analysis and compatibility studies of predinicarbate with
excipients used in semi solid pharmaceutical form. J.
Therm. Anal. Calorim.,v.97, n.1, p.367-374, 2009.
TOMASSETTI, M.; CATALANI, A.; ROSSI, V.; VECCHIO, S. Thermal analysis study of interaction between acetoaminophen and excipients in solid dosage forms and
in some binary mixtures. J. Pharm.Biomed. Anal., v.37,n.5,
p.949-955, 2005.
TORRE, M.; RODRIGUEZ, A.R.; SAURA-CALIXTO, F. Effects of dietary fiber and phytic acid on mineral
availability. CRC Crit. Rev. Food Sci. Nutr., v.1, n.1,
p.1-22, 1991.
URBANO, G.; LOPEZ-JURADO, M.; ARANDA, D.; VIDAL-VALVERDE, C.; TENÓRIO, E.; PORRES, J. The role of
phytic acid in legumes: antinutrient or beneicial function?
J. Physiol. Biochem., v.56, n.3, p.283-294, 2000.
Received for publication on 11th November 2012