*Corresponding author: Ali Kamal Attia, Tel: +20 238702103, Fax: +20 235855582, Email: alikamal1978@hotmail.com
©
2015 The Authors. This is an Open Access article distributed under the terms of the Creative Commons Attribution (CC BY), which permits Adv Pharm Bull, 2015, 5(4), 523-529
doi: 10.15171/apb.2015.071 http://apb.tbzmed.ac.ir
Advanced
Pharmaceutical
Bulletin
Thermal Analysis Investigation of Dapoxetine and Vardenafil
Hydrochlorides using Molecular Orbital Calculations
Ali Kamal Attia1*, Eglal R. Souaya2, Ethar A. Soliman1
1
National Organization for Drug Control and Research, P.O. Box 29, Cairo, Egypt. 2
Department of Chemistry, Faculty of Science, Ain Shams University, Egypt.
Introduction
Dapoxetine hydrochloride (DAP) is designated chemically as N, N dimethyl-3-(naphthalen-1-yloxy)-1-phenylpropan-1-amine. It is mainly used as selective short acting potent serotonin reuptake inhibitor (SSRI). It is effective for the treatment of premature ejaculation in men.1,2
Vardenafil hydrochloride (VAR), is chemically 2-[2- ethoxy-5(4-ethyl-piperazine-1-sul-phonyl)-phenyl]-5-methyl-7-propyl-3H-imidazo 5,1-f] [1-3] triazin-4-one hydrochloride. It is used to treat erectile dysfunction.3
Thermal analysis has been an extremely important analytical tool within the pharmaceutical industry where the rapid advances in pharmaceutical industries have led to an increased demand for the chemical and structural information about the pharmaceutical systems. Thermal analysis is a group of techniques in which the variation of a physical property of a substance is measured as a function of temperature. The most commonly used are those which measure changes of mass or changes in energy of a sample of a substance. These techniques such as thermogravimetric analysis (TGA), derivative thermogravimetry (DrTGA), differential thermal analysis (DTA) and differential scanning calorimetry (DSC) provide unique information in relation to thermodynamic data of the system studies. Several studies have been reports the importance of thermal analysis in characterization, polymorphism identification, and purity evaluation of drugs, compatibility studies for the
pharmaceutical formulation, stability and drugs thermal decomposition.4-16
No previous publications were made before for the study of thermal behavior of DAP and VAR. Therefore, the present work aimed to study the thermal behavior of DAP and VAR using different techniques such as TGA, DrTGA, DTA and DSC, the results were confirmed using semi-empirical molecular orbital calculations to determine the weakest bonds ruptured during thermal degradation of the used drugs. Therefore, the correct pathway of degradation knowing this structural session of bonds can be used to predict the active sites of theses drugs responsible for its chemical reactivities.17-21
Materials and Methods Materials
Dapoxetine hydrochloride, (Batch number:
511DAPF017, purity 99.92%.) and Joypox tablets (60 mg DAP per tablet) were provided from Eva Pharma, Egypt and South Egypt for Drug Industries Company (SEDICO) for Inspire Pharmaceutical Company (IPC Pharma), Egypt, respectively.
Vardenafil hydrochloride trihydrate, (Batch number: UT 2130107, purity 99.94%) and Rectivard tablets (20 mg VAR per tablet) were provided from Eva Pharma, Egypt and Marcyrl Pharmaceutical Industries Company, El-Obour City, Egypt, respectively.
Research Article
Article History: Received: 20 May 2015 Revised: 20 June 2015 Accepted: 30 July 2015 ePublished: 30 November 2015
Keywords:
Dapoxetine hydrochloride Vardenafil hydrochloride Thermal analysis Differential scanning
calorimetry Purity
Molecular orbital calculations
Abstract
Purpose: Thermal analysis techniques have been used to study the thermal behavior of
dapoxetine and vardenafil hydrochlorides and confirmed using semi-empirical molecular orbital calculations.
Methods: Thermogravimetric analysis, derivative thermogravimetry, differential thermal
analysis and differential scanning calorimetry were used to determine the thermal behavior and purity of the drugs under investigation. Thermodynamic parameters such as activation energy, enthalpy, entropy and Gibbs free energy were calculated.
Results: Thermal behavior of DAP and VAR were confirmed using by semi-empirical
molecular orbital calculations. The purity values were found to be 99.97% and 99.95% for dapoxetine and vardenafil hydrochlorides, respectively. The purity of dapoxetine and vardenafil hydrochlorides is similar to that found by reported methods according to DSC data.
Conclusion: Thermal analysis justifies its application in quality control of pharmaceutical
Attia et al.
Instruments and Methods
Thermal analysis studies were made by using simultaneous TGA-DTA thermal analyzer apparatus (Shimadzu DTG-60H). The experiments were performed between ambient and 800 oC. The temperature program
had a heating rate 10 °C min-1. Dry nitrogen at a flow
rate of 30 mL min-1 was used as the purge gas. α-Al 2O3
was used as the reference material.
Semi-empirical molecular orbital (MO) calculations were done by using hyperchem 8.0 program (AM1 method), the most important parameters calculated using MO calculation are bond length, bond order and charge distribution.17-21
Thermodynamic parameters such as Arrhenius constant (A), activation energy (E), enthalpy (H), entropy (S) and Gibbs free energy (G) were calculated using Horowitz-Metzger and Coats-Redfern methods.22,23
DSC curves were measured on Shimadzu DSC-50 cell. Approximately 3 mg of samples were mass out and placed in a sealed aluminum pan. An empty aluminum pan was used as a reference. The purity determination was performed in temperature range from 25 to 500 °C in nitrogen atmosphere with flow rate of 30 mL min-1
using heating rate of 10°C min-1. DSC equipment was
preliminary calibrated with standard of indium.
Results and Discussion
Thermal analysis of DAP and VAR
Figure 1 shows the TGA, DrTGA and DTA curves of DAP and VAR. DAP is thermally stable up to 158.12°C, and then decomposes in two steps. The thermal decomposition of VAR occurs in five consecutive steps.
Thermal Analysis of Dapoxetine and Vardenafil
For DAP, the first step occurs in two consecutive stages, the first stage at temperature range 158.12-246.39 °C is due to the loss of HCl molecule (Mass loss: Found 10.451%, Calc. 10.676%) and the second stage is due to the loss of C17H19NO (Mass loss: Found 73.483%, Calc. 74.0%) at
246.39-330.32 °C. The second step occurs at 330.32-602.10
oC with the loss of C
4H4 (Mass loss: Found 15.497%, Calc.
15.21%). These results indicate the compatibility between mass fragmentation and thermal degradation of DAP.24
The DTA curve of DAP shows two endothermic peaks and two exothermic peaks. The first endothermic peak at 183.57 °C is sharp and may be attributed to the melting point of DAP, this value is close to the reported melting point of DAP (179-183 °C).25 The second endothermic peak at
288.06 °C and the exothermic peak at 309.88 °C are broad and may be due to the loss of HCl and C17H19NO. Very
strong and sharp exothermic peak at 553.70 °C may be due to the loss of C4H4.
For VAR, the first step occurs in the temperature range from 22.84 °C to 191.84 °C with the loss of HCl molecule 6.285% (Mass loss: Found 6.285%, Calc. 6.303%). The second step occurs at 191.84-245.38 °C with the loss of three molecules of water (Mass loss: Found 9.342%, Calc. 9.324%). The third step occurs at 245.38-370.60 °C due to the mass losses of SO2, C6H13N2, C3H7 and CH3 (Mass loss:
Found 40.872%, Calc. 40.580%). The fourth step occurs at 370.60-476.10 °C due to loss of C3N2 (Mass loss: Found
11.077%, Calc. 11.051%). It is followed by the fifth practical weight loss of 32.904%. This loss may be due to the complete decomposition of C10H7N2O2 that occurs at
476.10-640.02 °C (Mass loss: Calc. 32.291%). These results indicate that, the compatibility between mass fragmentation and thermal degradation of VAR.26
The DTA curve of VAR shows four endothermic peaks and an exothermic peak. The first weak endothermic peak at 108.50 °C may be attributed to the loss of HCl molecule. The second endothermic peak at 218.38 °C may be attributed to melting point of VAR, this value is very close to the reported melting point of VAR (218 °C)25 the melting
process is accompanied with the loss of three molecules of water. The third endothermic peak at 295.20 °C may be due to the losses of SO2, C6H13N2, C3H7 and CH3. The fourth
endothermic peak at 406.48 °C may be due to the loss of C3N2. Very strong and sharp exothermic peak at 577.8 °C
may be due to the loss of C10H7N2O2. Figure 2 shows the
thermal decomposition pattern of DAP and VAR.
MO calculationsof DAP and VAR
MO calculations depending on numbering system of DAP and VAR give variable information about the structure of the molecules which actually be used to support the experimental results. Figure 2 shows the numbering of DAP and VAR.
MO calculation data for DAP reveal that the loss of C17H19NO in the first step of decomposition is due to the
rupture of C13-C14bond (bond length = 1.536 Å and bond order = 0.975), C12-C13bond (bond length = 1.528 Å and
bond order = 0.982), C14-C15 bond (bond length = 1.512 Å and bond order = 0.967), C14-N21bond (bond length = 1.507 Å and bond order = 0.964), N21-C22bond (bond length = 1.483 Å and bond order = 0.994), N21-C23bond (bond length = 1.480 Å and bond order = 0.992) and O11-C12 bond (bond length = 1.431 Å and bond order = 0.950). The loss of C4H4 in the second step is due to the rupture of
C3-C4bond (bond length = 1.422 Å and bond order = 1.218) and C5-C6bond (bond length = 1.421 Å and bond order = 1.221).
MO calculations of VAR revealed that in the third decomposition step, the losses of SO2 and C6H13N2 are due
to the rupture of C1-S24bond (bond length = 1.786 and Å bond order = 0.712), S24-N27bond (bond length = 1.772 Å and bond order = 0.695), the losses of C3H7 and CH3 are
due to the rupture of C17-C21bond (bond length = 1.488 Å and bond order = 0.971), C19-C20bond (bond length = 1.473 Å and bond order = 0.998), respectively. The rupture of C13-C14 bond (bond length = 1.449 Å and bond order = 1.001) and N11-N12bond (bond length = 1.388 Å and bond order = 1.021) causes the loss of C3N2 and C10H7N2O2 for
the fourth and the fifth steps, respectively.
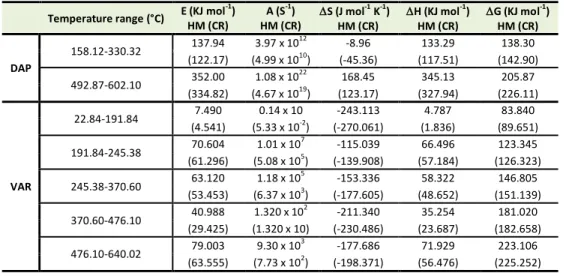
Thermodynamic parameters of DAP and VAR
Horowitz-Metzger (HM) and Coats-Redfern (CR) methods were applied for calculating the activation energy (E) values required for the mass losses during thermal decomposition steps of DAP and VAR and the other thermodynamic parameters (A, S, H and G). The negative values of S may refer to the stability of the loosed fragments obtained as a result of thermal decomposition of DAP and VAR, on the other hand the of the second step of decomposition of DAP shows high positive values of S (168.45 (HM) and 123.17 (CR) J mol-1 K-1) may refer to the high activity and volatility
of the loosed C4H4 fragments. The results are listed in Table
1, from these results we conclude that DAP is more stable than VAR.
Determination of purity of DAP and VAR
The determination of purity of the used compounds in chemistry is very important, chromatographic methods are used to determine purity of the used compounds in comparison with a standard samples. On the other hand, DSC technique can be used for the determination of purity based on the assumption that the impurities will lower the melting point of a pure substance. The melting transition of pure (100% crystalline substance) should be infinitely sharp, but impurities or defects in the crystal structure will broaden the melting range and lower the melting point.27 In
a system which contains impurities, Van’t Hoff equation approximately holds and allows the purity valueto be calculated as follow: Tf = T0 – [(R T02 x/∆Hf). 1/F] where Tf
is the melting temperature of the sample, T0 is the melting
point of pure substance in Kelvin (K), R is the gas constant, ∆Hf is the heat of fusion, F is fraction of sample melted at
Tf, and xis mole fraction of impurities in the original
Attia et al.
Figure 2. Thermal decomposition of patterns, numbering of DAP and VAR.
Table 1. Thermodynamic parameters of thermal decomposition of DAP and VAR.
Temperature range (°C) E (KJ mol
-1
) HM (CR)
A (S-1) HM (CR)
S (J mol-1 K-1) HM (CR)
H (KJ mol-1) HM (CR)
G (KJ mol-1) HM (CR)
DAP
158.12-330.32 137.94 3.97x 10 12
-8.96 133.29 138.30 (122.17) (4.99 x 10¹⁰) (-45.36) (117.51) (142.90)
492.87-602.10 352.00 1.08 x 10 22
168.45 345.13 205.87 (334.82) (4.67 x 10¹⁹) (123.17) (327.94) (226.11)
VAR
22.84-191.84 7.490 0.14 x 10 -243.113 4.787 83.840 (4.541) (5.33 x 10⁻²) (-270.061) (1.836) (89.651)
191.84-245.38 70.604 1.01 x 10 7
-115.039 66.496 123.345 (61.296) (5.08 x 10⁵) (-139.908) (57.184) (126.323)
245.38-370.60 63.120 1.18 x 10 5
-153.336 58.322 146.805 (53.453) (6.37 x 10³) (-177.605) (48.652) (151.139)
370.60-476.10 40.988 1.320 x 10 2
-211.340 35.254 181.020 (29.425) (1.320 x 10) (-230.486) (23.687) (182.658)
476.10-640.02 79.003 9.30 x 10 3
Thermal Analysis of Dapoxetine and Vardenafil
Figure 3 shows the DSC curves of DAP and VAR, very strong and sharp endothermic peaks appear at 181.75°C and 218.93 °C which may be attributed to the melting of DAP and VAR, respectively.
Figure 3. DSC curves of DAP and VAR.
The purity values of DAP and VAR are found to be 99.97% and 99.95%, respectively. These values are very good when compared with the purity of the used drugs 99.92% and 99.94% for DAP and VAR, respectively. DSC curve of VAR shows two weak endothermic peaksat 255.86°Cand 290.81 °C and medium endothermic peak at 278.51°C. The results are listed in Table 2.
Applications of thermal analysis on Joypox and Rectivard tablets
Figure 4 A shows the DTA curves of Joypox and Rectivard tablets, the dosage forms of DAP and VAR, respectively. The endothermic and exothermic peaks of DAP and VAR (Figure 1) are different in their values and shapes in comparison with the endothermic and exothermic peaks of Joypox and Rectivard tablets. An endothermic peak appears at 148.25 °C and a broad endothermic peak between 156.61 °C and 280.67°C in DTA curves of Joypox and Rectivard tablets which may be attributed to the melting their active ingredients, DAP and VAR, respectively. These values are smaller than that of pure drugs 183.57 °C and 218.38°C for DAP and VAR, respectively according to the presence of excipients in tablets which act as impurities and decreasing the melting point of the drugs. Also the strong and sharp exothermic peaks at 553.70°C and 577.81°C for DAP and VAR appear as very weak and broad peaks between 390.26 °C and 724.97°C and between 419.35 °C and 678.89°C in case of Joypox and Rectivard tablets, respectively. Figure 4 B shows the DTA curves of excipients. The results are listed in Table 2.
Table 2. Melting point and degree of purity of DAP and VAR and endothermic and exothermic peaks of inactive ingredients.
Drug
Melting point (°C) Degree of purity (%)
DTA method Melting point
apparatus DSC Method Literature
25
DSC Reported
DAP 183.57 180.34 181.75 179.00-183.00 99.97 99.92
VAR 218.38 218.22 218.93 218.00 99.95 99.94
Endothermic and exothermic peaks of inactive ingredients
Peak (°C) Lactose
monohydrate Starch
Magnesium stearate
Microcrystalline
cellulose Povidone
Endothermic 149.97,215.42 67.97 375.07 325.30 65.95
Exothermic 358.42,530.52
327.32, broad peak between 338.63 and
613.74
396.67,418.70,458.59
357.62, broad peak
at 533.70
428.31, broad peak between 442.85 and
634.74
Figure 5 shows the DSC curves of Joypox and Rectivard tablets, weak and sharp endothermic peaks at 144.62°C and 187.68°C which may be attributed to melting of DAP and VAR in tablets, respectively. These melting points values are lesser than the listed values of DAP and VAR in Table 2. The decreasing in melting points values is due to the presence of excipients. Other broad and weak endothermic peaks appear at 192.21°C (Joypox tablets), 66.99 °C and 217.24°C (Rectivard tablets).
Conclusion
This paper is the first attempt to study the thermal behavior of DAP and VAR using thermal analysis and
Attia et al.
work reveals the importance of the thermal analysis and DSC techniques for the quality control of drugs.
Figure 4. DTA curves of Joypox and Rectivard tablets (A) and
some inactive ingredients (B).
Figure 5. DSC curves of Joypox and Rectivard tablets.
Acknowledgments
The authors would like to express their gratitude to the National Organization for Drug Control and Research (NODCAR, Egypt) and Department of Chemistry at Faculty of Science (Ain Shams University, Egypt) for providing instruments and the means necessary to accomplish this work.
Ethical Issues Not applicable.
Conflict of Interest
The authors report no conflicts of interest.
References
1. McMahon CG. Dapoxetine: A new option in the medical management of premature ejaculation. Ther Adv Urol 2012;4(5):233-51. doi:
10.1177/1756287212453866
2. Pastore AL, Palleschi G, Leto A, Pacini L, Iori F, Leonardo C, et al. A prospective randomized study to compare pelvic floor rehabilitation and dapoxetine for treatment of lifelong premature ejaculation. Int J Androl 2012;35(4):528-33. doi: 10.1111/j.1365-2605.2011.01243.x
3. Bakshi M, Singh S. Development of validated stability-indicating assay methods--critical review. J Pharm Biomed Anal 2002;28(6):1011-40.
4. Craig DQM, Reading M. Thermal Analysis of Pharmaceuticals. New York: CRC Press; 2007. 5. Enman J, Patra A, Ramser K, Rova U, Berglund KA.
Solid state characterization of sodium eritadenate. Am
J Anal Chem 2011;2(2):164-73.
doi:10.4236/ajac.2011.22019
6. Gabbott P. Principles and Applications of Thermal Analysis. Oxford, UK: Blackwell Publishing; 2008. 7. Caira MR, Foppoli A, Sangalli ME, Zema L,
Giordano F. Thermal and structural properties of ambroxol polymorphs. J Therm Anal Calorim
2004;77(2):653-62. doi:
10.1023/B:JTAN.0000039001.05945.42
8. Freitas MN, Alves R, Matos JR, Marchetti JM. Thermal analysis applied in the osmotic tablets pre-formulation studies. J Therm Anal Calorim 2007;87(3):905-11. doi: 10.1007/s10973-006-7710-3 9. Cides LCS, Araújo AAS, Filho MS, Matos JR. Thermal behaviour, compatibility study and decomposition kinetics of glimepiride under isothermal and non-isothermal conditions. J Therm
Anal Calorim 2006;84(2):441-5. doi:
10.1007/s10973-005-7131-8
10.Abdel-Razeq SA, Salama NN, Abdel-Atty S, El-Kosy N. Thermoanalytical study and purity determination of azelastine hydrochloride and emedastine difumarate. Pharmaceut Anal Acta 2012;3(8):1-4. doi: 10.4172/2153-2435.1000176 11.Laszcz M, Kosmacinska B, Korczak K, Smigielska
Thermal Analysis of Dapoxetine and Vardenafil
pharmaceutical excipients. J Therm Anal Calorim 2007;88(2):305-10. doi: 10.1007/s10973-006-8001-8 12.Macedo RO, Nascimento TG, Veras JWE. Compatibility and stability studies of propranolol hydrochloride binary mixtures and tablets for TG and
DSC-Photovisual. J Therm Anal Calorim
2002;67(2):483-9. doi: 10.1023/A:1013901332759
13.Oliveira GGG, Ferraz HG, Matos JSR.
Thermoanalytical study of glibenclamide and excipients. J Therm Anal Calorim 2005;79(2):267-70. doi: 10.1007/s10973-005-0047-5
14.Porter WW, 3rd, Elie SC, Matzger AJ. Polymorphism in carbamazepine cocrystals. Cryst Growth Des 2008;8(1):14-6. doi: 10.1021/cg701022e
15.Attia AK, Mohamed Abdel-Moety M.
Thermoanalytical investigation of terazosin hydrochloride. Adv Pharm Bull 2013;3(1):147-52. doi: 10.5681/apb.2013.025
16.Attia AK, Ibrahim MM, El-Ries MA. Thermal analysis of some antidiabetic pharmaceutical compounds. Adv Pharm Bull 2013;3(2):419-24. doi: 10.5681/apb.2013.067
17.Al-Nahary TT, El-Ries MA, Mohamed GG, Attia AK, Mabkhot YN, Haron M, et al. Multiclass analysis on repaglinide, flubendazole, robenidine hydrochloride and danofloxacin drugs. Arab J Chem 2013;6(1):131-44. doi: 10.1016/j.arabjc.2012.01.012 18.Zayed MA, Fahmey MA, Hawash MF. Investigation
of diazepam drug using thermal analyses, mass spectrometry and semi-empirical mo calculation. Spectrochim Acta A Mol Biomol Spectrosc 2005;61(5):799-805. doi: 10.1016/j.saa.2004.06.003 19.Zayed MA, Hawash MF, Fahmey MA. Structure
investigation of codeine drug using mass spectrometry, thermal analyses and semi-emperical molecular orbital (mo) calculations. Spectrochim
Acta A Mol Biomol Spectrosc 2006;64(2):363-71. doi: 10.1016/j.saa.2005.07.032
20.Zayed MA, Fahmey MA, Hawash MA, El-Habeeb AA. Mass spectrometric investigation of buspirone drug in comparison with thermal analyses and mo-calculations. Spectrochim Acta A Mol Biomol
Spectrosc 2007;67(2):522-30. doi:
10.1016/j.saa.2006.08.021
21.Belal AA, Zayed MA, El-Desawy M, Rakha Sh M. Structure investigation of three hydrazones schiff's bases by spectroscopic, thermal and molecular orbital calculations and their biological activities. Spectrochim Acta A Mol Biomol Spectrosc 2015;138:49-57. doi: 10.1016/j.saa.2014.10.091 22.Horowitz HH, Metzger G. A new analysis of
thermogravimetric traces. Anal Chem
1963;35(10):1464-8. doi: 10.1021/ac60203a013 23.Coats AW, Redfern JP. Kinetic parameters from
thermogravimetric data. Nature 1964;201:68-9. doi:10.1038/201068a0
24.Li L, Low MY, Ge X, Bloodworth BC, Koh HL. Isolation and structural elucidation of dapoxetine as an adulterant in a health supplement used for sexual performance enhancement. J Pharm Biomed Anal 2009;50(5):724-8. doi: 10.1016/j.jpba.2009.06.005 25.O'Neil MJ, Heckelman PE, Koch CB, Roman KJ.
The Merck index: An Encyclopedia of Chemicals, Drugs and Biologicals. 14th ed. Whitehouse Station, NJ, USA: Merck & Co. INC; 2006.
26.Popescu AM, Radu GL, Onisei T, Raducanu AE, Niculae CG. Detection by gas chromatography-mass spectrometry of adulterated food supplements. Rom Biotechnolog Lett 2014;19(4):9485-92.