QUANTIT
ATIVE ELECTROENCEPHALOGRAPHY
(qEEG) TO DISCRIMINATE PRIMARY
DEGENERATIVE DEMENTIA FROM MAJOR
DEPRESSIVE DISORDER (DEPRESSION)
Andréa Deslandes
1, Heloisa Veiga
1, Mauricio Cagy
2,
Adriana Fiszman
3, Roberto Piedade
4, Pedro Ribeiro
5ABSTRACT - Electroencephalography (EEG) can be a valuable technique to assess electrophysiological changes related to dementia. In patients suspected of having dementia, the EEG is often quite informative. The sensitivity of the EEG to detect correlates of psychiatric disorders has been enhanced by means of quantitative methods of analysis (quantitative EEG). Quantitative features are extracted from, at least, 2 minutes of artifact-free, eyes closed, resting EEG, log-transformed to obtain Gaussianity, age-regressed, and Z-transformed relative to population norms (Neurometrics database). Using a subset of quantitative EEG (qEEG) features, forward stepwise discriminant analyses are used to construct classifier functions. Along this vein, the main objective of this experiment is to distinguish profiles of qEEG, which differentiate depressive from demented patients (n = 125). The results showed that demented patients present devia-tions above the control group in variables associated to slow rhythms: Normed Monopolar Relative Power Theta for Cz and Normed Bipolar Relative Power Theta for Head. On the other hand, the deviation below the control group occurs with the variable associated to alpha rhythm: Normed Monopolar Relative Power Alpha for P3, in dementia. Using this method, the present investigation demonstrated high discriminant accuracy in separating Primary Degenerative Dementia from Major Depressive Disorder (Depression).
KEY WORDS: qEEG, neurometrics, Alzheimer´s disease, depression.
Eletroencefalografia quantitativa (EEGq) na discriminação entre demência degenerativa primária e transtorno depressivo maior (depressão)
RESUMO - A Eletroencefalografia (EEG) pode ser utilizada como uma técnica valiosa na avaliação de mudanças eletrofisiológicas relacionadas à demência. Em pacientes com suspeita de demência, o EEG é em geral bastante informativo. A sensibilidade do EEG em detectar correlatos de desordens psiquiátricas pode ser incrementada através de métodos de análise quantitativa (EEG quantitativo). Padrões quantitativos são extraídos de pelo menos 2 minutos de dados livres de artefatos, em que os sujeitos estão com olhos fecha-dos e em estado de repouso. São aplicafecha-dos métofecha-dos quantitativos, tais como: transformação logarítmica para obtenção de uma distribuição Gaussiana, regressão por faixa etária e o escore Z relativo a normas populacionais preestabelecidas (Neurometrics). Utilizando uma amostra de padrões de EEG quantitativo (EEGq), será implementada uma análise discriminante (forward stepwise) a fim de estabelecer funções clas-sificatórias. Neste contexto, o objetivo principal deste estudo é distinguir perfis de EEGq que diferenciem pacientes com depressão de pacientes com demência (n = 125). Os resultados demonstraram que pacientes acometidos por demência apresentam desvios acima do grupo controle em variáveis associadas a ritmos lentos: Potência Monopolar Relativa Normalizada em Teta para Cz e Potência Bipolar Relativa Normalizada em Teta para Cabeça. Por outro lado, desvios abaixo do grupo controle ocorrem em variáveis associadas ao ritmo alfa: Potência Monopolar Relativa Normalizada em Alfa para P3. Através deste método, a presente investigação demonstrou uma alta acurácia em discriminar pacientes com Demência Degenerativa Primária de pacientes com Transtorno Depressivo Maior.
PALAVRAS-CHAVE: EEGq, neurometrics, doença de Alzheimer, depressão.
1Mestranda em Saúde Mental, Instituto de Psiquiatria (IPUB), Setor de Neuroimagem Funcional, Universidade Federal do Rio de
Janeiro Rio de Janeiro RJ, Brasil (UFRJ); 2Doutorando em Engenharia Biomédica, COPPE, (UFRJ); 3Doutoranda em Psiquiatria,
(IPUB), Setor de Neuroimagem Funcional, (UFRJ); 4Professor Adjunto III Doutor, (IPUB), Setor de Neuroimagem Funcional, (UFRJ); 5Professor Adjunto II PhD, Escola de Educação Física e Desportos (IPUB), Setor de Neuroimagem Funcional, (UFRJ); Professor
Pesquisador, Universidade Castelo Branco (PROCIHM).
Received 28 April 2003, received in final form 5 August 2003. Accepted 17 September 2003.
One of the major challenges in clinical psychi-atry is having the ability to differentiate dementia from depression in elderly individuals. This diffi-culty is mainly associated with a constellation of symptoms shared by both pathologies. Several do-mains are influenced in both cases, such as: short-term memory, abstract thinking, ability to make decisions, disturbances of higher cortical function, and mood instability. In special, diagnostic accu-racy becomes worse when depression is combi-ned with cognitive detriment. Patterns of depre-ssion with cognitive impairment potentially dam-age patients’ ability to store and retrieve infor-mation up to a minimal standard. Thus, cortical dementia, as well as pseudodementia (due to de-pression), will yield a significant damage on the patients’ decision-making and information pro-cessing abilities.
Electroencephalography (EEG) is unquestion-ably a precious tool used to assess electrophysio-logical changes associated with dementia1. As po-inted out by Duffy et al.2in patients suspected of having dementia, the EEG is often quite informa-tive. The severity of EEG abnormalities in Alzhei-mer Disease (AD), the most common cortical de-mentia, varies according to the degree of cogni-tive impairment. Lightly abnormal EEG in the ear-ly stages of dementia has been indicative of a pro-gressive degenerative trend3. During the evolu-tion, the findings include mainly an increase in diffuse slow activity and a reduction in alpha and beta activity4-8. Duffy et al.9 and Prichep et al.10 found diffuse increases in power in the low-fre-quency band among demented patients, while Coben et al.11reported a decrease in the total po-wer in beta band in subjects with dementia. Bren-ner et al.12 found similar patterns, with a corre-sponding increased theta-beta ratio between pa-tients with dementia and normal controls. Leu-chter et al.13 examined the data only from de-mented patients with mild cognitive impairment and observed that 63% of these subjects had spectral beta-theta ratio values below the lowest value for the control subjects. The spectral ratio from the left temporal region was much lower among demented subjects. On the other hand, studies of quantitative EEG (qEEG) changes in de-pressed patients are scarce and have yielded con-tradictory findings. Brenner et al.6found decre-ased beta and delta relative power in depressed patients as compared to normal controls. Luth-ringer et al.14also observed the finding of signif-icantly decreased beta activity in depressed
pati-ents, but reported a significant increment in the-ta activity as well. Pozzi et al.15 compared qEEG correlates of AD-depressed patients with those without AD. Non-AD depressed patients showed a significant reduction in delta relative power, as well as a significant reduction in alpha relative power to the right hemisphere. In contrast, de-pressed AD patients, as compared to non-depres-sed AD patients, showed significant increments in delta and theta relative power, as well as a sig-nificant reduction of alpha relative power, which was restricted to posterior brain regions16,17.
In the last three decades, statistical techniques have been used to quantify electrophysiological characteristics associated to a database. Specifi-cally, Neurometrics is the statistical analysis of stan-dardized, neurophysiological measures extracted from the EEG and compared to a normative da-tabase18-24. Significant deviations from normal Neurometric values are detected in high propor-tions of patients with psychiatry illness, including developmental disorders and early stages of de-mentia. Such normative data has helped to diffe-rentiate pathologies related to abnormal brain patterns25,26. Along this line, here we present qEEG results based on quantitative analysis and statisti-cal assessment of brain electristatisti-cal features of two different samples: demented and depressive pati-ents. Essentially, the main goal of this experiment was to differentiate patterns of electro-neurophys-iological measures, which discriminate depressive from demented patients, and to assess the pre-dictive value of the obtained discriminant equa-tion.
METHOD
participants were diagnosed using the Structured Cli-nical Interview for DSM-IV Diagnosis, and severity of depression was assessed by the Hamilton Depression Scale. In both groups, the severity of cognitive impair-ment and of depression varried from mild to moderate (Hamilton = 8-18 ; Mini-Mental = 13-26). Total mean age was 67.9 years (±10.5), respectively, 72.6 years (±9.4) for demented and 61.0 years (±8.0) for depr es-sed patients. Both groups signed a consent form and the experiment was approved by an Ethics committee (Federal University of Rio de Janeiro - UFRJ).
Data acquisition -Patients and controls were seat-ed in a comfortably sound and light attenuatseat-ed room, while 20 minutes or more of eyes-closed alert/resting EEG data were collected from the 19 mono-polar elec-trodes sites. International 10/20 System (referred to linked earlobes) for electrode placement was used with a Braintech-3000 (EMSA-Medical Instruments, Brazil). Eye-movement (EOG) artifact was monitored with a bipolar electrode montage using two 9-mm diameter electrodes attached superior to and on the external canthus of the right eye. Impedances for EEG and EOG electrodes were under 5 KΩand 20 KΩ, respectively. Visual inspection was employed for detection and eli-mination of artifacts. Moreover, Independent Com-ponent Analysis (ICA) was applied to remove possible sources of artifacts. Amplifier band-pass was 0.5-70 Hz (3 dB points), with a 60 Hz notch filter. Data were dig-itized at 200 Hz with a 12-bit resolution.
Data analysis -At least two minutes of artifact-free data were extracted from the EEG’s total record for quantitative analysis. Power-spectral analysis was per-formed with Fast Fourier Transform (FFT). For each of the 19 monopolar derivations, absolute and relative (%) power, mean frequency, inter-hemispheric and in-tra-hemispheric coherence, and symmetry were com-puted for the delta (1.0-3.5 Hz), theta (4.0-7.5 Hz), alpha (8.0-12.0 Hz), and beta (13-25 Hz) frequency bands. Quantitative measures were log-transformed (i.e., X’ = log10X; X’ = log[X/(1.0-X)]) to acquire Gaus-sianity (i.e., to obtain a normal distribution). Physiolo-gical measures very often do not present a normal dis-tribution, which may increase the probability of Type I (false positive) and Type II (false negative) errors. Log-transform alters the distribution of the raw data (i.e., normalizing), without changing the relationship bet-ween the scores. This improves the specificity and sen-sitivity of the quantitative analysis.
The Normative Database from the Brain Research Center (New York University) was used to compare the patients studied with normal controls27. This Database (normal individuals) takes into account an aged regres-sion for the qEEG parameters and estimates an overall mean value and standard deviation throughout the
whole age range of 6 to 90 years. This procedure is adopted to minimize normative data errors and to reduce the variance.
Discriminant analysis functions -Multiple Discrimi -nant Analysis is one of the most used algorithms for describing major differences among groups, or clas-sifying individuals into groups on the basis of a battery of measurements. The main differences among the po-pulations are brought to light through the use of un-correlated linear combinations of the primary varia-bles. Considering that the discriminant functions are uncorrelated, they allow a supplementary partitioning of the between association. Application of the discrim-inant function-variable correlations allows the desig-nation of the discriminant functions, and consequent-ly the standardized index is mandatory to establish which of the variables are unnecessary.
RESULTS
Descriptive statistic analyses were performed to characterize demented versus depressed pati-ents, in relation to age. T-test analysis (Table 1) showed that there was a significant difference between samples (t = 7.2; gl = 123; p < 0.001). Results indicated that demented individuals pre-sented a mean age higher than depressed sub-jects. This fact did not interfere in the overall re-sults, once the EEG data was submitted to an aged regression equation to adjust electroence-phalographic parameters. Both groups presented homogeneity of variance (F ratio var = 1.4, p var = 0.2).
Initially, 11 qEEG variables, as listed in Table 2, were submitted to a forward stepwise discrimi-nant analysis (SPSS-10) to determine those that best predicted to which subgroup each patient should be allocated (Dementia / Depression). The variables that did not achieve statistical signifi-cance level (p > 0.05) to enter the discriminant equation were: NMRPA01 (0.74), NMRPBA (0.55), NBACC (0.09), NBACC (0.91), NBACA (0.15), and
Table 1. Descriptive statistic analyses and T-test analysis per-formed to characterize demented versus depressed patients related to age.
Diagnosis N Mean Minimum Maximum Std
Age Dev
Dementia 74 72.6 52.2 90.3 ± 9.4
Depression 51 61.0 49.6 82.3 ± 8.0
Total 125 67.9 49.6 90.3 ± 10.5
NBCDPO (0.22). The 5 qEEG variables selected by
stepwise forward discriminant analysis are shown in bold (Table 2). These variables allow an effec-tive discrimination between dementia and de-pression. Lambda value = 0.38 (p ≤ 0.0001) is significant. Lambda values may vary from 0 (per-fect discrimination) to 1 (absence of discrimina-tion). On the other hand, tolerance values (vari-ance ratio due to a particular variable) differ
Table 2. Quantitative variables submitted to a forwad stepwise discriminant analysis to find out those that best predicted to which subgroup each patient shoud be allocated (demen-tia/depression). Variables in bold were selected and entered the model.
qEEG Variables
1. Normed Monopolar Relative Power Theta for Cz
2. Normed Monopolar Relative Power Alpha for P3
3. Normed Monopolar Relative Power Alpha for O1 4. Normed Monopolar Relative Power Beta for Anterior
5 Normed Bipolar Relative Power Theta for Head
6. Normed Bipolar Relative Power Total for T3-F7
7. Normed Bipolar Asymmetry Combined for Central 8. Normed Bipolar Asymmetry Combined for Anterior
9. Normed Bipolar Coherence Delta for Fronto-Temporal
10.Normed Bipolar Coherence Delta for Parieto-Occipital
11.Normed Bipolar Coherence Combined for Anterior
qEEG variables proposed initially to forward stepwise discriminant analysis.
from 0 (zero), indicating that there is no signifi-cant redundancy in the discrimination power of the 5 selected variables.
All of the 11 qEEG variables that entered the
forward stepwise discriminant function analysis
presented normal distribution, as well as homo-geneity of variance. Normal Distribution and Ho-mogeneity of Variance are basic pre-requisites that must not be violated when applying para-metric statistical methods, such as in the case of
forward stepwise discriminant function analysis. The 5 qEEG variables that entered the final discri-minant equation were: NMRPTCZ, NBCDFT, NMR-PAP3, NBRPTH, and NBRPTT3-F7. It must be stres-sed that the variable/patient ratio was always bigger than 1/10, in fact it was 1/25. A proportion ≥ 1/10 is necessary for a reliable predictive value of the discriminant function. This pre-requisite was fully respected in this experiment.
For a reliable predictive value of a discrimi-nant equation, it is assumed that the variance / covariance matrices of variables are homogenous across subgroups. Results indicate that the Null Hypothesis of equal variance / covariance matri-ces should not be rejected (p = 0.08 > 0.05). It is necessary to mention that the multivariate Box M test for homogeneity of variances / covariances is particularly sensitive to deviations from mul-tivariate normality, and should not be taken into account once the assumption is violated.
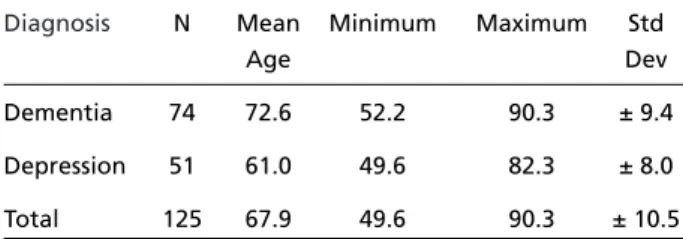
Figure 1 shows the standard deviation means for Dementia/Depression from the control group for the 5 qEEG variables analyzed. The deviations
Fig 1. Standard deviation means for Dementia/Depression from the control group for the 5 qEEG variables analyzed. The deviations above the control group occur with variables associated to slow rhythms.
nosis based on stepwise forward discriminant function analysis.
The Classification is based on Mahalanobis’ distances. For each subgroup, it is possible to de-termine the location, in a multivariate space, of points that represent the means for all the 5 qEEG variables studied. These points are named
Centroids, and for each patient the Mahalanobis’ distances are computed from the centroid of each subgroup (Dementia / Depression). A particular case (patient) will belong to the nearest sub-group, that is, where the Mahalanobis’ distance is the smallest.
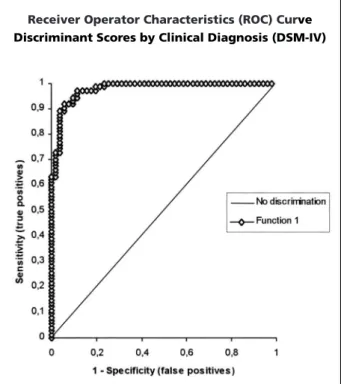
A Receiver Operator Characteristic (ROC) Cur-ve was constructed, using the discriminant scores obtained for each patient (Depression / Demen-tia), aiming to assess the discrimination power of the qEEG variables. The results for ROC are plot-ted in Figure 3. As specified in this figure, the area under the curve (0.979) indicates a quite good performance of the combination (discrimi-nant scores) for the 5 qEEG variables in differen-tiating dementia from depression. At the cut-off point (0.38) suggested by the forward stepwise discriminant function analysis, the sensitivity and specificity for the diagnostic of dementia are 91.9% and 92.2%, respectively. The positive pre-dictive value and negative prepre-dictive value for dementia are 94.4% and 88.7%, and the global efficiency is 92.0%. Cross-Validation was assessed by the jackknifing method, where each case is classified by the function derived from all cases above the control group occur with variables
asso-ciated to slow rhythms: Normed Monopolar Rela-tive Power Theta for Cz (NMRPTCz) and Normed Bipolar Relative Power Theta for Head (NBRPTH), in demented patients. Otherwise, the deviation below the control group occurs with the variable associated to alpha rhythm: Normed Monopolar Relative Power Alpha for P3 (NMRPAP3), in de-mentia.
The Classification Matrix in Table 3 presents information about the agreement ratio of cor-rectly classified cases derived from the discrimi-nant function obtained with the 5 qEEG variables in comparison to the Clinical Diagnosis (DSM-IV) for each subgroup (Dementia/Depression) (Fig 2). As pointed out in Table 3, there is a significant agreement degree (91.9% for dementia, 90.2% for depression, and a total of 91.2%) between the clinical diagnosis (DSM-IV) and the qEEG
diag-Table 3. Agreement ratio of correctly classified cases derived from the discriminant function obtained with the 5 qEEG variables in comparison to the Clinical Diagnosis (DSM-IV) for each subgroup (Dementia/Depression).
Group Percent Dementia Depression Total correct (59%) (41%)
Dementia 91.9 68 6 74
Depression 90.2 5 46 51
Total 91.2 73 52 125
Classification matrix construction: discrimination function sample data.
other than the case itself. The concordance rate between the clinical diagnosis and the 5 qEEG variables diagnosis is still high (91.9% for demen-tia, 88.2% for depression, and a total of 90.4%), indicating that the predictive value of the discri-minant equation derived from this study is quite favorable.
DISCUSSION
This study aimed to identify profiles of qEEG, which may help to differentiate depressive from demented patients. The present experiment con-tributes to the development of a quantitative tool to uncover psychiatric features related to demen-tia and depression. Such features are embedded in the shared parameters of both psychiatric dis-orders. Our results are in agreement with other research groups that use Neurometrics10,19,22,28. The ratio of concordance between the clinical di-agnosis (DSM-IV) and the qEEG didi-agnosis based on stepwise forward discriminant function analy-sisis quite significant (91.9% for dementia, 90.2% for depression, and a total of 91.2%), even for replication (91.9% for dementia, 88.2% for de-pression, and a total of 90.4%), indicating that the predictive value of the discriminant equation derived from this study is favorable.
More specifically, variables associated to slow rhythms present deviations above the control group in demented patients; Normed Monopolar Relative Power Theta for Cz (NMRPTCz) and Nor-med Bipolar Relative Power Theta for Head (NBRPTH) are increased, when compared to the Neurometrics Normative Database. Otherwise, the deviation below the control group occurred with the variable associated to alpha rhythm, Normed Monopolar Relative Power Alpha for P3 (NMRPAP3). These results are also in concordance with the literature concerned with spectral ana-lyzed EEG in dementia, which consistently shows an increase in absolute and relative slow frequen-cy power, as well as a reduction of the power in higher frequencies and the alpha activity9-13. It must be pointed out that there is no conclusive evidence that the drugs that were administred in this study, which are part of the new generation of anti-depressants (Selective Serotonin/Noradre-naline Reuptake Inhibitors - SSRIs and SNaRIs), pro-duce significant alterations in the EEG pattern.
The present results support the hypothesis that qEEG can be used to supplement traditional clin-ical evaluation in discriminating demented from depressive patients. Although the sample size must be increased, the present findings suggest that the development of a reference database helps to map specific features (Neurometric pro-files) for each psychiatric disorder (i.e., dementia ×depression, as in the present situation). Besides, the increment on the number of subjects aids the development of better discriminant equations.
REFERENCES
1. Berger H. Electroencephalogram of man. Arch Psychiat Nervenkr 1937;106:577-584.
2. Duffy FH, Iyer VG, Surwillo WW. EEG in clinical diagnosis and its relationship to other neurological tests in clinical electroencephalog-raphy and topographic Brain Mapping. Springer-Verlag, 1989;242-252.
3. Brenner RP. EEG and dementia. In Niedermeyer E, Lopes da Silva F. Electroencephalography: basic principles, clinical applications and related fields. Baltimore: Williams & Wilkins, 1993;339-349. 4. Harner RN. EEG evaluation of the patient with dementia. In Benson
FD, Blummer D. Psychiatric aspects of neurological diseases. New York: Grune $ Stratton, 1975;63-82.
5. Pollock VE, Schneider LS. Quantitative, waking EEG research on depression. Biol Psychiatry 1990;27:757-780.
6. Brenner RP, Ulrich RF, Spiker DG. Computerized EEG spectral analy-sis in elderly normal, demented and depressed subjects. Electroen-cephalogr Clin Neurophysiol 1986;64:483-492.
7. Lopes da Silva F. EEG analysis: theory and practice. In Niedermeyer E, Lopes da Silva F. Electroencephalography: basic principles, clinical applications and related fields. Baltimore: Williams & Wilkins, 1993;1097-1123.
8. Piedade RAM. Análise quantitativa da atividade elétrica cerebral. In Bueno JR, Nardi AE. Diagnóstico e tratamento em psiquiatria. Rio de Janeiro: Medsi, 1999;111-125.
Fig 3. The area under the curve (0.979) indicates a quite good perfomance of the combination (discriminant scores) for the 5 qEEG variables in differentiating dementia from depression.
9. Duffy FH, Albert MS, McAnulty G. Brain electrical activity in patients with presenile and senile dementia of the Alzheimer type. Ann Neurol 1984;16:439-448.
10. Prichep L, Mont FG, John ER, Ferris SH. Neurometric electroencepha-lographic characteristics of dementia. In Reisberg B. Alzheimer’s dis-ease: the standard reference. New York: MacMillan 1983;339-348. 11. Coben LA, Danziger WL, Berg L. Frequency analysis of the resting
awake EEG in mild senile dementia of the Alzheimer type. Electro-encephalogr Clin Neurophysiol 1983;55:372-380.
12. Brenner RP, Reynolds CF, Ulrich RF. Diagnostic efficacy of computerized spectral versus visual EEG analysis in elderly normal, demented and de-pressed subjects. Electroencephalogr Clin Neurophysiol 1988;69:110-117. 13. Leuchter AF, Spar JE, Walter DO, Weiner H. Electroencephalographic spectra and coherence in the diagnosis of Alzheimer’s-type and multi-infarct dementia: a pilot study. Arch Gen Psychiatry 1987;44:993-998. 14. Luthringer R, Minot R, Toussaint M, Dago KT, Soufflet L, Macher JP.
Neurophysiological characterization of depressed patients suffering from a major depressive episode using 3D EEG and EPs mapping techniques. Biol Psychiatry 1992;31:73A.
15. Pozzi D, Golimstock A, Petracchi M, Garcia H, Starkstein. Quantified electroencephalographic changes in depressed patients with and without dementia. Biol Psychiatry 1995;38:677-683.
16. Kwa VIH, Weinstein HC, Meyjes EFP, et al. Spectral analysis of the EEG and 99-Tc-HMPAO Spect-scan in Alzheimer’s disease. Biol Psychiatry 1993;33:100-107.
17. John ER, Prichep LS, Fridman J, Easton P. Neurometrics: computer-assis-ted differential diagnosis of brain dysfunctions. Science 1988; 239:162-169. 18. John ER, Prichep LS. Principles of neurometric analysis of EEG and evoked potentials. In Niedermeyer E, Lopes da Silva F. Electroen-cephalography: basic principles, clinical applications and related fields. Baltimore: Williams & Wilkins, 1993;989-1003.
19. Prichep LS. Neurometric quantitative EEG measures of depressive disorders. In Takahasi R, Flor-Henry P, Gruzelier J, Niwa S. Cerebral dynamics, laterality, and psychopathology. Amsterdam: Elsevier, 1987;55-69.
20. Thacher R, Walker R, Gerson I, Geisler F. EEG discriminant analysis of mild head trauma. Electroencephalogr Clin Neurophysiol 1989; 73:94-106.
21. Mas F, Prichep L, John ER, Levine R. Neurometric QEEG subtyping of obsessive-compulsive disorder. In Maurer K. Imaging of the brain in psychiatry and related fields. Berlin: Springer Verlag, 1991;277-280. 22. Prichep LS, John ER. QEEG profiles of psychiatry disorders. Brain
Topography 1992;4:249-257.
23. Prichep LS, Mas F, Hollander E, et al. Quantitative electroencephalo-graphic subtyping of obsessive-compulsive disorder. Psychiatric Research: Neuroimaging 1993;50:25-32.
24. Piedade RAM, Fiszman A. Diagnóstico diferencial entre demência e depressão utilizando a eletroencefalografia quantitativa (EEGq). J Bras Psiq 1999;48:385-391.
25. Piedade RAM, Fiszman A. Diagnóstico diferencial entre esquizofrenia e depressão maior utilizando a eletroencefalografia quantitativa (EEGq). Psiquiatr Biol 2000;8:109-117.
26. Breslau J, Starr A, Sicotte N, Higa J, Buchsbaum MS. Topographic EEG changes with normal aging and SDAT. Electroencephalogr Clin Neurophysiol 1989;71:281-289.
27. John E, Prichep L, Easton P. Normative data banks and neurometrics: basic concepts, methods and results of norms constructions. In Re-mond A (ed). Handbook of Electroencephalography and Clinical Neurophysiology, vol. III, Amsterdam: Elsevier, 1987;449-495. 28. Schreiter-Gasser U, Gasser T, Ziegler P. Quantitative EEG analysis in