1Full Professor in Neurology of the Faculty of Medicine of the Pontifícia Universidade Católica de Campinas, Brazil (PUC-Campinas); 2Scholarship holder CNPq/PIBIC; 3Professor in Psychology of the PUC-Campinas.
Received 7 December 2005. Accepted 10 March 2006.
Dr. Lineu C. Fonseca - Rua Sebastião de Souza 205 / 122 - 13013-173 Campinas SP - Brasil. E-mail: lineu.fonseca@uol.com.br
QUANTITATIVE EEG IN CHILDREN
WITH LEARNING DISABILITIES
Analysis of band power
Lineu C. Fonseca
1, Glória M.A.S. Tedrus
1, Marcelo G. Chiodi
2,
Jaciara Näf Cerqueira
2, Josiane M.F. Tonelotto
3ABSTRACT - In order to better understand the mechanisms of learning disabilities it is important to eval-uate the electroencephalogram parameters and their relation to the results of the Wechsler Intelligence Scale. Thirty-six children with complaints of learning disability were studied. Electroencephalograms were c a rried out while awake and resting, and the values for absolute and relative powers calculated. The re s u l t s w e re compared with those of 36 healthy children paired with respect to age, gender and maternal scholas-tic level. In the group with learning disabilities, the absolute (in the delta, theta and alpha 1 bands) and relative (theta) power values were higher and the relative power alpha 2 value significantly lower at the majority of the electrodes in relation to the control group. There was a high positive correlation in the c h i l d ren with learning disabilities between the relative power alpha 2 and the verbal, perf o rmance and total IQ values. These quantitative electroencephalogram findings in children with learning disabilities have a clear relation with psychological measurements and could be due to brain immaturity.
KEY WORDS: quantitative EEG, EEG maturation, frequency analysis, cognition, intelligence quotient.
E l e t rencefalograma quantitativo em crianças com dificuldades de aprendizagem: análise de fre-qüências
RESUMO - Para compreender melhor os mecanismos das dificuldades de aprendizagem é importante avaliar a relação entre parâmetros do eletrencefalograma e resultados da Escala Weschler de Inteligência. Foram estudadas 36 crianças com queixas de dificuldades de aprendizagem. Foi realizado o eletrencefalograma durante vigília, em repouso e calculados os valores de potência absoluta e relativa. Os resultados foram comparados aos de 36 crianças sadias pareadas quanto a idade, gênero e escolaridade materna. As potên-cias absoluta (das faixas delta, teta e alfa 1) e relativa (teta) foram maiores e a potência relativa alfa 2 foi significativamente menor, na maioria dos eletrodos, no grupo com dificuldade de aprendizagem em re l a ç ã o ao grupo controle. Nas crianças com dificuldade de aprendizagem houve correlação elevada e positiva e n t re a potência relativa alfa 2 e o QI. Os achados do eletrencefalograma quantitativo das crianças com dificuldade aprendizagem têm nítida relação com medidas psicológicas e podem ser decorrentes de ima-turidade cerebral.
PALAVRAS-CHAVE: aprendizagem, cognição, EEG, EEG quantitativo, inteligência.
Quantitative electroencephalogram (qEEG) stud-ies in children with learning disabilitstud-ies have shown alterations, such as an increase in the absolute
pow-er in the delta and theta bands1 - 3, reduction in alpha
a c t i v i t y4and reduction in alpha and beta activity, and
also poor spatial differentiation5. The differences in
qEEG results between the various studies must have been due, in greater part, to the diff e rent characteris-tics of the casuistry studied. Children with severe re a
d-ing/writing disabilities had more delta activity in f rontal-temporal regions and those with less intense disabilities had more theta activity (absolute and re
l-ative) and less relative alpha activity4. In the
follow-up of these children the abnormalities tended to de-c rease, suggesting the importande-ce of maturity fade-c- fac-tors6.
accen-tuated than in those without such deficiency, al-though these children also showed more slow
activ-ity than normal childre n7. With respect to dyslexia,
the initial expectation that qEEG variables could dis-criminate healthy individuals from those with
dyslex-i a8, failed to be confirmed by other authors9. Childre n
with attention deficit/hyperactivity disorder (ADHD) show a greater contingent of slow activity and less beta10-13, although the clinical use of qEEG in ADHD
has still to be confirm e d1 4. Recently there has been
renewed interest in studying the relationship bet-ween qEEG variables and IQ measurements. Elevated c o rrelation was observed in children between aspects of qEEG and coefficients of the intelligence test
( W I S C )1 5 , 1 6. A study of the relationship between qEEG
variables and IQ could provide greater knowledge about the biological aspects related to learning dis-abilities. It is possible that diversified perf o rmance in the tests could have different neuronal activity sub-strates and could consequently be associated to dif-ferent qEEG aspects.
The proposal of this study was to analyse brain electrical activity frequency in children with learn i n g disabilities but without evident neurological risk fac-tors, and to evaluate the relationship of qEEG to the IQ measurements (WISC-III).
METHOD
C a s u i s t ry – T h i rty-six schoolchildren, aged between 8 and 11, with complaints of learning disabilities (group LD), f rom the outpatients clinic for learning disabilities of the Speech Therapy Clinic of PUC-Campinas were studied, who attended the following inclusion criteria:
1. absence of a history of neurological or psychiatric p roblems (personal antecedents or close relatives suff e r-ing from epileptic fits, cranial-encephalic traumatism with loss of consciousness, encephalitis, reduced mental capac-ity, amongst others);
2. normal neural-psychomotor development; 3. normal neurological examination; 4. normal hearing;
5. normal or corrected sight;
6. absence of cognitive deficit (total IQ above 70 on the WISC-III).
Procedures
1. Anamnesis about data re f e rring to the pre g n a n c y, b i rth, neonatal period, neural-psychomotor development, sleep, feeding, sociability, toys, school life, social-econom-ic level, personal and family pathologsocial-econom-ical antecedents. Q u e s t i o n n a i re for the teachers with questions about stu-dent behaviour and performance.
2. Raven test for pro g ressively coloured matrixes – i n s t rument standardised and adapted to Brazilian re a l i t y, designed to measure general intelligence.
3. Digital electroencephalogram – register of electrical brain activity. Exam carried out to provide an analysis of the brain electrical activity. The EEG was obtained for 200 samples per second with a resolution of 12 bits and 0.5 and 35 Hz filters, using the Braintech 3.0 equipment (EMSA Equipamentos Médicos). Impedance was maintained below 10kΩ. The exam was carried out with the child in the dor-sal decumbent position, in an ambient of silence with re d u-ced luminosity. The electrodes were plau-ced according to the 10-20 international system, with the use of an additio-nal two electrodes placed 1 cm below (left side) and above (right side) the external angle of the eyelid cleft, with the objective of evaluating eye movements. The inter- c o n n e c t-ed auricular electrodes servt-ed as the re f e rence. Registration was done during three peri ods, alternating t wo minutes resting with the eyes closed with two minutes with the eyes open. Hyperventilation was carried out for three minutes.
4. Quantitative EEG – mathematical data processing of the brain electrical activity so as to highlight certain com-ponents in a quantitative mode. For the qEEG, 18 to 26 epochs were selected while awake and resting (eyes closed), each of 2.56s. After applying the quick Fourier transform, the absolute and relative powers were studied in the fol-lowing frequency bands: delta (up to 3.9 Hz), theta (4.29 to 7.8 Hz), alpha (8.2 to 12.5 Hz), alpha 1 (8.2 to 9.8 Hz), alpha 2 (10.15 Hz to 12.5 Hz) and beta (abov e 12.89 Hz). To obtain the normal distribution, the values for absolute power (X) were substituted by their logarithms, Y=log (X), and the relative power values (R) transformed by Logit, Y=log(R/1-R)17.
5. School perf o rmance test (SPT) – This is a psychomet-ric instrument, favourably considered by the Psychological Tests Evaluation System (Brazilian Federal Council Of Psy-chology), which offers an evaluation of the fundamental capacities for school performance in writing, reading and arithmetic, in an objective form. The test was conceived to evaluate schoolchildren in the 1s tto 6t hgrades of
school-ing, and standardised within the reality of the Brazilian school system18. In a very broad manner, the SPT indicates
which school learning areas have been pre s e rved or pre j u d i-ced in the examinee.
6. Wechsler Intelligence Scale for Children – WISC III – This is a clinical instrument, applied individually, to evalu-ate the intellectual capacity of children between 6 and 16 1/2 years of age. It is composed of various subtests, each measuring a diff e rent aspect of intelligence and is used to verify the cognitive perf o rmance of the subjects in quali-tative and quantiquali-tative terms. This scale proposes pro b l e m s that permit an appreciation of the capacity of the subjects with respect to memory, attention, action planning, spa-tial orientation and other aspects connected to mental func-tioning. It is composed of two types of evaluation: that of cognitive perf o rmance as related to the verbal aspect, and that of cognitive perf o rmance as related to the non-verbal aspect, that is, to perf o rmance or carrying out of an action.
7. Traditional neurological examination.
gender and scholastic level of their parents. These childre n had no history of neurological (for example personal ante-cedents or close relatives suffering from epileptic seizure s , cranial-encephalic traumatism with loss of consciousness, encephalitis, reduced mental capacity) or psychiatric pro b-lems, showed normal neural-psychomotor devel opment, n o rmal neurological and electroencephalographic examina-tions, an absence of cognitive deficit in the Raven pro g re s-sive matrixes test, had never repeated a school year and p resenting perf o rmance compatible with their age and school grade in the SPT.
A comparison was made between the study group and the control group with respect to the absolute and relati-ve powers in the delta, theta, alpha and beta bands of the qEEG (t-test for paired samples).
C o rrelation between aspects of WISC (verbal IQ, per-f o rmance IQ and tot al IQ) and the qEEG parameters was also studied, using Pearson’s correlation analysis.
The level of significance was 0.05, but since evaluations w e re carried out relative to 15 electrodes, and taking into
account the possibility of alpha error inflation, the level of 0.0033 (0.05/15=0.0033) was also considered by the Bonfer-roni correction.
The project was approved by the Ethics in Researc h Committee of FCM-PUC-Campinas, organ recognised by the Brazilian National Commission on Ethics in Researc h (CONEP/MS).
RESULTS
Table 1 shows the distribution of the individuals with complaints of learning disability according to age and gender. All the children showed inferior per-formances in the total SPT or its subtests.
Table 2 shows the values for the absolute delta, theta and alpha 1 powers for the group of children with learning disabilities (LD) and the control gro u p (CG), and the value for p in the respective compar-isons (t test for paired samples).
Table 1. Distribution of the 36 children according to age and gender.
Age (years) Masculine Feminine Total
Nº % Nº % Nº %
8 4 11.1 1 2.8 5 13.1
9 11 30.5 2 5.5 13 34.2
10 6 16.7 3 8.3 9 28.9
11 5 13.9 4 11.1 9 23,7
Total 26 72.2 10 27.7 36 100
Table 2. Values for the absolute delta, theta and alpha 1 powers for the groups of children with learning disability (LD) and the control group (CG) and the value for p in the respective comparisons.
Electrode Absolute Delta Absolute Theta Absolute Alpha 1
LD CG p LD CG p LD CG p
T3 125.02 105.19 0.001** 114.60 89.55 0.000** 59.97 46.71 0.002** T5 157.70 139.40 0.003** 167.23 134.41 0.001** 111.21 97.63 0.127 F3 179.79 151.09 0.000** 174.40 129.37 0.000** 81.76 65.28 0.006* C3 178.42 153.19 0.000** 186.12 141.52 0.000** 106.14 82.48 0.007* P3 194.92 171.42 0.003** 211.53 167.50 0.002** 129.87 114.10 0.079
O1 192.07 179.84 0.209 211.31 190.34 0.177 180.16 190.47 0.222
T4 126.43 103.54 0.000** 114.28 89.39 0.000** 61.56 48.28 0.001** T6 169.18 138.47 0.001** 178.19 137.92 0.001** 129.05 104.05 0.033* F4 185.32 150.85 0.000** 173.21 134.20 0.000** 81.85 66.85 0.007* C4 178.16 153.20 0.000** 178.51 142.98 0.001** 107.27 84.10 0.012* P4 192.02 166.43 0.015* 207.63 166.76 0.006* 138.82 111.98 0.017*
O2 187.87 182.47 0.369 205.63 196.34 0.339 189.70 189.85 0.409
Fz 198.61 160.23 0.000** 194.78 148.09 0.000** 90.27 71.11 0.001** Cz 207.85 180.45 0.000** 220.11 171.81 0.000** 111.53 88.99 0.004* Pz 218.92 181.24 0.004* 235.16 186.67 0.006* 145.75 119.60 0.023*
O b s e rve that the absolute delta, theta and alpha 1 powers were statistically greater for the majority of the electrodes for the LD group, and that the dif-f e rences were highly signidif-ficant (p<0.0033) in the delta and theta bands.
Table 3 shows the values for the relative theta
and alpha 2 powers for the LD and CG groups as well
as the values for p in the comparisons.
For various electrodes, in a statistically significant w a y, there was greater relative theta power and less-er relative alpha 2 powless-er for the LD group.
No statistically significant diff e rences were found Table 3. Values for the relative theta and alpha 2 for the groups of children with
l e a rning disability (LD) and the control group (CG) and the value for p in the re s p e c -tive comparisons.
Electrode Relative Theta Relative Alpha 2
LD CG p LD CG p
T3 0.25 0.23 0.123 0.06 0.07 0.006*
T5 0.28 0.24 0.027* 0.07 0.10 0.043*
F3 0.31 0.26 0.000** 0.04 0.06 0.006*
C3 0.30 0.27 0.026* 0.07 0.08 0.031*
P3 0.31 0.26 0.025* 0.07 0.09 0.036*
O1 0.26 0.22 0.004* 0.08 0.12 0.106
T4 0.25 0.22 0.026* 0.06 0.07 0.046*
T6 0.27 0.24 0.057 0.08 0.10 0.046*
F4 0.30 0.27 0.034* 0.04 0.06 0.006*
C4 0.28 0.27 0.190 0.07 0.08 0.071
P4 0.29 0.27 0.296 0.07 0.08 0.079
O2 0.24 0.22 0.065 0.08 0.01 0.082
Fz 0.31 0.29 0.079 0.04 0.06 0.008*
Cz 0.34 0.30 0.018* 0.04 0.06 0.011*
Pz 0.31 0.29 0.168 0.05 0.07 0.019*
*p< 0.05; **p<0.0033
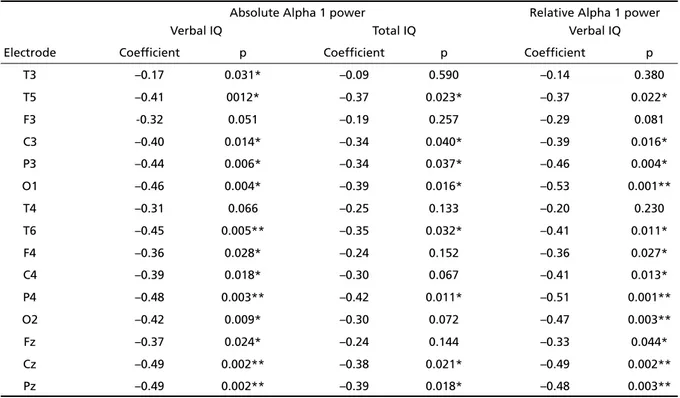
Table 4. Pearson’s correlation coefficients between the absolute and relative alpha 1 powers and the IQ of WISC-III, and the respective p values.
Absolute Alpha 1 power Relative Alpha 1 power
Verbal IQ Total IQ Verbal IQ
Electrode Coefficient p Coefficient p Coefficient p
T3 –0.17 0.031* –0.09 0.590 –0.14 0.380
T5 –0.41 0012* –0.37 0.023* –0.37 0.022*
F3 -0.32 0.051 –0.19 0.257 –0.29 0.081
C3 –0.40 0.014* –0.34 0.040* –0.39 0.016*
P3 –0.44 0.006* –0.34 0.037* –0.46 0.004*
O1 –0.46 0.004* –0.39 0.016* –0.53 0.001**
T4 –0.31 0.066 –0.25 0.133 –0.20 0.230
T6 –0.45 0.005** –0.35 0.032* –0.41 0.011*
F4 –0.36 0.028* –0.24 0.152 –0.36 0.027*
C4 –0.39 0.018* –0.30 0.067 –0.41 0.013*
P4 –0.48 0.003** –0.42 0.011* –0.51 0.001**
O2 –0.42 0.009* –0.30 0.072 –0.47 0.003**
Fz –0.37 0.024* –0.24 0.144 –0.33 0.044*
Cz –0.49 0.002** –0.38 0.021* –0.49 0.002**
Pz –0.49 0.002** –0.39 0.018* –0.48 0.003**
between the LD and CG groups for the absolute total alpha and beta powers or for the relative delta, theta and beta powers.
Tables 4 and 5 show the values for Pearson’s
cor-relation coefficient and for p with respect to the re l
a-tionship between the qEEG variables and the WISC III quotients.
T h e re was negative correlation between the ver-bal IQ and the absolute and relative alpha 1 powers, w h e reas for the total IQ this negative corre l a t i o n only occurred for the absolute power (Table 4).
As can be observed in Table 5 a highly positive correlation was found between the relative alpha 2 power and the three WISC quotients (verbal, per-formance and total) for almost all the electrodes.
DISCUSSION
In the present study the children with learn i n g disabilities presented greater absolute delta and theta powers than normal children, similar to that
point-ed out by other authors1,2,4. With respect to the
val-ue of these findings, the present casuistry does not p resent previously re p o rted characteristics such as a g reat association with alterations in the qEEG,
men-tal retardation7or risk factors commonly connected
to brain injury4.
On the other hand, it must be remembered that
in the process of brain maturation up to the adult stage, a pro g ressive decrease in delta, theta and alpha 1 activities occur and also an increase in relative alpha
2 power1 7 , 1 9 , 2 0, permitting the suggestion that the
findings of increased delta, theta and alpha 1 pow-ers in the children with learning disabilities corre-sponded to an immaturity of brain development, in a g reement with the interpretation of Harmony et
a l .6, and well-founded in the evolutive study in which
the qEEG abnormalities tend to disappear.
With respect to the localisation of these alter-ations, it was observed that in both the present study
and that of Harmony et al.6, the occipital re g i o n s
were not involved, possibly because the maturity of the brain electrical activity in these regions occurs
much quicker than the re f e rred to slow activities1 7
and in most cases would already have occurred in both the children with learning disabilities and the healthy ones.
Studies comparing the results of psychological
tests and the qEEG variables are scarc e1 5 , 1 6. In the pre
s-ent study there was a highly positive correlation bet-ween the relative alpha 2 power and the total, pefor-mance and verbal IQ quotients. Such correlation can be explained by the fact that the alpha 2 power is associated with greater maturity of the brain
electri-cal activity, as already shown in healthy childre n1 7 , 2 0.
Table 5. Pearson’s correlation coefficients between the relative alpha 2 power and the verbal, perf o rmance and total IQ quotients from the WISC-III, and the respective p values.
Relative Alpha 2 power
Verbal IQ Performance IQ Total IQ
Electrode Coefficient p Coefficient p Coefficient p
T3 0.35 0.035* 0.43 0.007* 0.43 0.008*
T5 0.35 0.036* 0.41 0.011* 0.42 0.009*
F3 0.48 0.003** 0.52 0.001** 0.57 0.000**
C3 0.33 0.046* 0.46 0.004* 0.43 0.008*
P3 0.35 0.034* 0.52 0.001** 0.47 0.003**
O1 0.27 0.102 0.35 0.036* 0.35 0.035*
T4 0.29 0.085 0.46 0.004* 0.42 0.010*
T6 0.36 0.030* 0.52 0.001** 0.49 0.002**
F4 0.49 0.002** 0.53 0.001** 0.58 0.000**
C4 0.20 0.230 0.49 0.002** 0.38 0.020*
P4 0.32 0.057 0.52 0.001** 0.45 0.005*
O2 0.28 0.097 0.40 0.014* 0.37 0.025*
Fz 0.50 0.002** 0.51 0.001** 0.57 0.000**
Cz 0.48 0.002** 0.54 0.001** 0.57 0.000**
Pz 0.40 0.014** 0.54 0.001** 0.51 0.001**
However the frequency of the alpha 1 fraction is immediately inferior to that of alpha 2 and its neg-ative correlation with the IQ could signify lower brain m a t u r i t y. This processes under normal conditions fro m the alpha 1 to the alpha 2 bands. This finding is very interesting and shows that the analysis of the tradi-tional bands (total alpha) may be insufficient to de-tect diff e rences in brain maturity or correlations with IQ.
The present findings agree with the experience
of Schmid et al.1 5that the frequency in the middle
of the alpha band is highly associated with perf o rm-ance in the WISC-III. The fact that the corre l a t i o n s between the qEEG variables at the various electro d e s and IQ were broad in their extension and sometimes in frequency bands could, in part, be due to the fact
that the tests measured heterogeneous abilities15,16.
Thus it was concluded that qEEG could pro v i d e subsidies concerning biological brain aspects involved in children with learning disabilities, in pointing out, for example, brain immaturity as one of the possible factors in the genesis of such disabilities. Other stud-ies should analyse the value of qEEG in sub-gro u p s of children diagnosed with learning disabilities.
REFERENCES
1. Ahn H, Prichep L, John ER, Baird H, Trepetin M, Kaye H. Develop-mental equations reflect brain dysfunctions. Science 1980;210:1259-1262.
2. John ER, Prichep L, Ahn H, Easton P, Fridman J, Kaye H. Neuro m e t r i c evaluation of cognitive dysfunctions and neurological disordesrs in children. Progr Neurobiol 1983;21:239-290
3. Diaz de Leon AE, Harmony T, Marosi E, Becker J. Effect of diff e re n t factors on EEG spectral parameters. Int J Neurosci 1988;43:123-131.
4. Harmony T, Hinojosa G, Marosi E, et al. Correlation between EEG spec-tral parameters and an educational evaluation. Int J Neurosci 1990;54: 145-155
5. Byring R, Salmi TK, Sainio KO, Örn HP. EEG in children with spelling disabilities. Electroencephalogr Clin Neurophysiol 1991;79:247-255. 6. Harmony T, Marosi E, Becker J, et al. Longitudinal quantitative EEG
study of children with diff e rent performances on a re a d i n g - w r i t i n g test. Electroencephalogr Clin Neurophysiol 1995;95:426-433. 7. Gasser T, Rousson V, Schreiteer Gasser U. EEG power and cohere n c e
in children with educational problems. J Clin Neurophysiol. 2003;20: 273-282
8. D u ffy FH, Denckla MB, Bartels PH, Snadini G, Keissling L. Dyslexia: automated diagnosis by computerized classification of brain electrical activity. Ann Neurol 1980;7:421-428.
9. Yingling CD, Galin D, Fein G, Peltzman D, Davenport L. Neuro m e t r i c s does not detect ‘pure’ dyslexics. Electroencephalogr Clin Neuro p h y s i o l 1986;63:426-430.
10. B resnahan SM, Anderson JW, Barry RJ. A g e - related changes in quan-titative EEG in attention-deficit/hyperactivity disord e r. Biol Psychiatry 1999;46:1690-1697.
11. L a z z a ro I, Gordon E, Li W, et al. Simultaneous EEG and EDA m e a s-u res in adolescent attention deficit hyperactivity disord e r. Int J Psychophysiol 1999;34:123-134.
12. Monastra VJ, Linden M, Lubar JF. The development of a quantitative e l e c t roencephalographic scanning process for attention deficit-hyper-activity disorder: reliability and validity studies. Neuro p s y c h o l o g y 2001;15:136-144.
13. Hermens DF, Kohn MR, Clarke SD, Gordon E, Williams LM. Sex dif-f e rences in adolescent ADHD: dif-findings dif-from concurrent EEG and EDA. Clin Neurophysiol 2005;116:1455-1463.
14. Loo SK, Barkley RA. Clinical utility of EEG in attention deficit hyper-activity disorder. Appl Neuropsychol 2005;12:64-76.
15. Schmid RG, Tirsch WS, Scherb H. Correlation between spectral EEG parameters and intelligence test variables in school-age children. Clin Neurophysiol 2002;113:1647-1656.
16. M a rosi E, Rodriguez H, Harmony T, et al. Broad band spectral EEG parameters correlated with diff e rent IQ measurements. Int J Neuro s c i 1999;97:17-27.
17. Gasser T, Verleger R, Bächer P, Sroka L. Development of the EEG of school-age children and adolescents: I. Analysis of band power. Electroencephalogr Clin Neurophysiol 1988;69: 91-99.
18. Stein LM. Teste de desempenho escolar: manual para aplicação e Interpretação. São Paulo: Casa do Psicólogo Livraria e Editora, 1994. 19. Matousek M, Petersen I. Frequency analysis of the EEG in normal