Neck circumference as a new anthropometric indicator for prediction
of insulin resistance and components of metabolic syndrome in
adolescents: Brazilian Metabolic Syndrome Study
Circunferência do pescoço como um novo indicador antropométrico para predição de resistência à insu-lina e componentes da síndrome metabólica em adolescentes: Brazilian Metabolic Syndrome Study
Circunferencia del cuello como un nuevo indicador antropométrico para predicción de resistencia a la insulina y componentes del síndrome metabólico en adolescentes: Brazilian Metabolic Syndrome Study – BRAMS
Cleliani de Cassia da Silva1, Mariana Porto Zambon1, Ana Carolina J. Vasques1, Ana Maria de B. Rodrigues1, Daniella Fernandes Camilo1,
Maria Ângela R. de G. M. Antonio1, Roberta Soares L. Cassani1, Bruno Geloneze1
Instituição: Universidade Estadual de Campinas (Unicamp) e Laboratório de Investigação em Metabolismo e Diabetes (Limed) – Gatrocentro-Unicamp, Campinas, SP, Brasil
1Faculdade de Ciências Médicas da Unicamp; Laboratório de Investigação em
Metabolismo e Diabetes (Limed) – Gatrocentro-Unicamp, Campinas, SP, Brasil ABSTRACT
Objective: To evaluate the correlation between neck circumference and insulin resistance and components of metabolic syndrome in adolescents with different adiposity levels and pubertal stages, as well as to determine the use-fulness of neck circumference to predict insulin resistance in adolescents.
Methods: Cross-sectional study with 388 adolescents of both genders from ten to 19 years old. The adolescents underwent anthropometric and body composition assess-ment, including neck and waist circumferences, and bio-chemical evaluation. The pubertal stage was obtained by self-assessment, and the blood pressure, by auscultation. Insulin resistance was evaluated by the Homeostasis Model Assessment-Insulin Resistance. The correlation between two variables was evaluated by partial correlation coeffi-cient adjusted for the percentage of body fat and pubertal stage. The performance of neck circumference to identify insulin resistance was tested by Receiver Operating Char-acteristic Curve.
Results: After the adjustment for percentage body fat and pubertal stage, neck circumference correlated with waist
circumference, blood pressure, triglycerides and markers of insulin resistance in both genders.
Conclusions: The results showed that the neck circum-ference is a useful tool for the detection of insulin resistance and changes in the indicators of metabolic syndrome in adolescents. The easiness of application and low cost of this measure may allow its use in Public Health services.
Key-words: insulin resistance; metabolic syndrome x; adolescent; adiposity.
RESUMO
Objetivo: Avaliar a correlação da circunferência do pes-coço com resistência à insulina e com os componentes da síndrome metabólica em adolescentes com diferentes níveis de adiposidade e estadios puberais, bem como determinar a utilidade da circunferência do pescoço como um parâmetro na predição de resistência à insulina em adolescentes.
Métodos: Estudo transversal no qual se avaliaram 388 ado-lescentes de ambos os sexos, de dez a 19 anos. Os adoado-lescentes foram submetidos à avaliação antropométrica e de composição corporal, incluindo circunferências do pescoço e da cintura, e
Endereço para correspondência: Cleliani de Cassia da Silva
Rua Carlos Chagas, 420 – Cidade Universitária CEP 13083-878 – Campinas/SP
E-mail: [email protected]
Fonte financiadora: Conselho Nacional de Desenvolvimento Científico e Tecnológico (CNPq), processo nº 563664/2010-0, e Coordenação de Aperfeiçoamento de Pessoal de Nível Superior (Capes)
Conflito de interesse: nada a declarar Recebido em: 24/7/2013
a avaliação bioquímica. O estadio puberal foi obtido por meio de autoavaliação e a pressão arterial, pelo método auscultató-rio. Analisou-se a resistência à insulina pelo Homeostasis Model Assessment-Insulin Resistance. A correlação entre duas variáveis foi verificada com o coeficiente de correlação parcial ajustado para o percentual de gordura corporal e o estadio puberal. O desem-penho da circunferência do pescoço para identificar resistência à insulina foi testado pela Receiver Operating Characteristic Curve.
Resultados: Após ajuste para o percentual de gordura corporal e estadio puberal, a circunferência do pescoço correlacionou-se com circunferência da cintura, pressão arterial, triglicérides e marcadores de resistência à insulina em ambos os sexos.
Conclusões: Os resultados demonstraram que a circunferên-cia do pescoço é uma ferramenta útil para detectar a resistêncircunferên-cia à insulina e a alteração nos indicadores de síndrome metabólica em adolescentes. A facilidade de aplicação e o baixo custo podem viabilizar sua utilização em serviços de Saúde Pública.
Palavra-chave: resistência à insulina; síndrome x metabólica; adolescente; adiposidade.
RESUMEN
Objetivo: Evaluar la correlación de la circunferen-cia del cuello con resistencia a la insulina y con los compo-nentes del síndrome metabólico en adolescentes con distintos niveles de adiposidad y estadios puberales, así como determinar la utilidad de la circunferencia del cuello como un parámetro en la predicción de resistencia a la insulina en adolescentes.
Métodos: Estudio transversal en el que se evaluó a 388 ado-lescentes de ambos sexos, de los 10 a los 19 años. Los adoado-lescentes fueron sometidos a evaluación antropométrica y de composición corporal, incluyendo circunferencias del cuello y de la cintura, y la evaluación bioquímica. El estadio puberal se obtuvo me-diante autoevaluación y la presión arterial, por el método de ausculta. Se evaluó la resistencia a la insulina por el Homeostasis Model Assessment-Insulin Resistence. La correlación entre dos variables fue evaluada con el coeficiente de corrrelación parcial ajustado para el porcentaje de grasa corporal y el estadio puberal. El desempeño de la circunferencia del cuello para identificar resistencia a la insulina fue evaluado por la Receiver Operating Characteristic Curve y se consideró p<0,05.
Resultados: Después del ajuste para el porcentaje de grasa cor-poral y estadio puberal, la circunferencia del cuello se correlacionó con la circunferencia de la cintura, presión arterial, triglicéridos y marcadores de resistencia a la insulina en ambos sexos.
Conclusiones: Los resultados demostraron que la circunferen-cia del cuello es una herramienta útil para detectar la resistencircunferen-cia
a la insulina y la alteración en los indicadores de síndrome meta-bólico en adolescentes. La facilidad de aplicación y el bajo costo pueden hacer su uso viable en servicios de Salud Pública.
Palabras clave: resistencia a la insulina; síndrome x metabólico; adolescente; adiposidad.
Introduction
Body composition and body fat distribution are associ-ated with complications such as insulin resistance (IR), dyslipidemia, diabetes mellitus type 2, and cardiovascular diseases (CVD) in adults, children, and adolescents(1,2).
Imag-ing studies — computed tomography, magnetic resonance and dual energy X-ray absorptiometry (DEXA) — are the gold standard tools for evaluating body adiposity, but they are not applicable in all situations and have a high cost. In epidemiological studies and in clinical practice, anthro-pometric measurements such as body mass index (BMI), waist circumference (WC), and neck circumference (NC) are valued for being quicker, non-invasive, more accesible, and cheaper than imaging studies, making them easier to apply(3).
Having international reference standards, BMI is cur-rently the most common measurement for the diagnosis of overweight and obesity in children and adolescents. However, it cannot always assess people’s individual risks of endocrine and metabolic complications, since it does not evaluate body fat distribution(3). WC has been used in the diagnosis of
metabolic syndrome (MS), as a predictor of IR, and in the assessment of risk factors for CVD in adolescents(4). However,
there are limitations for this age group, such as the lack of a standard method of measurement(5-7); lack of an international
standard due to ethnic variation; lack of a cutoff point for car-diovascular and metabolic risks; and practical obstacles, such as the need to undress, particularly during winter. This may also have a psychological effect on this age group(8).
Studies involving adults have suggested using NC as an alternative to WC, since NC is a simpler and more practical anthropometric indicator, not affected by postprandial ab-dominal distension or by respiratory movements. According to these studies, this measurement provides consistent results for excess subcutaneous fat in the upper body(8-10). An increase in
NC, as well as visceral fat, is associated with cardiometabolic risks(10). Studies with adults also found a positive correlation
of NC with IR, components of MS, and cardiovascular risk factors(8-10). Studies that evaluate NC in adolescents are rare.
identiication of metabolic alterations helps prevent diseases, this study aimed to: 1) evaluate the correlation of NC with IR and components of MS in adolescents with different body fat levels and at different puberty stages; and 2) identify whether NC may be a predictor of IR in this age range.
Method
This cross-sectional study is based on a larger study named
Brazilian Metabolic Syndrome Study (BRAMS), which evaluates clinical, anthropometric, metabolic, and hormonal aspects of insulin resistance syndrome in children and adolescents.
Three hundred and eighty-eightadolescents of both sexes, between ten and 19 years old, were evaluated. A convenience sampling strategy was used. The sample comprised adolescents treated at an outpatient clinic for obese children and adoles-cents in the Hospital de Clínicas da Universidade Estadual de Campinas, at primary health care units, adolescents from public schools, and adolescents from institutions who offer socio-educational programs for this age range. The study included overweight, obese, and normal weight subjects, according to criteria from the Centers for Disease Control and Prevention (CDC)(11). Exclusion criteria were: cervical lymph
nodes or deformities, goitre, late neuropsychological and motor development, congenital syndromes, hepatopathy, nephropathy, metabolic disorders (such as type 1 diabetes, hypothyroidism, and hyperthyroidism) and use of systemic corticosteroids.
Weight and height were measured according to the techniques proposed by Gordon et al(12). From these
mea-surements, the z score for body mass index-for-age (BMIz) was determined. WC was measured with a measuring tape at the midpoint between the iliac crest and the last rib(13).
NC was measured at the midpoint of the neck(9). Body fat
percentage (BF%) was assessed by tetrapolar bioelectrical impedance(14,15) using the BIA 310 Bioimpedance Analyzer
device, as proposed by Lukaski et al(14). Blood pressure was
measured by the auscultatory method using a mercury col-umn sphygmomanometer, as recommended by the Brazilian Society of Cardiology(16). Sexual maturation was self-assessed
following the criteria suggested by Tanner(17). For the
clas-siication between prepubertal (1–2) and pubertal (3–5), we considered breasts in females and external genitalia in males.
For biochemical evaluation, blood samples were col-lected after an overnight 12-hour fast. Plasma glucose, total cholesterol (TC), HDL, triglycerides (TG), and gamma-glutamyl transferase (GGT) were determined using the enzymatic colorimetric method, and the LDL-cholesterol fraction was calculated with the Friedewald equation(18).
Plasma uric acid was measured by the uricase method; gly-cated hemoglobin (HbA1C), by high-performance liquid chromatography (HPLC); serum concentrations of aspar-tate aminotransferase (AST) and alanine aminotransferase (ALT), by the UV-kinetic method; and plasma insulin, by chemiluminescence. IR was assessed by the Homeostasis Model Assessment-Insulin Resistance (HOMA1-IR) index, calculated with the HOMA1-IR = fasting insulin (mU/L) x fasting glycemia (mmol/L)/22.5 equation(19). The cutoff
point for the HOMA1-IR index was set at the 75th percen-tile of the evaluated sample, which was stratiied by sex and puberty stage, with HOMA1-IR ≥3.87 and HOMA1-IR
≥4.19 for prepubertal and pubertal females, respectively; and HOMA1-IR ≥3.85 and HOMA1-IR ≥3.77 for pre-pubertal and pre-pubertal males, respectively.
Data were analyzed using the Statistical Package for the Social Sciences (SPSS) 16.0 software and the MedCalc 9.3.0.0 software. Signiicance level was set at 5% (p<0.05). To char-acterize the sample, we used descriptive statistics (mean and standard deviation or median and semi-interquartile range). The Kolmogorov-Smirnov test was used to determine the distribution of variables. To check for differences between prepubertal and pubertal males and females, we used either Student’s t test or the Mann-Whitney test. The correla-tions between two variables were evaluated by the partial correlation coeficient adjusted for BF% and puberty stage. Qualitatively, correlations were classiied as: 0–0.3 – weak; 0.3–0.6 – moderate; 0.6–0.9 – strong; and 0.9–1 – very strong. ROC (Receiver Operating Characteristic) curves were constructed and the areas under the curve (AUC) were cal-culated with a 95% conidence interval (IC). The sensitivity and speciicity of NC and its positive and negative predictive values were calculated for each cutoff point in the sample.
This study was approved by the Unicamp Research Ethics Committee, under decision n. 900/2010, and the children’s parents or guardians signed an informed consent form.
Results
The adolescents’ characteristics regarding age, anthropom-etry, body composition, blood pressure, and biochemistry are shown in Table 1. In females, mean NC and median systolic blood pressure (SBP) were signiicantly higher in pubertals than in prepubertals. Mean HbA1C and median AST and ALT were also different, with higher values for prepubertal females. The other variables did not differ between the groups. In males, mean NC and plasma uric acid, as well as median SBP and diastolic blood pressure (DBP), differed between prepubertals and pubertals, with higher values for the latter group. Mean BF%, glycemia, TC, LDL, and median HbA1C and AST were higher in prepubertal males, with a statistically signiicant dif-ference. The other variables did not differ between the groups. Correlations between NC, IR, and components of meta-bolic syndrome (SM) are presented in Table 2. NC showed a good correlation with obesity markers BMIz and WC in both sexes and puberty stages. Regarding markers of metabolic syn-drome, NC showed a positive correlation with SBP, DBP, TG, plasma uric acid, GGT, and ALT and a negative correlation with
HDL-cholesterol in pubertal females. A positive linear correlation was found between NC, SBP, DBP, plasma uric acid, and GGT in prepubertal males, while NC showed a positive linear correla-tion with SBP, DBP, LDL, TG, plasma uric acid, and GGT and a negative correlation with HDL in pubertal males. Regarding markers of IR, NC was positively correlated with insulin and HOMA1-IR in pubertal and prepubertal females. In males, there was a positive correlation only in the pubertal group. After being adjusted for BF% and puberty stage, NC showed a positive cor-relation with BMIz, WC, SBP, DBP, insulin, HOMA1-IR, TG, plasma uric acid, and GGT in both sexes, as well as a negative correlation with HDL. In males, NC was negatively correlated with HbA1C. In females, NC was correlated with ALT.
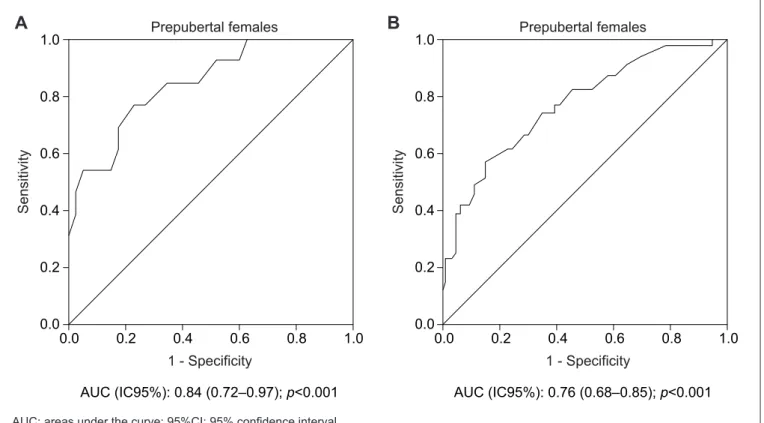
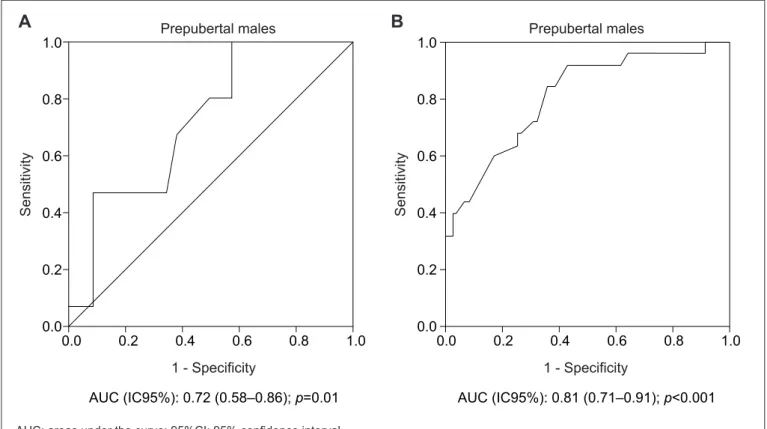
The areas under the ROC curve for NC as a predictor of IR in male and female pubertal and prepubertal adolescents can be seen in Figures 1 and 2, respectively. The AUCs were statistically signiicant (p<0.05). NC showed a bigger AUC for IR in prepubertal females (Figure 1A) when compared to the pubertal ones (Figure 1B). In males, NC showed a bigger
Variables
Females Males
Prepubertal
(n=50)
Pubertal
(n=169)
Prepubertal
(n=59)
Pubertal
(n=110)
Age (years) 11.0 (0.5) 15.0 (1.3)2a* 11.0 (1.0) 15.0 (1.5)2a*
Anthropometry
BMI Z score 0.9±1.4 0.8±1.11b 1.5 (1.0) 1.1 (0.9)2a
Waist circumference (cm) 77.5±15.9 82.3±15.41b 82.1±17.2 85.4±17.31b
Neck circumference (cm) 30.6±4.0 32.6±2.91b* 32.8±3.8 35.4±3.71b*
Body composition
BF% 28.1±8.9 30.6±7.41b 27.1±9.4 22.4±8.61b**
Blood pressure
Systolic blood pressure (mmHg) 100.0 (6.5) 110.0 (9.0)2a*** 100.0 (10.5) 110.0 (10.0)2a*
Diastolic blood pressure (mmHg) 70.0 (10.0) 70.0 (7.5)2a 65.0 (5.0) 70.0 (10.0)2a*
Biochemistry
Fasting glycemia (mg/dL) 78.6±9.1 77.5±9.71b 84.0±7.9 80.9±10.91b***
Fasting insulin (mU/L) 13.3 (6.3) 14.1 (5.2)2a 10.7 (5.6) 10.8 (5.6)2a
Glycated hemoglobin (%) 5.5±0.4 5.3±0.51b** 5.7 (0.3) 5.4 (0.3)2a**
HOMA1-IR 2.6 (1.1) 2.7 (1.2)2a 2.1 (1.3) 2.3 (1.2)2a
Total cholesterol (mg/dL) 160.3±35.1 160.5±30.21b 165.5±33.5 154.9±29.51b***
LDL-cholesterol (mg/dL) 96.3±33.6 95.4±26.81b 99.8±29.5 90.6±26.91b***
HDL-cholesterol (mg/dL) 46.2±10.7 48.8±11.71b 45.8±11.3 46.7±11.71b
Triglycerides (mg/dL) 78.0 (26.5) 73.0 (19.5)2a 81.0 (35.5) 69.5 (24.0)2a
Uric acid (mg/dL) 4.4±1.1 4.3±1.21b 4.4±1.5 5.6±1.41b*
Gamma-glutamyl transferase(U/L) 15.0 (4.0) 16.0 (4.5)2a 19.0 (5.0) 19.0 (5.0)2a
Aspartate aminotransferase (U/L) 21.5 (3.5) 18.0 (2.5)2a* 24.0 (3.0) 21.5 (3.3)2a***
Alanine aminotransferase (U/L) 16.0 (4.0) 14.0 (3.5)2a*** 16.0 (4.0) 17.5 (5.0)2a
Table 1 - Adolescents’ proiles according to age, anthropometry, body composition, blood pressure, and biochemistry
Females Males Prepubertal*
(n=50)
Pubertal* (n=169)
Total** (n=219)
Prepubertal* (n=59)
Pubertal* (n=110)
Total** (n=169) Anthropometry
BMI Z score 0.39*** 0.53**** 0.48**** 0.57**** 0.58**** 0.58****
Waist circumference (cm) 0.51**** 0.71**** 0.64**** 0.82**** 0.78**** 0.79****
Blood pressure
Systolic blood pressure (mmHg) 0.32 0.27**** 0.28**** 0.49**** 0.45**** 0.47****
Diastolic blood pressure (mmHg) 0.22 0.16***** 0.18*** 0.43**** 0.34**** 0.37****
Biochemistry
Fasting glycemia (mg/dL) 0.26 -0.01 0.08 0.04 -0.13 -0.08
Fasting insulin (mU/L) 0.30***** 0.49**** 0.43**** 0.25 0.31*** 0.29****
Glycated hemoglobin (%) -0.03 0.12 0.085 -0.18 -0.17 -0.17*****
HOMA1-IR 0.31***** 0.46**** 0.41**** 0.25 0.30*** 0.29****
Total cholesterol (mg/dL) 0.001 0.06 0.04 -0.02 0.14 0.08
LDL-cholesterol (mg/dL) 0.04 0.11 0.09 -0.03 0.25*** 0.14
HDL-cholesterol (mg/dL) -0.20 -0.26*** -0.24**** -0.22 -0.40**** -0.34****
Triglycerides (mg/dL) 0.13 0.30**** 0.25**** 0.19 0.26*** 0.23***
Uric acid (mg/dL) 0.19 0.43**** 0.35**** 0.54**** 0.50**** 0.52****
Gamma-glutamyl transferase (U/L) -0.03 0.27**** 0.20*** 0.31***** 0.36**** 0.34****
Aspartate aminotransferase (U/L) -0.05 0.11 0.07 0.10 -0.07 -0.04
Alanine aminotransferase (U/L) 0.14 0.19***** 0.17*** 0.16 0.13 0.14
Table 2 - Correlation between neck circumference (in cm), insulin resistance, and components of metabolic syndrome
*Partial correlation adjusted for body fat percentage; **Partial correlation adjusted for body fat percentage and puberty stage; ***p<0.01; ****p<0.001;*****p<0.05; HOMA1-IR: Homeostasis Model Assessment-Insulin Resistance
1.0
0.8
0.6
0.4
0.2
0.0
0.0 0.2 0.4 0.6 0.8 1.0
Prepubertal females
1 - Specificity
AUC (IC95%): 0.84 (0.72–0.97); p<0.001
Se
n
si
ti
vi
ty
1.0
0.8
0.6
0.4
0.2
0.0
0.0 0.2 0.4 0.6 0.8 1.0
Prepubertal females
1 - Specificity
AUC (IC95%): 0.76 (0.68–0.85); p<0.001
Se
n
si
ti
vi
ty
Figure 1 - ROC curve for neck circumference in the assessment of insulin resistance in female prepubertal (A) and pubertal (B) adolescents AUC: areas under the curve; 95%CI: 95% conidence interval
1.0
0.8
0.6
0.4
0.2
0.0
0.0 0.2 0.4 0.6 0.8 1.0
Prepubertal males
1 - Specificity
AUC (IC95%): 0.72 (0.58–0.86); p=0.01
Se
n
si
ti
vi
ty
1.0
0.8
0.6
0.4
0.2
0.0
0.0 0.2 0.4 0.6 0.8 1.0
Prepubertal males
1 - Specificity
AUC (IC95%): 0.81 (0.71–0.91); p<0.001
Se
n
si
ti
vi
ty
Figure 2 - ROC curve for neck circumference in the assessment of insulin resistance in male prepubertal (A) and pubertal (B) adolescents AUC: areas under the curve; 95%CI: 95% conidence interval
A
B
Cutoff points
for NC (cm)
SE
(95%CI)
SP
(95%CI)
PPV
(%)
NPV
(%) Females
Prepubertal >32.0 76.92 (46.2–94.7) 77.50 (61.5–89.1) 47.6 90.6
Pubertal >34.1 56.41 (39.6–72.2) 84.75 (77.0–90.7) 53.6 85.3
Males
Prepubertal >30.3 100.00 (78.0–100.0) 42.55 (28.3–57.8) 35.7 100.0
Pubertal >34.8 92.00 (73.9–98.8) 57.33 (45.4–68.7) 41.8 95.5
NC: neck circumference; 95%CI: 95% conidence interval; SE: sensitivity; SP: speciicity; PPV: positive predictive value; NPV: negative predictive value
Table 3 - Cutoff points, sensitivities, speciicities, and positive and negative predictive values of neck circumference for IR screening in adolescents
AUC for IR in the pubertal group (Figure 2B) than in the prepubertal group (Figure 2A). The different cutoff points for NC and their respective sensitivities, speciicities, and positive and negative predictive values are shown in Table 3. To identify IR in pubertal and prepubertal females, the cutoff points for NC were >34.1cm and >32.0cm, respectively. In males, the values were >30.3cm for prepubertal and >34.8cm for pubertal adolescents.
Discussion
NC may be considered during nutritional assessment and is suggested as a substitute marker of obesity in children and adolescents in various studies(20-22). This article demonstrated a
and puberty stage, which suggests NC is also a good indicator of excess body fat in Brazilian adolescents.
Guo et al(23) and Kurtoglu et al(24) observed a correlation
between NC and anthropometric indicators of obesity. Guo et al(23) evaluated 6,802 Chinese children and
adoles-cents between ive and 18 years old, dividing them into BMI categories, and found a signiicant correlation between NC and WC. Despite a decrease in correlation coeficients after the adjustment for age, sex, and BMI, NC remained positively correlated with WC. The authors also observed an association between NC and BMI in the three BMI categories, but no signiicance was found in the obese group after the adjustment for age, sex and WC. In the study by Kurtoglu et al(24), with 581 Turkish children and
adolescents between ive and 18 years old, there was also a signiicant correlation between NC, WC and BMI in pubertal and prepubertal adolescents of both sexes.
Various studies with adults demonstrated that NC is a simple screening tool to identify people with cardiometa-bolic alterations(8-10). Few studies with children evaluated
NC as an indicator of IR and of alterations in components of MS(23-25). When comparing our results with the ones
ob-tained by Kurtoglu et al(24), who analyzed the correlation
between NC and markers of MS according to sex and pu-berty stage, we found that, in our previous study, there was a positive correlation between NC, SBP, DBP, glycemia, and TC in prepubertal females, and a negative correlation with HDL. This was not observed in this study, possibly because our analyses were performed using the partial correlation coeficient adjusted for BF%. Still regarding females, our article shows a positive correlation between NC, SBP, DBP, and TG, and a negative correlation between NC and HDL-cholesterol in the pubertal group, which is in agreement with the previous study. Kurtoglu et al(24)
demonstrated a positive correlation between NC and SBP, DBP, glycemia, TC, and TG in prepubertal males, while we only found a positive linear correlation with SBP and DBP. Both in the present and in the previous study, NC was positively correlated with SBP, DBP, TG, and LDL, but showed a negative linear correlation with HDL.
Androutsos et al(25) evaluated 324 Greek children
and adolescents between nine and 13 years old and detected a positive correlation between NC and DBP and a negative one with HDL in both sexes. In the same study, NC was positively correlated with DBP and TG in females. In the multivariate regression analysis after
adjustment for age, sex, Tanner stage, physical activity, and intake of proteins, carbohydrates, and fat, NC had a significant positive correlation with HDL, TG, SBP and DBP. The authors also noticed that the associations between NC and the risk factors for CVD were similar to the ones observed with BMIz, WC, hip circumference, waist-to-hip ratio and waist-to-height ratio in children and adolescents. In our study, after being adjusted for BF% and puberty stage, NC showed a positive correla-tion with SBP, DBP, and TG in both sexes, as well as a negative correlation with HDL.
The Chinese study evaluated the correlation between NC and blood pressure in different BMI groups. In nor-mal weight subjects, the biggest NC was associated with an increased risk of pre-hypertension (OR 1.64, 95%CI 1.29–2.08) after adjustments for age and sex. This re-sult remained signiicant after adjustments for age, sex, BMI, and WC (OR 1.44; 95%CI 1.12–1.85). In the overweight and obese groups, no signiicant odds ratios were observed. In the normal weight group, there was an association between NC, SBP (β=0.58mmHg), and DBP (β=0.24mmHg)(23).
Regarding markers of IR, Kurtoglu et al(24) found a
posi-tive correlation between NC, insulin, and HOMA1-IR in pu-bertal and prepupu-bertal adolescents of both sexes. Our study, however, demonstrated a correlation both in pubertal and prepubertal females, but only in pubertal males. Androutsos
et al(25) presented a positive correlation of NC with insulin
and HOMA-IR in both sexes. The results remained signii-cant after adjustments for age, sex, Tanner stage, physical activity, and intake of proteins, carbohydrates and fat. In our study, after being adjusted for BF% and puberty stage, NC showed a positive correlation with insulin and HOMA1-IR in males and females.
We also evaluated the association between NC, plasma uric acid, GGT, ALT, and AST in adolescents, which were previ-ously analyzed in adults only. In a study we conducted with adults, NC was associated with plasma uric acid and GGT only in women(8). In the current investigation, NC was correlated
with plasma uric acid, GGT, and ALT in pubertal females, while it was correlated with plasma uric acid and GGT both in prepubertal and pubertal males. After the adjustment for BF% and puberty stage, NC was correlated with plasma uric acid and GGT in both sexes and with ALT in females.
ROC curves. The results showed that NC is a good predictor of IR in adolescents. The mechanisms involved in the associa-tion between NC and cardiometabolic risk factors were not deined. Data in the literature indicate that subcutaneous fat in the upper body, as well as visceral fat, is associated with cardiometabolic risks(10). This is possibly due to the fact
that visceral fat is not the main source of concentrations of circulating free fatty acid (FFA)(26). Besides, subcutaneous fat
in the upper body causes an increase in systemic free fatty acid release when compared to visceral fat, particularly in obese individuals(27). Similarly, high concentrations of FFA
were associated with IR and a higher cardiovascular risk(28,29).
Since this upper-body subcutaneous fat can be easily assessed by NC, this measurement may be an important predictor of IR and of cardiometabolic risks. It may also contribute to a better understanding of the effects of body fat distribution in adolescents. Further longitudinal studies are needed to analyze the relationship between NC, IR, and alterations in components of MS in adolescents.
Our results show that NC has good sensitivity for the iden-tiication of IR and could even be used as a screening method. When comparing this study with our previous study with adults, which also suggested NC is a useful tool for predicting IR, we concluded that the cutoff point for adolescents is lower(8).
NC has some advantages over WC: good inter-rater and intra-rater reliability; no need for multiple accuracy and reliability measurements(30); no inluence of time of
measure-ment (preprandial and postprandial period); more stable
body surface; easier for both examiners and participants, particularly during winter and in crowded locations; more socially acceptable and more convenient, especially for over-weight and obese adolescents. However, NC does not have international reference values yet.
The present study has the following limitations: 1) the results are based on a cross-sectional study, which precludes the identiication of causality; 2) the sample was selected by convenience, with a higher proportion of obese individuals; 3) we did not analyze the correlations with imaging studies that directly quantify fat deposits. Despite these limitations, our results were in agreement with the results of the cited studies and showed that NC may be an important health indicator in adolescents, since it is a screening tool that can identify IR and alterations in the components of MS in Bra-zilian adolescents. Its simplicity and low cost may enable its use in Public Health services and in epidemiological studies.
Investigadores do Brams
(Brazilian Metabolic Syndrome Study):
Ana Carolina Junqueira Vasques, Ana Maria De Ber-nardi Rodrigues, André Luiz Gonçalves de Freitas, Bruno Geloneze, Cleliani de Cassia da Silva, Daniella Fernandes Camilo, Fabiana Lopes Nogueira, Francieli Barreiro, José Carlos Pareja, Maria Ângela Reis de Góes Monteiro Antonio, Mariana Pontes Ferrari, Mariana Porto Zambom, Patrícia Brito Rodrigues, Roberta Soares Lara Cassani.
References
1. Després JP, Moorjani S, Lupien PJ, Tremblay A, Nadeau A, Bouchard C. Regional distribution of body fat, plasma lipoproteins, and cardiovascular disease. Arteriosclerosis 1990;10:497-511.
2. Daniels SR, Morrison JA, Sprecher DL, Khoury P, Kimball TR. Association of body fat distribution and cardiovascular risk factors in children and adolescents. Circulation 1999;99:541-5.
3. Cornier MA, Després JP, Davis N, Grossniklaus DA, Klein S, Lamarche B
et al. Assessing adiposity: a scientiic statement from the American Heart
Association. Circulation 2011;124:1996-2019.
4. Hirschler V, Aranda C, Calcagno Mde L, Maccalini G, Jadzinsky M. Can waist circumference identify children with the metabolic syndrome? Arch Pediatr Adolesc Med 2005;159:740-4.
5. Taylor RW, Jones IE, Williams SM, Goulding A. Evaluation of waist circumference, waist-to-hip ratio, and the conicity index as screening tools for high trunk fat mass, as measured by dual-energy X-ray absorptiometry, in children aged 3–19 y. Am J Clin Nutr 2000;72:490-5.
6. McCarthy HD, Jarrett KV, Crawley HF. The development of waist circumference percentiles in British children aged 5.0-16.9 y. Eur J Clin Nutr 2001;55:902-7.
7. Asayama K, Dobashi K, Hayashibe H, Kodera K, Uchida N, Nakane T et al. Threshold values of visceral fat measures and their anthropometric alternatives for metabolic derangement in Japanese obese boys. Int J Obes Relat Metab Disord 2002;26:208-13.
8. Stabe C, Vasques AC, Lima MM, Tambascia MA, Pareja JC, Yamanaka A et al. Neck circumference as a simple tool for identifying the metabolic syndrome and insulin resistance: results from the Brazilian Metabolic Syndrome Study (Brams). Clin Endocrinol (Oxf) 2013;78:874-81.
9. Ben-Noun L, Laor A. Relationship of neck circumference to cardiovascular risk factors. Obes Res 2003;11:226-31.
10. Preis SR, Massaro JM, Hoffmann U, D’Agostino RB Sr, Levy D, Robins SJ
et al. Neck circumference as a novel measure of cardiometabolic risk: the Framingham Heart Study. J Clin Endocrinol Metab 2010;95:3701-10. 11. Kuczmarski RJ, Ogden CL, Guo SS, Grummer-Strawn LM, Flegal KM, Mei Z et
al. 2000 CDC Growth Charts for the United States: methods and development. Vital Health Stat 11 2002;1-190.
12. Gordon CC, Chumlea WC, Roche AF. Stature, recumbent length, and weight. In: Lohman TG, Roche AF, Martorell R, editors. Anthropometric standardization: reference manual. Champaign: Human Kinetics; 1988. p. 3-8.
13. World Health Organization. Obesity: preventing and managing the global epidemic. Report of a WHO Consultation. World Health Organ Tech Rep Ser 2000;894:1-253. 14. Lukaski HC, Bolonchuk WW, Hall CB, Siders WA. Validation of tetrapolar
bioelectrical impedance method to assess human body composition. J Appl Physiol 1986;60:1327-32.
16. Sociedade Brasileira de Cardiologia; Sociedade Brasileira de Hipertensão; Sociedade Brasileira de Nefrologia. VI Diretrizes Brasileiras de Hipertensão. Arq Bras Cardiol 2010;95 (Suppl 1):1-51.
17. Tanner JM. Growth at adolescence. 2nd ed. Oxford: Blackwell Scientiic Publications; 1962.
18. Friedewald WT, Levy RI, Fredrickson DS. Estimation of the concentration of low-density lipoprotein cholesterol in plasma, without use of the preparative ultracentrifuge. Clin Chem 1972;18:499-502.
19. Matthews DR, Hosker JP, Rudenski AS, Naylor BA, Treacher DF, Turner RC. Homeostasis model assessment: insulin resistance and beta-cell function from fasting plasma glucose and insulin concentrations in man. Diabetologia 1985;28:412-9. 20. Hatipoglu N, Mazicioglu MM, Kurtoglu S, Kendirci M. Neck circumference: an additional
tool of screening overweight and obesity in childhood. Eur J Pediatr2010;169:733-9. 21. Naiu OO, Burke C, Lee J, Voepel-Lewis T, Malviya S, Tremper KK. Neck
circumference as a screening measure for identifying children with high body mass index. Pediatrics 2010;126:e306-10.
22. Lou DH, Yin FZ, Wang R, Ma CM, Liu XL, Lu Q. Neck circumference is an accurate and simple index for evaluating overweight and obesity in Han children. Ann Hum Biol 2012;39:161-5.
23. Guo X, Li Y, Sun G, Yang Y, Zheng L, Zhang X et al. Prehypertension in children and adolescents: association with body weight and neck circumference. Intern Med 2012;51:23-7.
24. Kurtoglu S, Hatipoglu N, Mazicioglu MM, Kondolot M. Neck circumference as a novel parameter to determine metabolic risk factors in obese children. Eur J Clin Invest 2012;42:623-30.
25. Androutsos O, Grammatikaki E, Moschonis G, Roma-Giannikou E, Chrousos GP, Manios Y et al. Neck circumference: a useful screening tool of cardiovascular risk in children. Pediatr Obes 2012;7:187-95.
26. Guo Z, Hensrud DD, Johnson CM, Jensen MD. Regional postprandial fatty acid metabolism in different obesity phenotypes. Diabetes 1999;48:1586-92.
27. Nielsen S, Guo Z, Johnson CM, Hensrud DD, Jensen MD. Splanchnic lipolysis in human obesity. J Clin Invest 2004;113:1582-8.
28. Boden G, Shulman GI. Free fatty acids in obesity and type 2 diabetes: deining their role in the development of insulin resistance and beta-cell dysfunction. Eur J Clin Invest 2002;32 (Suppl 3):14-23.
29. Mathew M, Tay E, Cusi K. Elevated plasma free fatty acids increase cardiovascular risk by inducing plasma biomarkers of endothelial activation, myeloperoxidase and PAI-1 in healthy subjects. Cardiovasc Diabetol 2010;9:1-9.