AR
TIGO ORIGINAL / ORIGINAL AR
TICLE
PAIRED COMPARISON BETWEEN WATER
AND NUTRIENT DRINK TESTS IN
HEALTHY VOLUNTEERS
Vasileios
PAPADOPOULOS
, Maria
FRAGAKI
and Konstantinos
MIMIDIS
ABSTRACT – Context - Drink tests constitute an inexpensive and non-invasive tool, which has been proposed to discriminate individuals with altered luid intake, as dyspeptics. However, their use in everyday clinical practice is still limited as standardization still lacks. Objective - To perform a direct, paired comparison between the water and the nutrient drink test in normal volunteers. Methods - Thirty eight normal volunteers (19 males, 19 females, mean age 24.4 ± 0.4 years) underwent drink test with water and nutrient (Nutridrink) within 7-10 days. Both tests included a loading (consumption of 100 mL/min for water and 15 mL/min for Nutridrink for the longest possible period of time) and a recuperation phase (observation after cessation of luid intake), being separated by the maximal saturation point. During phases, satiety, fullness, discomfort, bloating, belching, nausea, pain and burning sensation (epigastric and thoracic) were recorded using a 0-100 visual analogue scale score (VAS). For the purpose of coniguration, four variables were considered: time (t), VAS score (V), VAS slope (S) for a given time period, and probability of participation (Q) at a given timepoint. Results - The loading phase lasted for 11.6 ± 1.7 min in water (total VAS: 879 ± 123, total VAS slope 72.6 ± 10.9 min-1) and 93.3 ± 18.4 min in Nutridrink test (total VAS: 1462 ± 411, total VAS slope 15.9 ± 3.2 min-1); P<0.001. The mean ingested
volume recorded was 1155 ± 164 mL for water and 1399 ± 276 mL for nutrient; P = 0.076. Cessation of luid intake was mainly attributed to fullness (76.3%) in water and satiety (69.2%) in Nutridrink test. Nausea was recorded only in Nutridrink test (15.4%). No volunteer reported substantial, persistent pain or burning sensation. The recuperation phase lasted 63.6 ± 7.8 min in water (total VAS: 278 ± 75, total VAS slope 3.97 ± 0.95 min-1) and 123.2 ± 17.5 min in Nutridrink test (total VAS: 841 ± 126, total VAS slope 6.81
± 1.63 min-1); P<0.001. Concerning total VAS scores for both phases of the two tests, fullness and satiety represented a mere four ifths
of the total (43% and 36%, respectively). Belching (8%), bloating (6%), nausea (4%), and discomfort (3%) followed, while pain and burning sensation represented <1% of the whole. However, intra- and intertest correlations concerning total and symptom-speciic VAS scores revealed statistically signiicant variations underlying differences in physiology of liquid intake. A multiple regression model considering body mass index, gender and age as dependent variables, and total and symptom-speciic VAS scores and slopes for both phases of the two tests as independent variables, did not reveal any primary correlation. The function linking the expected probability of participation Q and symptom-speciic VAS score V with time t is approached by the formulas Q(t)=1/[1+(t/c)^k] and V(t)=V0*e^(-t/c),respectively; V0 is the mean symptom-speciic VAS score, c, and k are phase- and test- related constants, and e = 2.718 is the base of natural logarithms. Conclusion - The comparative standardization of both drink tests in normal individuals might provide a tool for clinical application, targeting the diagnosis and treatment of relevant functional disorders.
HEADINGS – Drinking, physiology. Potable water. Stochastic processes.
INTRODUCTION
Drink tests with both water and nutrient constitute an inexpensive and non-invasive tool, which has been introduced to describe drinking behavior in dyspeptics(8, 11). Additionally, these tests have been
used as an investigative method for assessing the effect of pharmacologically active substances on gastric motility(4, 13). Their proposed ability to discriminate
individuals with altered luid intake, as those suffering from functional dyspepsia, made them potent candidates for use in everyday clinical practice(1, 5, 6, 13).
The potent clinical application of drink tests is still hampered as data concerning normal gastric response to ingested water or nutrient are limited; thus, intra- and inter- test variation is large enough to prohibit the level of standardization requested in order to ascertain diagnosis and guide therapy(8). Additionally, there is
much ongoing dispute on what exactly the drink tests currently used measure regarding gastric sensation, accommodation, and emptying and which test should be performed in every occasion(8, 9). Despite the urge
for the introduction of drink tests in the routine clinical practice, no direct comparison between water
First Department of Internal Medicine, Democritus University of Thrace, Greece
and nutrient intake has ever been carried in normal individuals to provide decisive data.
The present study aims to perform a direct, paired comparison between the water and the nutrient drink test in the same group of normal volunteers. During this process, data concerning the range, intensity and rapidity of symptoms evoked during each test, the parameters of the maximal saturation point, as well as the dynamics of the tests simulated through mathematical models, served to propose test coniguration and potent clinical applications.
METHODS
Healthy volunteers were recruited among medical students of the Democritus University of Thrace, Greece. No fee or other form of compensation was provided. To exclude functional disorders, a questionnaire, based on the Rome III classiication, was dispatched to all candidate volunteers; negative response to all questions was a prerequisite for eligibility. All eligible volunteers were recruited. Informed, written consent has been obtained from every recruited volunteer. The study protocol design was in accordance of the Declaration of Helsinki and the procedures have been approved by the local ethics committee (Scientiic Committee of the University Hospital of Alexandroupolis, Greece).
Each volunteer underwent both drink tests with water and nutrient liquid meal within a period of 7-10 days.
Drink test with water included a loading phase, during which the volunteer was asked to consume tap water at a rate of 100 mL/min. After each minute, symptoms including satiety, fullness, discomfort, bloating, belching, nausea, pain and burning sensation (epigastric and thoracic) were recorded as scores with the aid of the 0-100 visual analogue scale (VAS). When maximal drinking ability was reached (water maximal saturation), a recuperation phase followed, during which all the above symptoms were recorded every 15 minutes at a maximum of 120 minutes.
Drink test with Nutridrink (N.V. Nutricia, Zoetermeer, The Netherlands; 1.5 kcal/mL, 39% fat, 48% carbohydrates, 13% protein) included a similar loading phase, during which the volunteer was asked to consume the nutrient liquid meal at a rate of 15 mL/min. Satiety, fullness, discomfort, bloating, belching, nausea, pain and burning sensation (epigastric and thoracic) were recorded as VAS scores every 5 minutes. When maximal drinking ability was reached (nutrient maximal saturation), a similar recuperation phase followed, during which all the above mentioned symptoms were recorded every 15 minutes at a maximum of 180 minutes. The duration of the recuperation phase was arbitrarily set to 195 minutes in cases where symptoms still existed at 180 minutes.
Deinitions
Four kinds of variables are considered in the coniguration of the tests: time (t), expressed in minutes as time interval (Ti→j) between two timepoints (ti) and (tj), VAS score (V),
expressed in absolute values, VAS slope (S), expressed in
min-1, and ratio of participants (Q) expressed in absolute
values ranging from 0 to 1.
Each test is accounted as a compound phenomenon against time (t), with t = 0 deined as the maximal saturation point, namely the timepoint at which drinking ability is reached. Maximal saturation point denotes simultaneously the end of the loading phase and the starting of the recuperation phase. Time values during loading phase are expressed in negative values, with the lowest value corresponding to the starting point tS, namely the starting point of the loading phase (different for each volunteer), implying that the maximal saturation has not been reached yet. Time values during recuperation phase are expressed in positive values, with the highest value corresponding to the ending pointtE, namely the end of the recuperation phase (again different for each volunteer), which represents the timepoint of total withdrawal of symptoms. Loading and recuperation period are denoted by TL and TR, respectively.
VAS scoreof a given symptom at a given timepoint ti (Vi) is deined as the relevant numerical expression of VAS recorded at ti. Total VAS score of a given symptom within a given interval of time between ti and tj (Vi→j) is deined as the sum of all VAS scores referred to that symptom during Ti→j. Summated VAS score at a given timepoint ti (VSi) is deined as the sum of the VAS scores for all symptoms present at ti. Total summated VAS scorefor the loading phase (VL)is deined asthe sum of all summated VAS scores from starting to maximal saturation point. Total summated VAS score for the
recuperation phase (VR)is deined asthe sum of all summated VAS scores from maximal saturation to ending point.
VAS slope of a given symptom within a given interval of time between tiand tj (Si→j) is deined as the ratio [(Vj)-(Vi)]/
(tj-ti). Summated VAS slope within a given interval of time
between ti and tj (Si→j) is deined as the ratio [(VSj)-(VSi)]/(tj -ti). Total summated VAS slope for the loading phase (SL) is deined as the ratio VL/TL. Total VAS slope for the recuperation phase (SR) is deined as the ratio VR/TR.
The ratio of participants Qi at ti is the quotient of the number of participants Ni still on test at ti divided by N, where N is the total number of participants.
Statistical analysis
Descriptive statistics were presented as means along with their ±95% conidence intervals (in parentheses), unless speciied
otherwise. The parametric Pearson’s correlation coeficient was preferred for correlation studies whenever possible; else the non-parametric Spearman’s correlation coeficient was alternatively used (in case of non-normality or non-uniformity of distributions as described by Kolmogorov-Smirnov and/ or Lilliefors tests). Multiple regression models were used to discriminate primary, causative correlations from secondary, non-causative ones. Chi-square of goodness of it was used for the comparison of the symptoms distribution between the two tests. Student’s t-test was used for the comparison
by Kolmogorov-Smirnov and Lilliefors tests). Kendall’s W was used for estimation of cohesion between symptoms. Kaplan-Meier analysis was performed in order to depict the expected proportion of normal individuals to participate at a given time of a test. Cox-regression hazard analysis was introduced to exclude independently correlated parameters. Mathematical equations were built using the minimum sum of squares method among the simplest possible models. Paired tests were used when appropriate. Bonferroni corrections were used where multiple tests were carried when other, more speciic procedures, as multiple regression models or Cox regression hazard models were omitted for simplicity reasons. All numerical values concerning data were given with at least two signiicant digits. All tests are two-tailed and the level of statistical signiicance was set to P<0.05. All statistical
tests were performed with the aid of Statistica 4.5 and SPSS for Windows 11.0 statistical software. All mathematical models were built using the SlideWritePlus software freely available at the World Wide Web. Charts were created using Microsoft Excel 2003.
RESULTS
Demographics
Thirty-eight healthy volunteers presenting gender ratio 1:1 (19 males, 19 females), mean age 24.4 (23.5-25.3) years, mean length 172.8 (170.0-175.7) cm, mean weight 71.7 (67.3-75.7) kg, and mean body mass index (BMI) 23.9 (22.9-24.9) kg/m2
participated in the study. Both BMI and age do not decline from normality as documented by the Kolmogorov-Smirnov distance and P and Lilliefors P.
Overall comparative data
Water maximal saturation (corresponding to the duration of the loading phase, TL) was reached after a mean of 11.6 (9.9-13.2) min, while nutrient maximal saturation was reached after a mean of 93.3 (74.9-111.7) min. Hence, the mean ingested volume recorded was 1155 (991-1320) mL for water and 1399 (1123–1675) mL for nutrient (P = 0.076).
At the maximal saturation point, mean total and per symptom VAS scores (VS0 and V0 values, respectively) are comparatively given at Table 1.
The mean total summated score for the loading phase (VL) was 879 (656–1103) in water and 1462 (1050–1873) in nutrient. The mean total summated slope for the loading phase (SL) was 72.6 (61.7-83.5) min-1 for water and 15.9 (12.7–19.2)
min-1 for nutrient.
The mean duration of the recuperation phase (TR) was 63.6 (55.8–71.3) minutes for water and 123.2 (105.6-140.7) minutes for nutrient.
The mean total summated score for the recuperation phase (VR) was 278 (202–353) for water and 841 (615–1068) for nutrient and the mean SR was 3.97 (3.01–4.92) min-1 for
water and 6.81 (5.18–8.45) min-1 for nutrient.
Comparative data are given in Table 2.
TABLE 1. Maximal saturation parameters
Water test Nutrient test P
VS0 182 (161 - 202) 195 (174 - 216) 0.233
Discomfort V0 4.61 (0.646 - 8.56) 10.5 (2.88 - 18.2) 0.201
Fullness V0 77.9 (67.4 - 88.4) 73.2 (62.6 - 83.7) 0.405
Bloating V0 14.7 (4.52 - 25.0) 8.68 (1.17 - 16.2) 0.061
Nausea V0 6.18 (1.11 - 11.3) 15.8 (6.88 - 24.7) 0.027
Burning (ch) V0 0 0.132 (-0.135 - 0.398) 0.324
Belching V0 12.8 (6.13 - 19.4) 11.4 (6.34 - 16.6) 0.622
Burning (st) V0 0 0 ND
Satiety V0 64.2 (51.6 - 76.8) 74.1 (63.2 - 85.0) 0.176
Pain V0 1.18 (-0.500 - 2.87) 1.18 (-0.500 - 2.87) 1.000
ND = not deined
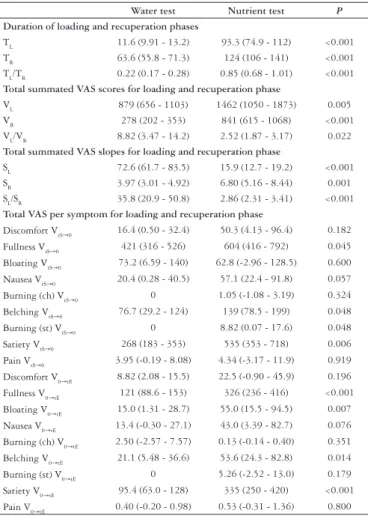
TABLE 2. Loading and recuperation phase parameters
Water test Nutrient test P
Duration of loading and recuperation phases
TL 11.6 (9.91 - 13.2) 93.3 (74.9 - 112) <0.001 TR 63.6 (55.8 - 71.3) 124 (106 - 141) <0.001 TL/TR 0.22 (0.17 - 0.28) 0.85 (0.68 - 1.01) <0.001
Total summated VAS scores for loading and recuperation phase
VL 879 (656 - 1103) 1462 (1050 - 1873) 0.005 VR 278 (202 - 353) 841 (615 - 1068) <0.001 VL/VR 8.82 (3.47 - 14.2) 2.52 (1.87 - 3.17) 0.022
Total summated VAS slopes for loading and recuperation phase
SL 72.6 (61.7 - 83.5) 15.9 (12.7 - 19.2) <0.001 SR 3.97 (3.01 - 4.92) 6.80 (5.16 - 8.44) 0.001 SL/SR 35.8 (20.9 - 50.8) 2.86 (2.31 - 3.41) <0.001
Total VAS per symptom for loading and recuperation phase
Discomfort VtS→0 16.4 (0.50 - 32.4) 50.3 (4.13 - 96.4) 0.182
Fullness VtS→0 421 (316 - 526) 604 (416 - 792) 0.045 Bloating VtS→0 73.2 (6.59 - 140) 62.8 (-2.96 - 128.5) 0.600 Nausea VtS→0 20.4 (0.28 - 40.5) 57.1 (22.4 - 91.8) 0.057
Burning (ch) VtS→0 0 1.05 (-1.08 - 3.19) 0.324 Belching VtS→0 76.7 (29.2 - 124) 139 (78.5 - 199) 0.048 Burning (st) VtS→0 0 8.82 (0.07 - 17.6) 0.048
Satiety VtS→0 268 (183 - 353) 535 (353 - 718) 0.006 Pain VtS→0 3.95 (-0.19 - 8.08) 4.34 (-3.17 - 11.9) 0.919 Discomfort V0→tE 8.82 (2.08 - 15.5) 22.5 (-0.90 - 45.9) 0.196 Fullness V0→tE 121 (88.6 - 153) 326 (236 - 416) <0.001
Bloating V0→tE 15.0 (1.31 - 28.7) 55.0 (15.5 - 94.5) 0.007 Nausea V0→tE 13.4 (-0.30 - 27.1) 43.0 (3.39 - 82.7) 0.076 Burning (ch) V0→tE 2.50 (-2.57 - 7.57) 0.13 (-0.14 - 0.40) 0.351
Belching V0→tE 21.1 (5.48 - 36.6) 53.6 (24.3 - 82.8) 0.014 Burning (st) V0→tE 0 5.26 (-2.52 - 13.0) 0.179 Satiety V0→tE 95.4 (63.0 - 128) 335 (250 - 420) <0.001 Pain V0→tE 0.40 (-0.20 - 0.98) 0.53 (-0.31 - 1.36) 0.800
Symptoms analysis
Concerning total summated VAS scores for both phases of the two tests, fullness and satiety represented a mere four ifths of the total (43% and 36%, respectively). Belching (8%), bloating (6%), nausea (4%), and discomfort (3%) followed, while pain and burning sensation represented <1% of the whole. The distributional pattern of symptoms evoked was similar between the two tests, as deduced from χ2 goodness of
it analysis (P>0.05). Additionally, the VL/VS ratio presented
a statistically signiicant correlation between the two tests (r = 0.391, P = 0.015). However, only SL and not SR showed
a statistically signiicant correlation between the two tests (r = 0.529, P = 0.001 and r = 0.292, P = 0.075, respectively).
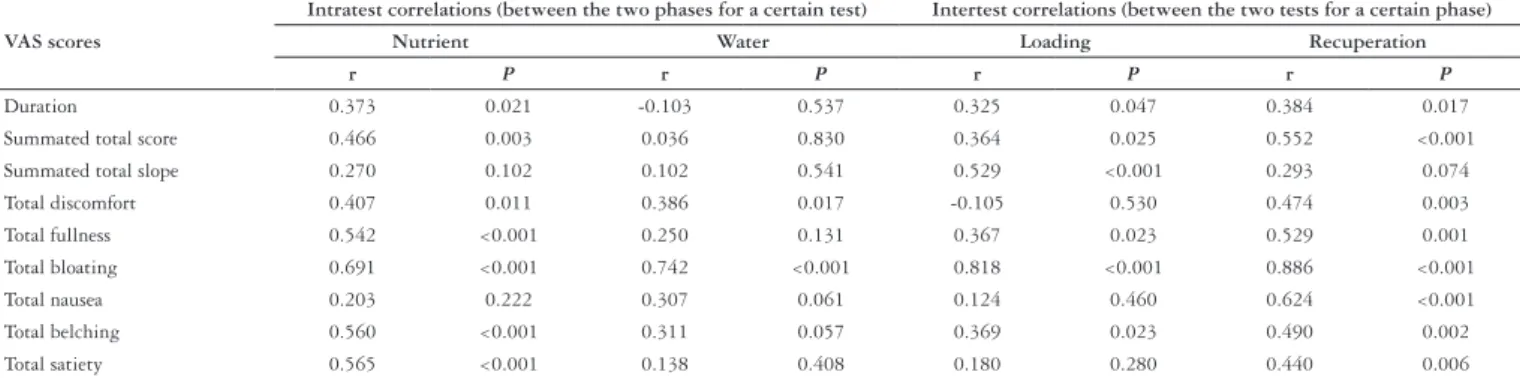
Analysis of total VAS scores per symptom, for both loading and recuperation period, is given in Table 2. The intra- (between the two phases of a test) and intertest (between the same phase of the two tests) correlations concerning VL, VR and symptom-speciic VtS→0 and V0→tE values give statistically signiicant results in the cases described in Table 3. Due to multiple testing, the level of statistical signiicance was set at the level of a = 0.0013 after application of Bonferroni correction.
When all 1,686 observations from every timepoint of both phases of the two tests are considered, satiety and fullness values are different (P<0.001) but are very well correlated
(r = 0.848, P<0.001 - Spearman R = 0.745, P<0.001).
Correlations between total and summated total VAS scores and BMI, gender and age revealed positive statistically signiicant results in the following: i) BMI and belching VtS→0 for water test (P = 0.040), and satiety VtS→0 for water test (P = 0.026),
ii) female gender and VR for water test (P = 0.009), fullness
VtS→0 for water test (P = 0.040), satiety VtS→0 for water test (P =
0.011), SR for water test (P = 0.015), and SR for nutrient test
(P = 0.027), iii) male gender and TL/TR ratio for water test (P
= 0.035), and iv) age and bloating V0→tE for nutrient test (P =
0.012), VL for water test (P = 0.037), belching VtS→0 for water
test (P = 0.022), and bloating V0→tE for water test (P = 0.009).
The above correlations have been tested with the use of a multiple regression model considering BMI, gender and age as dependent variables and all other parameters regarding duration of phases, total summated VAS scores, total summated VAS slopes and total VAS per symptom for loading and recuperation phase of both tests as independent variables. In detail, only belching VtS→0 and bloating V0→tE for
water test exhibited an independent and statistically signiicant correlation with age (P = 0.017 and 0.012, consequently). No
such correlation between any independent variable tested and gender or BMI was documented.
Stochastic analysis and test dynamics
The number of volunteers that participated at a given timepoint of each phase of the two tests is depicted in relevant Kaplan-Meier charts (Figure 1). By dividing the y-axis values by the total number of volunteers (38 in the present study), these charts could represent individualized probabilities: for the loading phase, the ability to continue the test after a given time, while for the recuperation phase, the probability of total symptoms withdrawal. Correction for BMI, gender and age through Cox-regression hazard model was not applied as multiple regression did not reveal any statistically signiicant primary correlations between the dependent variables considered (age, gender, and BMI) and TL and TR. However, the results of the performed multiple regression model would serve for Cox-regression hazard corrections in case that other independent variables (as VL, VR, and SR) with a known primary correlation with age, gender and BMI, had been considered.
FIGURE 1. Kaplan-Meier charts showing the probability of a healthy individual to be present at arbitrarily considered timepoints of the two tests. Solid line: nutrient test; Dotted line: water test
TABLE 3. Intra- and intertest correlations
VAS scores
Intratest correlations (between the two phases for a certain test) Intertest correlations (between the two tests for a certain phase)
Nutrient Water Loading Recuperation
r P r P r P r P
Duration 0.373 0.021 -0.103 0.537 0.325 0.047 0.384 0.017
Summated total score 0.466 0.003 0.036 0.830 0.364 0.025 0.552 <0.001
Summated total slope 0.270 0.102 0.102 0.541 0.529 <0.001 0.293 0.074
Total discomfort 0.407 0.011 0.386 0.017 -0.105 0.530 0.474 0.003
Total fullness 0.542 <0.001 0.250 0.131 0.367 0.023 0.529 0.001
Total bloating 0.691 <0.001 0.742 <0.001 0.818 <0.001 0.886 <0.001
Total nausea 0.203 0.222 0.307 0.061 0.124 0.460 0.624 <0.001
Total belching 0.560 <0.001 0.311 0.057 0.369 0.023 0.490 0.002
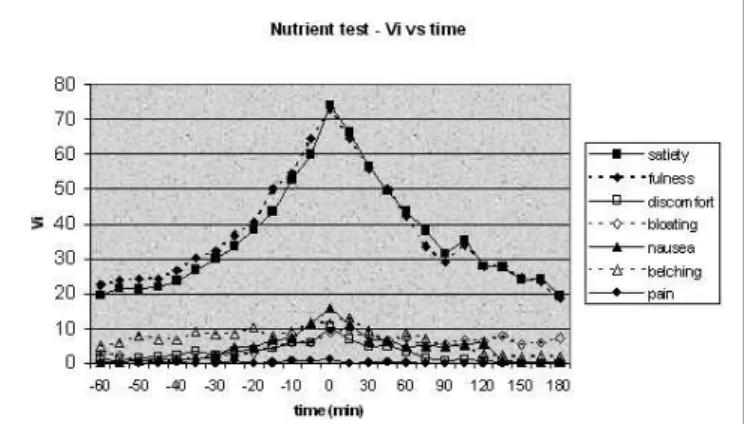
The evolution of symptoms against time produces some very interesting results, depicting in Figure 2. Satiety and fullness are characterized by almost identical curves in the case of the nutrient test; however, in the case of water test, satiety falls short. From the other symptoms, bloating is mainly expressed in water (especially during recuperation) and nausea in nutrient test.
the formula Nest(t)=N*{1/[1+(t/c)^k]}, where N is the total number of volunteers (38 in the present study), and c and k are two phase- and test- related constants. Especially for the nutrient test, k~e for both phases, where e = 2,718 is the base
of natural logarithms. Apparently, the function between the individualized probability of a certain individual being on test at a timepoint t, represented by the expected Qt, and time t, would become Qest(t)=1/[1+(t/c)^k]. The above curves are sigmoidal; this means that they are characterized by three discrete parts: an initial part, which is slow and non-linear, a middle part, which is rapid and nearly-linear, and a last part which resembles the irst but in a reverse manner. The constant c describes the peak velocity of the middle, rapid phase, corresponding to the timepoint t for which Vest(t)΄΄, which is the second derivative of Vest(t), nulliies.
Similarly, the function between the estimated VAS score of a symptom (Vest) and time (t) can be generally approached by the formula Vest(t)=V0*e^(-t/c), where V0 is the mean symptom-speciic VAS score at the maximal saturation point, c is a phase- and test- related constant, and e = 2,718 is the base of
natural logarithms. These curves are exponential. VAS slope, as a measure of the rapidity of the VAS score alteration, at a given timepoint t (St), can be approached mathematically by computing Vest(t)΄, which is the irst derivative of Vest(t).
Values of constants are given at Table 4.
DISCUSSION
The present work describes the drinking behavior and the symptoms induced from both water and nutrient drink tests in normal individuals by performing paired comparisons in a group of healthy volunteers. Apart from the coniguration of the two tests, based on pragmatic data,
FIGURE 2. Test dynamics: line chart depicting the VAS scores (Vi) values against time for each test
Stochastical models were created with the use of the SlideWritePlus software based on the present study data to describe the above mentioned parameters. The relevant equations were supposed to follow two criteria: the best it curve, as described by the nearest to 1 adjusted r2 value, and
the maximal simplicity.
The function between the estimated number of participating volunteers (Nest) and time (t) can be generally approached by
TABLE 4. Stochastical approach of Nest and Vest values
Parameter Equation c value k value adjusted r2
Water test - loading phase
Q in water loading Qest(t)=1/[1+(t/c)^k] -11.0 ± 0.1 4.1 ± 0.1 0.998 Fullness V in water loading Vest(t)=V0*e^(-t/c) -5.6 ± 0.3 NA 0.997 Satiety V in water loading Vest(t)=V0*e^(-t/c) -3.7 ± 0.2 NA 0.996 Bloating V in water loading Vest(t)=V0*e^(-t/c) -5.3 ± 1.1 NA 0.958 Water test – recuperation phase
Q in water recuperation Qest(t)=1/[1+(t/c)^k] 78.6 ± 1.0 5.2 ± 0.3 0.990 Fullness V in water recuperation Vest(t)=V0*e^(-t/c) 3.5 ± 0.3 NA 0.993 Satiety V in water recuperation Vest(t)=V0*e^(-t/c) 33.9 ± 2.3 NA 0.995 Bloating V in water recuperation Vest(t)=V0*e^(-t/c) 25.4 ± 4.2 NA 0.970 Nutrient test - loading phase
Q in nutrient loading Qest(t)=1/[1+(t/c)^k] -74.4 ± 1.5 2.7 ± 0.1 0.991 Fullness V in nutrient loading Vest(t)=V0*e^(-t/c) -42.8 ± 4.0 NA 0.991 Satiety V in nutrient loading Vest(t)=V0*e^(-t/c) -38.3 ± 3.8 NA 0.989 Nausea V in nutrient loading Vest(t)=V0*e^(-t/c) -16.1 ± 1.7 NA 0.988 Nutrient test – recuperation phase
Q in nutrient recuperation Qest(t)=1/[1+(t/c)^k] 115.8 ± 2.4 2.6 ± 0.1 0.992 Fullness V in nutrient recuperation Vest(t)=V0*e^(-t/c) 128.4 ± 13.8 NA 0.988 Satiety V in nutrient recuperation Vest(t)=V0*e^(-t/c) 130.9 ± 12.0 NA 0.993 Nausea V in nutrient recuperation Vest(t)=V0*e^(-t/c) 6.6 ± 2.2 NA 0.899
a stochastic approach is attempted in order to provide mathematical models with prognostic value for both normogram extrapolation and individualized assessment. Furthermore, the description of gastric response to water and nutrient intake with the use of mathematical terms, proved to be a useful method of simulating the relevant aspects of gastric physiology.
As far as the mean ingested volume of the water test is concerned, the results of the present study (1155 ± 164 mL)
merely coincide to that referred in the study of JONES et al.(5) (1128 ± 164 mL), yielding to a P = 0.842. Despite that
individuals of the present study were younger (P<0.001), the
above agreement might serve as an internal quality control of the whole procedure.
As far as the mean ingested volume of the nutrient test is concerned, differences regarding the rate of ingestion (5 min ad libitum) and the nutrient composition (less caloric potential due to lower fat concentration) in the study of JONES et al.(5) do not allow a direct comparison.
Interestingly, the 5-minute ad libitum rapid nutrient test adopted by Jones, might well underestimate the effect of gastric accommodation, as this procedure unfolds after the irst 15 minutes following ingestion(12). In contrast, TACK
et al.(13), introducing the technique followed in the present
study, found a mean ingested volume of 1005 ± 69 mL (P =
0.029 when compared to our data). The observed discrepancy might be explained by ethnic-related differences and has to be further validated.
Both tests lead to ingestion of similar volumes of liquid and induce similar patterns of symptoms; however, the intensity, the rapidity, and the duration of the induced symptoms vary between both phases and tests. Satiety is more prevalent and intense in nutrient rather than in water test, while the opposite is true for fullness and bloating. Generally speaking, there is a remarkable cohesion between satiety and fullness, especially as far as the nutrient test is concerned (Figure 2). Therefore, it has to be clariied whether these two entities should be considered and used as different.
Pain and burning sensation (both epigastric and thoracic) are practically absent, as their 95% conidence limits cross zero. Additionally, no volunteer attributed the cessation of the loading phase to pain or burning sensation. These observations suggest that the induction of pain or burning sensation during either water or nutrient test is not an expected phenomenon in a normal individual.
According to the present study, BMI is not correlated with summated and total summated VAS scores, VAS slopes, duration of phases and the relevant ratios. Other previously published studies show similar results regarding the maximal saturation parameters of the nutrient test(13) and the rapid
(5 min ad libitum) water test(5). However, data concerning
recuperation phase are lacking, although there is evidence that obesity does not inluence gastric emptying of liquids(10, 15).
In addition, a statistically signiicant correlation has been documented between the water and nutrient ingested volumes, as well as between the recuperation times regarding the two
drink tests. This might at irst suggest that the drinking behavior patterns of a normal individual concerning water and nutrient are correlated. However, the observed differences in the intensity, rapidity, and duration of the induced symptoms between both phases and tests suggest their different nature. As mentioned before, gastric accommodation is expected only in the nutrient drink test(12).
One of the major contributions of the present study is the stochastic analysis. This approach used deterministic data to simulate the studied phenomena through a number of simple mathematical models (Table 4). Thus, the estimated probability of a healthy individual to be on test at t is given by the function Qest(t)=1/[1+(t/c)^k] and the estimated VAS score for the main symptoms at t by Vest(t)=V0*e^(-t/c). The irst equation is a measure of the rapidity of the gastric response to liquid ingestion. As deduced from k values, which represent the exponent of the curve, water in general induces quicker responses than nutrient. In addition to that, loading phase is quicker in water than recuperation; this difference is not observed in nutrient, where the two phases share comparable k. Furthermore, the constant c (corresponding to T1/2 in exponential curves and to peak slope in sigmoidal curves) is a measure of the duration of the phenomenon. Consequently, estimations concerning the order of symptoms induction and vanishing can be made.
The above observations help in the understanding of the physiology of drinking behavior. Furthermore, the documentation of “normal” values regarding the ingested volumes, the duration of the recuperation phase, and the pattern of induced symptoms, might help to more eficiently describe patients with altered drinking capacity, as these suffering from dyspepsia(2, 14).
A limitation of this study might be that it is ethnic-speciic, despite that Caucasians represent a common population worldwide. Thus, validation studies concerning other populations would be desirable and should be introduced in the future. However, the strong advantage of the study was the opportunity for paired comparisons, as all volunteers underwent both tests with an interval of 7-10 days.
In conclusion, the comparative standardization of both drink tests in normal individuals might provide a tool for clinical application, targeting the diagnosis and treatment of relevant functional disorders. Further clinical studies, focusing mainly on patients with dyspepsia, might validate the clinical usefulness of the present study.
ACKNOWLEDGEMENTS
The authors would like to express their gratitude to all medical students who volunteered to participate in the present study. Nothing would have been possible without their contribution.
COMPETING INTERESTS
Papadopoulos V, Fragaki M, Mimidis K. Teste de bebidas: comparação entre água e solução de nutrientes em voluntários sadios. Arq Gastroenterol. 2009;46(4):304-10.
RESUMO - Contexto - Os testes de bebidas se constituem em meios baratos e não-invasivos propostos para distinguir diferenças de volume ingeridos por indivíduos, como os dispépticos, por exemplo. Entretanto, seu uso na prática clínica ainda é limitado pela falta de parâmetros lineares. Objetivos - Realizar comparação entre ingestão de água e solução de nutrientes em voluntários, utilizando-se o teste de bebidas e escala analógica visual. Métodos - Trinta e oito voluntários (19 homens, 19 mulheres, com média de idade: 24,4 ± 0,4 anos) submeteram-se a teste de bebidas com água e Nutridrink, em intervalo de 7 a 10 dias. Ambos os testes incluíram a fase de ingestão (consumo de 100 mL/min para água e 15 mL/min para o Nutridrink, pelo maior tempo possível), e pela fase de recuperação (observação após o término da ingestão), separados pelo máximo ponto de saturação. Durante as fases observou-se a saciedade, a plenitude, o desconforto, a eructação, os borborigmos, a náusea, a queimação epigástrica ou torácica e a dor, que foram anotadas utilizando-se um escore de escala analógica visual (EAV) variando entre 0-100. Para este propósito quatro variáveis foram consideradas: tempo (T), escore EAV (V), e curva EAV (S), para o período de tempo e a probabilidade de participação a um tempo determinado (Q). Resultados: O tempo de ingestão durou 11,6 ± 1,7 min para a água (total EAV: 879 ±123, total S: 72,6 ± 10,9 min-1) e 93,3 ± 18,4 min para o Nutridrink (total
EAV: 1462 ± 411, total S: 15,9 ± 3,2 min-1); P<0.001. O volume médio ingerido foi de 1155 ± 164 mL para água e 1399 ± 276 mL para o nutriente;
P = 0.076. A parada de ingestão do líquido foi atribuída à sensação de plenitude em 76,3% para a água e a saciedade em 69,2% para o Nutridrink. Náusea foi relatada em 15,4% somente para o teste de nutriente. Nenhum voluntário reportou dor substancial persistente ou sensação de queimação. A fase de recuperação durou 63,6 ± 7,8 min para a água (total EAV: 278 ± 75, total S 3,97 ± 0,95 min-1) e para o nutriente 123,2 ± 17,5 min (total EAV:
841 ± 126, total S: 6,81 ± 1,63 min-1); P<0.001. Considerando-se o escore total EAV para ambas as fases dos dois testes, a plenitude e a saciedade
representaram 4/5 do total (43% e 36%, respectivamente). Eructação (8%), borborigmos (6%), náusea (4%) e desconforto (3%) seguiram-se, enquanto dor e queimação representaram menos de 1% do total. Entretanto, correlações compreendendo o escore total e de sintomas especíicos intra e entre testes, revelaram diferenças estatísticas subjacentes signiicativas na isiologia da ingestão líquida. Modelo de regressão considerando índice de massa corporal, sexo e idade como variáveis dependentes e escores total e de sintomas especíicos, e curvas para ambas as fases do dois testes como variáveis independentes, não revelaram qualquer correlação primaria. A função que estabelece a ligação da probabilidade de participação Q e o escore de sintoma especiico EAV como tempo t é feito pelas fórmulas Q(t)=1/[1+(t/c)^k] e V(t)=Vo*e^(-t/c), respectivamente. Vo é a média do escore sintoma especíico; c e k são fase- e teste- constantes relacionadas, e e = 2,718 é base natural logarítimica. Conclusões - A padronização comparativa de ambos os testes de bebidas pode produzir uma ferramenta clínica útil, objetivando o diagnóstico e o tratamento de eventuais distúrbios funcionais.
DESCRITORES – Ingestão de água, isiologia. Água potável. Processos estocásticos.
REFERENCES
1. Boeckxstaens GE, Hirsch DP, Van den Elzen BD, Heisterkamp SH, Tytgat GN. Impaired drinking capacity in patients with functional dyspepsia: relationship with proximal stomach function. Gastroenterology. 2001;121:1054-63. 2. Boeckxstaens GE, Hirsch DP, Kuiken SD, Heisterkamp SH, Tytgat GN. The
proximal stomach and postprandial symptoms in functional dyspeptics. Am J Gastroenterol. 2002;97:40-8.
3. Hjelland IE, Ofstad AP, Narvestad JK, Berstad A, Hausken T. Drink tests in functional dyspepsia: which drink is best? Scand J Gastroenetrol. 2004;39:933-7. 4. Jones M, Shah D, Ebert CC. Effects of rabeprazole sodium on gastric emptying,
electrogastrography, and fullness. Dig Dis Sci. 2003;48:69-73.
5. Jones MP, Hoffman S, Shah D, Patel K, Ebert CC. The water load test: observations from healthy controls and patients with functional dyspepsia. Am J Physiol Gastrointest Liver Physiol. 2003;284:g896-g904.
6. Jones MP, Roth LM, Crowell MD. Symptom reporting by functional dyspeptics during the water load drink test. Am J Gastroenterol. 2005;100:1334-9. 7. Jones MP. Satiety testing: Ready for the clinic? World J Gastroenterol
2008;14:5371-5376.
8. Marzio L, Falcucci M, Grossi L, Ciccaglione FA, Malatesta MG, Castellano A, Ballone E. Proximal and distal gastric distention in normal subjects and H.
pylori-positive and -negative dyspeptic patients and correlation with symptoms. Dig Dis Sci. 1998;43:2757-63.
9. Mimidis K. Drinking tests in functional dyspepsia: what do they really measure? Neurogastroenterol Motil. 2007;19:947-50.
10. Park MI, Camilleri M. Gastric motor and sensory functions in obesity. Obes Res. 2005;13:491-500.
11. Tack J, Piessevaux H, Coulie B, Caenepeel P, Janssens J. Role of impaired gastric accommodation to a meal in functional dyspepsia. Gastroenterology. 1998;115:1346-52.
12. Tack J. Drink tests in functional dyspepsia. Gastroenterology. 2002;122:2093-4. 13. Tack J, Caenepeel P, Piessevaux H, Cuomo R, Janssens J. Assessment of meal induced gastric accommodation by a satiety drinking test in health and in severe functional dyspepsia. Gut. 2003;52:1271-7.
14. Van den Elzen BD, Bennink RJ, Holman R, Tytgat GN, Boeckxstaens GE. Impaired drinking capacity in patients with functional dyspepsia: intragastric distribution and distal stomach volume. Neurogastroenterol Motil. 2007;19:968-76. 15. Vazquez Roque MI, Camilleri M, Stephens DA, Jensen MD, Burton DD, Baxter
KL, Zinsmeister AR. Gastric sensorimotor functions and hormone proile in normal weight, overweight, and obese people. Gastroenterology. 2006;131:1717-24.