FORAGING BEHAVIOR OF BEE POLLINATORS ON THE
TROPICAL WEED
Triumfetta semitriloba
: FLIGHT DISTANCE
AND DIRECTIONALITY
COLLEVATTI, R. G.,1
SCHOEREDER, J. H.2
and CAMPOS, L. A. O.2
Departamento de Biologia Animal, Universidade Federal de Viçosa,
CEP 36571-000, Viçosa, MG, Brazil
Departamento de Biologia Geral, Universidade Federal de Viçosa, CEP 36571-000, Viçosa, MG, Brazil
Correspondence to: Rosane G. Collevatti, Departamento de Ecologia, Universidade de Brasília, CEP 70910-900, Brasília, DF, Brazil, e-mail: [email protected]
Received November 9, 1998 Accepted December 10, 1998 Distributed February 28, 2000
(With 3 figures)
ABSTRACT
We studied flight distance and directionality of bee pollinators on the tropical shrub weed Triumfetta semitriloba Jacq. (Tiliaceae), addressing (1) within- and between-plant movement pattern; (2) dis-tances flown between plants; (3) flight directionality. Flowering plants were distributed in well-delimited clumps, in each of two pasture areas (A1 and A2) and one area of forest gap (A3), in Viçosa, southeastern Brazil. Five solitary bee species, Augochlorella michaelis, Augochloropsis cupreola, Pseudocentron paulistana, Ceratinula sp., Melissodes sexcincta, and two social bee, Plebeia droryana, P. cf. nigriceps were observed. All species moved mainly to the nearest flower on the same individual plant and, in between-plant movements, to the first or second nearest neighbor. All species moved non-randomly, presenting a flight directionality in departures (maintenance of flight direction), but with a high frequency of turn angles. It is suggested that this foraging behavior pattern occurred because of the resource quantity and quality (pollen or nectar), and environmental characteristics such as flower density and resource distribution.
Key words: foraging behaviour, directionality, pollination, flight distance, solitary bees.
RESUMO
Comportamento de forrageamento das abelhas polinizadoras da planta invasora Triumfetta semitriloba: distância de vôo e direcionalidade
Estudamos a distância de vôo e a direcionalidade de abelhas polinizadoras da planta invasora Triumfetta semitriloba Jacq. (Tiliaceae), sobre os seguintes aspectos: (1) padrão de movimentação dentro e entre plantas; (2) distância de vôo entre plantas; (3) direcionalidade de vôo. As plantas floridas eram distribuídas em manchas bem delimitadas, em duas áreas de pasto (A1 e A2) e uma área de clareira de mata (A3), em Viçosa, MG, Sudeste do Brasil. Foram observadas cinco espécies de abelhas solitárias, Augochlorella michaelis, Augochloropsis cupreola, Pseudocentron paulistana, Ceratinula sp., Me-lissodes sexcincta e duas espécies sociais, Plebeia droryana, P. cf. nigriceps. Todas as espécies moveram principalmente para a flor mais próxima, dentro da mesma planta e, nos movimentos entre plantas, para o primeiro ou segundo vizinho mais próximo. Todas as espécies apresentaram uma direcionalidade no padrão de vôo, ou seja, uma movimentação não aleatória, mas com uma alta freqüência de ângulos laterais. Sugere-se que esse padrão de comportamento de forrageamento ocorreu devido à qualidade e quantidade de recurso (pólen ou néctar) e às características ambientais como a densidade de flores e distribuição do recurso nas manchas.
INTRODUCTION
By their foraging behavior pollinators may mold plant evolution (Levin et al., 1971; Levin, 1978). Gene flow by pollen is determined mainly by pollinators flight patterns, hence flight distances and directionality may have an important effect on the reproductive structure of plant species and on the organization of within- and between-population genetic variability. On the other hand, pollinator behavior is influenced by the spatial structure of plant populations and by the pattern of resource distribution (Handel, 1983).
Many studies have examined the relationship between flower distribution and density, and fora-ging strategies of bee pollinators, such as flight directionality and distances flown between plants, and the importance of pollinator foraging behavior and plant population characteristics for each others evolution (e.g. Waser, 1982; Zimmerman, 1982a,b; Schmid-Hempel, 1984, 1985, 1986; Galen & Plowright, 1985; Ginsberg, 1986).
The maintenance of flight direction (di-rectionality) by bee pollinators the tendency to fly straight ahead from one flower to another may decrease the risk of revisiting flowers that were previously emptied. This pattern may have arisen from rules of thumb that maximize foraging efficiency (Pyke, 1984; Stephens & Krebs, 1986). However, in an environment where resources are patchily distributed, this directionality may reduce foraging success since the foraging animal can miss patches of high quality (Pyke, 1978; Zimmerman, 1979, 1982b). This could be counteracted by an area restrict searching strategy, in which the frequency of turning increases when the foraging animal finds a hot spot flower a flower with high quantity or quality resource (Pyke, 1984; Stephens & Krebs, 1986).
In a single plant species patch, bees usually move to nearest neighbor inflorescence (Levin et al., 1971; Zimmerman, 1979). This behavior can be modified according to the rewards found in the current flower, resource distribution and variability, intrinsic factors as metabolic requirements or other factors (Heinrich, 1981; Schmitt, 1983a,b; Waser, 1982; Galen & Plowright, 1985; Ginsberg, 1986; Hill, et al., 1997).
Bee pollinator behavior has been intensively studied in temperate regions, mainly with social
bee species, especially with Bombus species and Apis mellifera (e.g. Pyke, 1978; Wells & Wells, 1986; Zimmerman, 1979, 1982b; Hill et al., 1997; Rasheed & Harder, 1997). The foraging behavior of tropical solitary bee species has been neglected, in spite of their great diversity (Roubik, 1989). This work aimed to analyze and compare three aspects of the foraging behavior of seven bee species that forage on Triumfetta semitriloba Jacq. (Tiliaceae) flowers: (1) within- and between-plant movement patterns; (2) flight directionality; (3) flight distances between plants; with regards to species natural history, and environmental cha-racteristics, such as resource distribution and availability.
MATERIAL AND METHODS
Species description and study site
Triumfetta semitriloba is a facultatively autogamous shrub weed species, locally distributed in well-delimited clumps in abandoned pastures, secondary forest gaps and roadsides in tropical America. In Viçosa, southeastern Brazil, flowering season occurs in autumn (March to May), and flowers open in the afternoon. Flowering phenology approaches a modified steady-state pattern, with many flowers per plant opening every day during all flowering season (Collevatti, 1998). Despite the existence of five floral nectaries around the ovary base, nectar secretion rate is negligible and pollinators visited the flowers mainly for pollen collection. However, many small bees and other insects visit the flowers eventually for nectar collection. Flower visitors are mainly solitary bee species, although social bees, beetles, flies, bugs and butterflies have also been recorded (Collevatti, 1998).
Five solitary bee species and two social bee species were studied (Table 1), which are the main pollinators of T. semitriloba in the studied areas. Field work was conducted in three areas (Table 2) in Viçosa (MG), southeastern Brazil (20o
45S, 42o
50W), during the flowering season of 1994 (March, April and May).
Experimental design
All flowering individual plants of T. semi-triloba in each area were marked and numbered. Individual flowering plants were considered as discrete patches of flowers and clumps of plants as sites (A1, A2 and A3). Each area was surveyed for two days a week during the entire flowering season. The focal method of surveying was used to observe bees (Martin & Bateson, 1986). Each individual was observed for three minutes or until it was lost by the observer. The departure angle from each visited flower was recorded, to the nearest 45o
interval. The departure angle from a flower was considered as the departure direction of a bee, rela-tive to the arrival direction at that flower, and ranges from 180º to +180º, with 0º indicating a straight ahead movement (Zimmerman, 1982b). Departure movements were characterized as following: (1) movement to the nearest flower of the same plant; (2) movement to any other flower of the same plant, except the nearest; (3) movement to a flower of another plant. In inter-plant movements, the distance between plants was recorded.
Data analysis
The frequency distribution of movements within- and between-plant, for each bee species, was analyzed using a Kolmogorov-Smirnov one-sample test for uniform distribution (Zar, 1974). Flight directionality was analyzed by a χ2
comparison of observed frequency distribution of departure angles from visited flowers and a random distribution of circular data (Zar, 1974).
The frequency distribution of between-plant flight distance was compared with a random distribution using a Kolmogorov-Smirnov test, and with the frequency distribution of distances between the first and second nearest neighbor plants, for each patch (Kolmogorov-Smirnov two-sample test).
RESULTS
Movement pattern
Frequency distributions of within- and between-plant movements were not uniform (p < 0.001, for all species). All species showed a
Species/Famil Are Mean body size
(cm) SD N
Augochlorella michaelis (Vachall), Halictidae A3 1.8 0.16 10
Augochloropsis cupreola (Ckll), Halictidae A1/A2 1.9 0.17 15
Ceratinula sp. (Moure, unpublished), Anthophoridae A3 1.0 0.14 10
Melissodes sexcinta (Lepeletier), Anthophoridae A1/A2 2.7 0.25 15
Pseudocentron paulistana (Schrottky), Megachilidae A1/A2 2.8 0.20 15
Plebeia droryana (Friese), Apidae A2 0.9 0.14 15
Plebeia cf nigriceps (Friese), Apidae A3 0.9 0.16 15
TABLE 1
Body size of T. semitriloba bee pollinators, which behavior was studied in this work. Area indicates where the species were observed and N the number of individuals collected to measure body size.
TABLE 2
Characteristics of the studied areas in Viçosa, southeastern Brazil. A1 and A2 were square areas of pasture and A3, localized in a forest gap, was composed of two parallel lines of individual plants, like a very narrow rectangle. Flower patch density was calculated as number of flowering plants/m; mean number of flowers per patch was calculated as mean number of opened flower per plant, pooling all days (in Collevatti, 1998).
Area Size ( ) Flower patch density Mean number of flowers per patch
Standard deviation
A1 200 0.425 21.505 13.659
A2 100 0.300 48.180 44.412
A3 200 0.125 2.250 4.879
tendency to move mainly to another flower of the same individual (Table 3). Plebeia cf. nigriceps did not move to another plant, even after 3 min of observation.
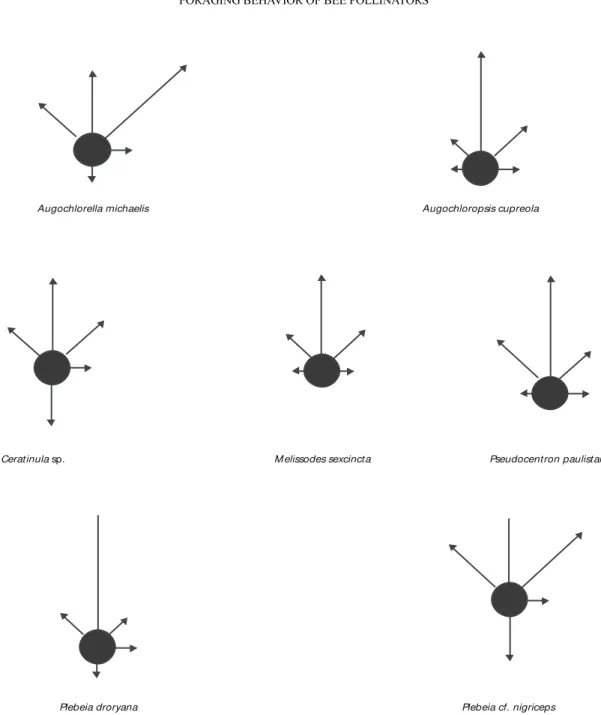
Flight direction pattern
All species presented a non-random frequency distribution of flight direction, and maintained the flight directionality (a higher frequency of 0º), but
with high frequency of lateral movements of 45º and 45º (A. cupreola, n = 148, df = 8, χ2 = 216.669, p < 0.001; A. michaelis, n = 34, df = 8, χ2 = 38.42, p < 0.001; Ceratinula sp., n = 44, df = 8, χ2 = 41.62, p < 0.001; M. sexcincta, n = 242, df = 8, χ2 = 248.396, p < 0.001; P. paulistana, n = 73, df = 8,
χ2
= 110.21, p = 0.079; P. droryana, n = 56, df = 8, χ2 = 95.2, p < 0.001; P. cf. nigriceps, n = 60, df = 8, χ2 = 45.75, p = 0.001; Fig. 1).
Within-plant
Nearest flower Other flowers Between-plant Species Ni
% n sd % n sd % n sd
A. michaelis 9 66.9 23 18.6 17.0 6 13.2 16.0 5 15.8
A. cupreola 23 70.6 112 19.2 9.4 13 10.4 19.9 24 14.3
Ceratinula sp. 13 72.5 33 27.1 18.1 8 15.7 9.2 4 14.7
M. sexcincta 44 65.4 171 23.9 9.6 19 14.9 24.9 56 15.8
P. paulistana 13 56.9 44 20.4 26.8 15 20.9 19.8 15 8.2
P. droryana 11 80.3 46 15.0 11.3 6 11.2 8.5 4 12.3
P. nigriceps 17 76.5 41 43.7 23.5 4 43.7 0
TABLE 3
Within- and between-plant movement patterns. (Ni) total number of individuals observed, (%) total percentage of movements, (n) number of observed movements to nearest or other flowers of the same plant
or to another plant, (sd) standard deviation.
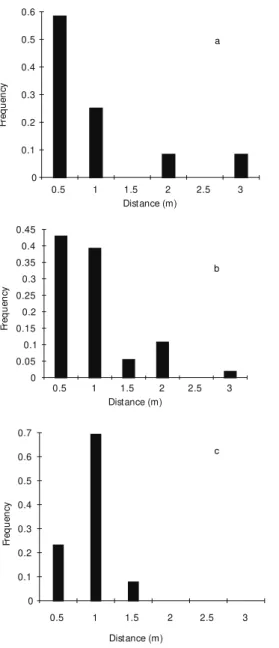
Flight distance pattern
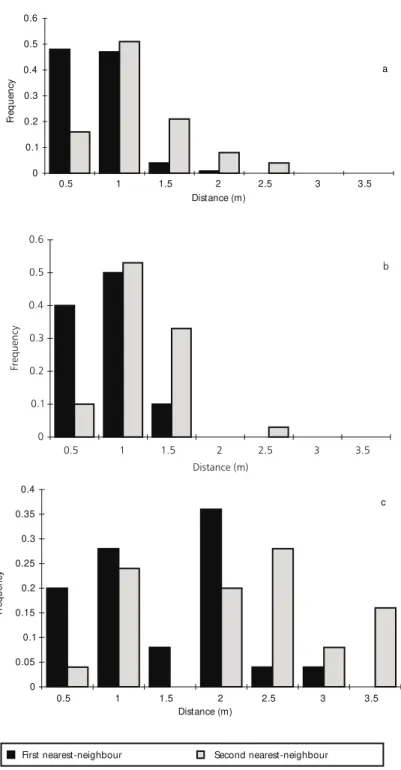
Augochloropsis cupreola, M. sexcincta and P. paulistana showed a non-random distribution of distances in movements between plants (N = 24, d.f. = 5, maximum diference = 0.937; N = 56, d.f. = 5, maxdif = 0.974, p < 0.001; N = 15, d.f. = 2, maxdif = 0.913, p < 0.001, respectively; Fig. 2). These species moved mainly to the first and second nearest-neighbor, 0.5 and 1.0 m distant (Fig. 3). The frequency distribution of distances flown between plants did not differ from frequency distribution of distances from the first and second nearest-neighbor plants, for area A1 and A2 (d.f. = 5, p > 0.10, for all comparisons).
Augochlorella michaelis moved to a flower on another plant only five times (Table 3), so a
χ2
test was not possible. Four times the departure was to a plant 2,0 m distant and one time to a plant 1,0 m distant. Only four between-plant movements
were observed for Ceratinula sp., all of them to a 2,0 m distant plant. For P. droryana, between-plant movements were always to distances less than 0,5 m.
DISCUSSION
Patch shape and distribution of individual plants and flowers in the patch may modify this risk and influence departure angles and distances flown between plants and flowers (Pyke, 1978; Heinrich, 1981; Waddington, 1980; Ginsberg, 1986). In our study, difference between patches and thus, in departure angles were expected. The
probability of revisiting flowers in A1 and A2 is low, since these areas are square or have a high density of flowers. Hence, we expected that a random flight movement would be the best strategy for these areas. On the other hand, in A3, indi-vidual plants were distributed along two parallel lines, as a narrow rectangle.
Plebeia droryana Plebeia cf. nigriceps
Ceratinulasp. M elissodes sexcincta Pseudocentron paulistana
Augochlorella michaelis Augochloropsis cupreola
Flower density in patch and number of flowers per plant were lower than on A1 and A2, leading to a higher probability of revisiting. For A3, we expected maintenance of flight directionality as the best strategy. However, bee pollinators of T. semitriloba showed directionality but with a high frequency of lateral angles, and were probably using an area restricted searching foraging strategy. To verify this foraging behavior it would be necessary
to know the amount of resource in the visited flower, when the frequency of turns was higher.
Flowering pattern, resource property and presentation could explain the observed foraging strategy. Bee pollinators visited T. semitriloba flowers mainly for pollen, a resource that, unlike nectar, is not renewed. Flowers open sequentially and the number of flowers per individual plant increases until 16 h.
Fig. 2— Frequency distribution of distances flown between plants, in classes of 0.5 m, for: (a) A.cupreola, (b) M.sexcincta, (c) P.paulistana.
Distance (m)
Fr
e
q
u
e
n
cy
0 0.1 0.2 0.3 0.4 0.5 0.6
0.5 1 1.5 2 2.5 3
a
Distance (m)
Fr
e
q
u
e
n
cy
0 0.05 0.1 0.15 0.2 0.25 0.3 0.35 0.4 0.45
0.5 1 1.5 2 2.5 3
b
Distance (m)
Fr
e
q
u
e
n
cy
0 0.1 0.2 0.3 0.4 0.5 0.6 0.7
0.5 1 1.5 2 2.5 3
As flowers opened pollen-collecting bees depleted pollen resource with a low number of visits, as flower availability is low (Collevatti, 1998). As described by Collevatti (1998), flower opening pattern (sequential) and depletion of pollen
by bee pollinators visiting may cause a patchy distribution of resource, with hot spots of just-opened or non-visited flowers, with high level of pollen, and cold spots of already-visited flowers, with little or no pollen. This pattern of resource
Fig. 3— Frequency distribution of the first and second nearest neighbor plant, for: (a) A1, (b) A2, (c) A3.
Distance (m)
Fr
e
q
u
e
n
cy
0 0.1 0.2 0.3 0.4 0.5 0.6
0.5 1 1.5 2 2.5 3 3.5
a
Frequency
Distance (m) 0
0.1 0.2 0.3 0.4 0.5 0.6
0.5 1 1.5 2 2.5 3 3.5
b
Fr
e
q
u
e
n
cy
Distance (m) 0
0.05 0.1 0.15 0.2 0.25 0.3 0.35 0.4
0.5 1 1.5 2 2.5 3 3.5
First nearest-neighbour Second nearest-neighbour
presentation may increase the risk of revisitation. Thus, the maintenance of directionality, with high frequency of turning associated with an encounter of a hot spot, may be the best strategy for all patches.
Bee species of larger body size, such as M. sexcincta and P. paulistana (Table 1) could assess pollen resource quantity in flowers, by flying above flowers for a few seconds, landing only on flowers with higher pollen level (Collevatti, 1997). Therefore, these bee species are capable of recognizing and avoiding depleted flowers, minimizing the risk of revisitation (Zimmerman, 1982b).
Plebeia droryana and P. cf. nigriceps, so-cial bee species with group foraging behavior, must be considered separately. Pollen resource level in adequate flowers for these bees may be lower than for solitary and large bees, such as M. sexcincta and P. paulistana. Thus, revisiting was more fre-quent for these two species than for other species (Collevatti, 1997). The same occurred for Ceratinula sp., with solitary foraging behavior. These three species were the smallest bee pollinators of T. semitriloba (Table 1). It was observed that these bees did not empty anthers in one visit, as did M. sexcincta and P. paulistana (Collevatti, 1997).
In spite of differences among patches, all bee species moved mainly to a flower within-plant and to the nearest flower. Between-plant movements were mainly to the first and second nearest neighbor. These results indicate that the tendency to fly short distances may be more correlated with patch characteristics and resource property than with intrinsic factors. Although foraging behavior for non-energetic resource, such as pollen, do not differ qualitatively from foraging for energetic resource, such as nectar (Rasheed & Harder, 1997), bees collecting pollen should move shorter distances than bees collecting nectar, due to energetic constraint (Heinrich, 1981; Zimmerman, 1982b). Additionally, bee pollinators with high metabolic requirements, such as bumblebees and carpenter bees, should fly longer distances than small species with low metabolic requirements (Heinrich, 1981). Our results did not corroborate this hypothesis. The smallest bee species (Ceratinula sp., P. droryana and P. cf. nigriceps) presented the same behavior as the largest (M. sexcincta and P. paulistana), as found by Waser (1982).
The observed foraging behavior of bee pollinators on T. semitriloba flowers may have an important effect on plant reproductive structure and genetic variability organization within and between populations (Levin et al., 1971; Levin, 1978). In larger patches, distance flown between plants may be density dependent (Waddington, 1980; Heinrich, 1981; Schmitt, 1983a). Although pollinator flight distance between consecutively visited plants does not show exactly the pattern of gene flow, as carrying-over distance and gene flow by seeds could be greater and vary between pollinator species, a high number of visited flowers in the same plant will, generally, result in small distance of pollen carry-over (Levin, 1978; Handel, 1983; Schmitt, 1983a,b; Rasmussen & Brodsgaard, 1992; Westerbergh & Saura, 1994). Thus, gene flow by pollen for T. semitriloba, inferred by pollinators flight behavior, may be restricted and genetic neighborhood (Wright, 1940) may include just nearest neighbors.
AcknowledgmentsThis study is part of the MSc. Thesis
of the first author, and was supported by the Universidade Federal de Viçosa and a grant from CAPES, whose assistance we gratefully acknowledge. We wish to thanks Dr. J. M. Camargo for bee species identification; Dr. F. S. Lopes, Dr= M. E. C. Amaral and Dr. A. F. da Silva for suggestions; M. C. Vieira for field and laboratory assistance.
REFERENCES
COLLEVATTI, R. G., 1997, Foraging behaviour of bee polli-nators on the tropical weed Triumfettasemitriloba: departure rules from flower patches. Insectes Soc., 44: 345-352. COLLEVATTI, R. G., 1998, Pollination ecology of the
tropi-cal weed Triumfettasemitriloba Jacq. (Tiliaceae), in the south-eastern Brazil. Rev. Brasil. Biol., 58: 383-392. GALEN, C. & PLOWRIGHT, R. C., 1985, The effect of
nectar level and flower development on pollen carry-over in inflorescences of fireweed (Epilobiumangustifolium) (Onagraceae). Can. J. Bot., 63: 488-491
GINSBERG, H., 1986, Honey bee orientation behavior and the influence of flower distribution on foraging move-ments. Ecol. Entomol., 11: 173-179
HANDEL, S. N., 1983, Pollination ecology, plant popula-tion structure and gene flow. In: L. Real (ed.), Pollina-tion biology. Academic Press, Orlando, pp. 163-212. HEINRICH, B., 1981, The energetics of pollination. Ann.
Missouri Bot. Gard., 68: 370-378.
KREBS, J. R. & MCCLEERY, R. H., 1984, Optimization in behavioural ecology. In: J. R. Krebs & N. B. Davies (eds.), Behavioural ecology: an evolutionary approach, 2a ed., Blackwell Scientific Publ., Oxford, pp. 91-121. LEVIN, D. A., 1978, Pollinator behavior and the breeding structure of plant populations. In: A. J. Richards(ed.),
The pollination of flowers by insects. Academic Press, London, pp. 133-150.
LEVIN, D. A., KERSTER, H. W. & NIEDZLEK, M., 1971, Pollinator flight directionality and its effects on pollen flow. Evolution, 25: 113-118.
MARTIN, P. & BATESON, P., 1986, Measuring behavior: an introductory guide. Cambridge University Press, Cam-bridge.
PYKE, G. H., 1978, Optimal foraging in bumblebees and coevolution with their plants. Oecologia, 36: 281-293. PYKE, G. H., 1984, Optimal foraging theory: a critical
re-view. Ann. Rev. Ecol. Syst., 15: 523-575.
RASHEED, S. A. & HARDER, L. D., 1997, Foraging for non-energetic resources: pollen collection by bumble-bees. Anim. Behav., 54: 911-926.
RASMUSSEN, I. R. & BRODSGAARD, B., 1992, Gene flow inferred from seed dispersal and pollinator behavior com-pared to DNA analysis of restriction site variation in a patchy population of Lotuscorniculatus L. Oecologia, 89: 277-283.
ROUBIK, D. W., 1989, Ecology and natural history of tropi-cal bees. Cambridge University Press, New York. SCHMID-HEMPEL, P., 1984, The importance of handling
time for the flight directionality in bees. Behav. Ecol. Sociobiol., 15: 303-309.
SCHMID-HEMPEL, P., 1985, How do bees choose flight di-rection while foraging? Physiol. Entomol., 10: 439-442. SCHMID-HEMPEL, P., 1986, The influence of reward se-quence on flight directionality in bees. Anim. Behav., 34: 831-837.
SCHMITT, J., 1983a, Density-dependent pollinator forag-ing, flowering phenology, and temporal pollen dispersal patterns in Linanthusbicolor. Evolution, 37: 1247-1257. SCHMITT, J., 1983b, Flowering plant density and pollinator
visitation in Senecio. Oecologia, 60: 97-102. STEPHENS, D. W. & KREBS, J. R., 1986, Foraging theory.
Princeton University Press, Princeton.
WADDINGTON, K. D., 1980, Flight patterns of foraging bees relative to density of artificial flowers and distri-bution of nectar. Oecologia, 44: 199-204.
WASER, N. M., 1982, A comparison of distances flown by different visitors to flowers of the same species.
Oecologia, 55: 251-257.
WELLS, H. & WELLS, P. H., 1986, Optimal diet, minimal uncertainty and individual constancy in the foraging of honey bees, Apismellifera. J. Anim. Ecol., 55: 881-891. WESTERBERGH, A. & SAURA, A., 1994, Gene flow and pollinator behaviour in Silenedioica populations. Oikos, 71: 215-224.
WRIGHT, S., 1940, Breeding structure of populations in re-lation to speciation. Am. Nat., 74: 232-248.
ZAR, J. H., 1974, Biostatistical analysis. Princeton-Hall, Englewood Cliffs.
ZIMMERMAN, M., 1979, Optimal foraging: a case for ran-dom movement. Oecologia, 43: 261-267.
ZIMMERMAN, M., 1982a, The effect of nectar production on neighborhood size. Oecologia, 52: 104-108. ZIMMERMAN, M., 1982b, Optimal foraging: random