Comparison Between Multivariate Methods Applied for the
Evaluation of Genetic Divergence in Cacao (
Theobroma
cacao
L.)
Luiz Antônio dos Santos Dias*1 and Paulo Yoshio Kageyama
Centro de Pesquisas do Cacau; 1Present address - Departamento de Biologia Geral, Universidade Federal de Viçosa, CEP 36.571-000, Viçosa - MG, Brasil.
ABSTRACT
Several multivariate methods have been used in divergence analyses of populations. Consistency and relative association among four methods were assessed using a 5 x 5 complete-diallel data involving cacao cultivars. Over a 5-year period, five cultivars were analyzed based upon five yield components. In assessing the divergence of parents only the data obtained from five cacao cultivars were analyzed. Four multivariate statistics presented close association when considered in pairs, in this case the Mahalanobis' (D2) with the mean Euclidean distance obtained from canonical variates (dcv), and mean Euclidean distance (de) with the mean Euclidean distance obtained from principal components (dpc). In both cases, high correlations (r > 0.95) were obtained. However, a weak association was detected between D2 and de and between dpc and dcv (0.50 and 0.66, respectively). Thus, in studies on genetic divergence, statistics considering the error variance-covariance matrix should be preferred whenever its estimate is possible.
Key words: cacao cultivars, canonical variates, genetic divergence, Mahalanobis' and mean Euclidean distances, principal components
* Author for correspondence
INTRODUCTION
Multivariate methods have proven to be adequate for the evaluation of divergence between parents and for predicting promising crosses between them in several crops (Dias and Kageyama, 1997a). Such methods are also applied for optimizing germplasm collections by evaluating the divergence between accessions (Dias et al. 1997). These applications may be performed on characters traditionally evaluated in cacao trials and do not involve any additional field costs. Dias and Kageyama (1997a) were able to associate the average and heterotic performance realized in hybrids, from genetic divergence estimated among five cacao parent
cultivars using D2 of Mahalanobis' distance.
Because an optimum environment was shown to be important for better expressing divergence by
D2, the genetic divergence may be assessed
based on a single favourable year (Dias and Kageyama, 1997b). This strategy has a
predictive nature because it prevents making and evaluating hundreds of undesirable crosses. Only the crosses predicted to be promising are made, thus resulting in saving of financial resources, time, and labour.
statistics can be applied in studies carried out to evaluate divergence. The goal of this study was to compare the four multivariate statistics mentioned in evaluating divergence between
five cacao cultivars. The identification of the least potent characters to divergence was also assessed by using both canonical variates and principal components analyses.
MATERIALS AND METHODS
Plant materials: The present study employed data from cacao cultivars obtained from a 5 x 5 complete-diallel, where five non-commercial cacao cultivars were tested together with their 20 possible hybrids. A detailed combining ability analysis and previous descriptions on this diallel were provided by Dias and Kageyama (1995). In assessing the divergence of parents, only the data obtained from five cacao cultivars (CC 41, SIAL 169, CEPEC 1, ICS 1 and SIC 19) were used, which were evaluated by five yield components - the number of healthy and collected fruits per plant (NHFP and NCFP), the weight of humid seeds per plant in kg (WHSP)
and per fruit in g (WHSF), and the percentage of diseased fruits per plant (PDFP), over a 5-year period.
Multivariate analyses: In order to calculate Mahalanobis’ distance and canonical variates, the joint analysis of variance and covariance, carried out over the set of five cultivars, was used. Thus, the underlying analysis of variance and covariance structure included the following matrices of sums of squares (SS) and products (SP):
Sources of variation Degrees of freedom Matrices of SS and SP
Blocks/year 15
Years (Y) 4
Cultivars (C) 4 SB
C x Y 16
Pooled error 60 SW
Between cultivars variance-covariance matrix B = (1/4). SB Pooled error variance-covariance matrix W = (1/60). SW
The D2 statistic of Mahalanobis' distance (see
Rao, 1952) between two cultivars on p
characters is defined as:
D2 = ′d W−1d
~ ~
where d is a vector of differences between the cultivars averages for all the p characters and d'
is its transpose. W is a p x p
variance-covariance matrix of pooled error obtained from joint analysis of variance. Canonical variates are linear combinations of the p characters, using coefficient of the eigen-vectors associated with the eigen-values of the determinantal matrix
W-1B. B is the estimated between cultivars
variance-covariance matrix and W is the estimated pooled error variance-covariance matrix (both matrices were shown above). By definition, the largest eigen-value and the coefficient of the eigen-vector associated with it, produces the first canonical variate, which
corresponds to the best linear function. The next-largest eigen-value produces the second best linear function and so forth.
variance-covariance matrix W was done equal the identity matrix having unit variance and zero covariance (see Rao, 1952). Thus, one set of original variates Xi was transformed in one set of uncorrelated variables Yi.
Also, the principal component is defined as a linear combination for the p characters, with preservation of the total variance that was redistributed among the components. The first principal component has the largest variance. On the other hand, the second principal component, orthogonal to the first, has the
second largest variance and so forth. The
utilization of the Lagrange multipliers and symbolic differentiation produces the maximization of function, generating a polynomial of the p degree, with latent roots that are the p eigen-values of the covariance
matrix between the characters. As the p
characters were measured in different units, the standardization was necessary. Standardization provided homogeneity of variance and allowed every character an equal chance to contribute to the divergence. Characters standardized to unit variance generated a p x p correlation matrix for principal components analysis (PCA). In this case, the total variance was equal to p since the correlation matrix was used for PCA.
Inferences about redundant characters involved in the analysis were made applying Jolliffe’s (1972, 1973) criterion in the PCA. By this criterion, the characters rejected by redundancy were those associated with the largest coefficients of the eigen-vectors, corresponding to the smallest eigen-values. The number of characters rejected equals the number of eigenvalues of the correlation matrix less than about 0.70. This limit, due to the fact that too few characters were retained, was not considered in our analysis.
The mean Euclidean distance between two cultivars i and i’ in relation to the j character was defined as:
d
p x x
e
j
ij i j
= 1
∑
− 2( ' )
where p was the number of character analyzed and
x
ij = xij/sj being the mean of the j-thcharacter measured in the i-th cultivar standardized by their standard deviation sj. With the standardization and multiplying by 1/p, the Euclidean distance did not alter by the different scales of measurement of the characters nor by their number. Also,
x
ij refered to the scoresfrom the principal components and canonical variates obtained from standardized data and p
could be substituted by k to represent the
number of principal components or of canonical variates, as in expressions below:
d
k pc pc
PC ij
j
i j
= 1
∑
− 2( ' )
where pcij was the score from i-th cultivar in relation to the j-th principal component obtained from correlation matrix between the characters and
d
k cv cv
CV ij
j
i j
= 1
∑
− 2( ' )
where cvij was the score from i-th cultivar in relation to the j-th canonical variate.
RESULTS AND DISCUSSION
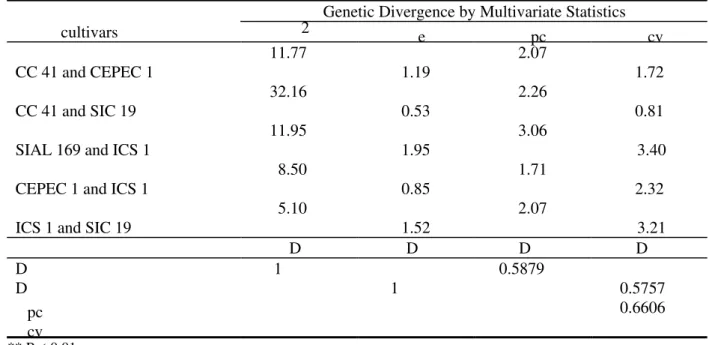
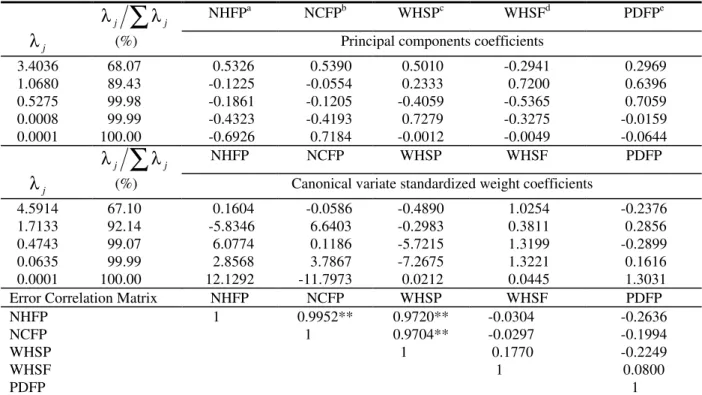
Comparing multivariate statistics: The estimates of Mahalanobis' distance (D2), mean Euclidean distance of standardized data (de) and the estimated mean Euclidean distance of the scores of the first two principal components (dpc) and the first two canonical variates (dcv) refered to the five cacao cultivars to the pairs are shown in Table 1. The first two components and the first two variates accumulated 89.4 and 92.1% respectively, of the total variation (see Table 2). The association among such estimates was first investigated taking into account the
data of Table 1. The D2 and dcv statistics
identified cultivar pairs 1, 4 and 2, 4 as the most divergent and pairs 1, 5 and 3, 5 as the most similar. Based on de and dpc the most divergent cultivars were 2, 3 and 2, 4, and 1, 5 and 3, 4 the most similar. These results demonstrated a certain discrepancy among the different statistics applied.
The ratio between k dpc p de
2 2
/
∑
∑
was anotherapproach for assessing the mean degree of association between statistics dpc and de. In turn, the association between statistics dcv and
D2 was quantified by the k
∑
D2 ratio.with k = 2 as the number of principal components or canonical
calculus of distance, and p = 5 as the number of evaluated characters, the statistical relationship
pc and d provided a degree of
association of 89.4%. On the other hand, the
estimated from canonical variates and the sum Mahalanobis' distances was, in this case, 92.1%, which demonstrated a higher degree of
Table 1. Estimates of Mahalanobis' distance (D2), mean Euclidean distance (d ), Euclidean distance obtained from
pc variates (d ) and rank correlation coefficient between these
Genetic Divergence by Multivariate Statistics
cultivars 2 e pc cv
11.77 2.07
CC 41 and CEPEC 1 1.19 1.72
32.16 2.26
CC 41 and SIC 19 0.53 0.81
11.95 3.06
SIAL 169 and ICS 1 1.95 3.40
8.50 1.71
CEPEC 1 and ICS 1 0.85 2.32
5.10 2.07
ICS 1 and SIC 19 1.52 3.21
D D D D
D 1 0.5879
D 1 0.5757
pc 0.6606
cv ** P < 0.01
estimates applied was also assessed with the
among the studied characters (Table 2). This
Mahalanobis' distance with that of the mean Euclidean distance and the mean Euclidean distance from principal components with that obtained from canonical variates. However, the H0 hypothesis, employed to test the equality between the pooled error correlation matrix and the identity matrix was accepted (χ2 = 14.66, P < 0.05 with 10 d.f), although this matrix presented three correlation estimates of high magnitudes in the 10-correlation set (see Table 2).
The degree of association of the different distance estimates was also evaluated by the correlation between them (Table 1). The correlations were of high magnitudes regarding the Mahalanobis' and Euclidean distances obtained from canonical variates (r = 0.95) and between the mean Euclidean distance and the Euclidean estimated from principal components (r = 0.97). However, the correlations between the estimates of D2 and de, D2 and dpc, de and dcv, and between dpc and dcv were only moderate, which confirmed the discrepancy detected among several statistics used in
quantifying the divergence among cultivars. Also Maluf and Ferreira (1983) found a low correlation estimate between the Euclidean and the Mahalanobis' distances (r = 0.27). However, similar divergence patterns between D2 and the Euclidean distance (Maluf et al, 1983), and between D2 and canonical variates (Ramanujam et al, 1974; Narayan and Macefield, 1976; Jain et al, 1981; Das & Das Gupta, 1984) have been reported. On the other hand, Hussaini et al (1977) and Calamassi et al (1988) detected close association in the divergence analysis conducted by principal components and canonical variates. A high degree of association among four statistics, used in this study, was reported by Cruz et al (1994) and Pires (1993). Such literature results obtained with different species, demonstrated fundamentally the relative consistency of the multivariate techniques and acknowledged, with certain restriction, the application of any one of them in studies on the estimate of genetic divergence between populations.
Table 2. Estimates of eigenvalues (
λ
j), its relative importance (λ
j/
∑
λ
j), its corresponding coefficients related to the principal components and canonical variates and error correlation matrix involving five characters evaluated from five cacao cultivars.λ
j∑
λ
j NHFPa
NCFPb WHSPc WHSFd PDFPe
λ
j (%) Principal components coefficients3.4036 68.07 0.5326 0.5390 0.5010 -0.2941 0.2969
1.0680 89.43 -0.1225 -0.0554 0.2333 0.7200 0.6396
0.5275 99.98 -0.1861 -0.1205 -0.4059 -0.5365 0.7059
0.0008 99.99 -0.4323 -0.4193 0.7279 -0.3275 -0.0159
0.0001 100.00 -0.6926 0.7184 -0.0012 -0.0049 -0.0644
λ
j∑
λ
j NHFP NCFP WHSP WHSF PDFP
λ
j (%) Canonical variate standardized weight coefficients4.5914 67.10 0.1604 -0.0586 -0.4890 1.0254 -0.2376
1.7133 92.14 -5.8346 6.6403 -0.2983 0.3811 0.2856
0.4743 99.07 6.0774 0.1186 -5.7215 1.3199 -0.2899
0.0635 99.99 2.8568 3.7867 -7.2675 1.3221 0.1616
0.0001 100.00 12.1292 -11.7973 0.0212 0.0445 1.3031
Error Correlation Matrix NHFP NCFP WHSP WHSF PDFP
NHFP 1 0.9952** 0.9720** -0.0304 -0.2636
NCFP 1 0.9704** -0.0297 -0.1994
WHSP 1 0.1770 -0.2249
WHSF 1 0.0800
PDFP 1
However, our study did not corroborate these results. The four multivariate statistics presented close association only when considered in pairs:
in this case the Mahalanobis' (D2) with the
Euclidean distance obtained from canonical variates (dcv), and mean Euclidean distance (de) with the Euclidean distance obtained from principal components (dpc). The Euclidean distance is a Pythagorean distance, extended to orthogonal multiple axes. It then presupposes independence between the characters analyzed (Sneath and Sokal, 1973). Since in our study the characters were intercorrelated, particularly NCFP, NHFP and WHSP, the application of Euclidean distance could be inadequate. For this reason, when calculating Euclidean distance from the scores of first principal components, the same result was obtained. In fact, these two last measures of distance were closely associated with each other (r = 0.97 in Table 1). On the other hand, both distances were not associated with the two remaining distance measures (Table 1).
Essentially it was the error variance-covariance matrix that made the difference, as it was considered in Mahalanobis’ distance and canonical variate but not in Euclidean distance and PCA. According to Van Laar (1991), the
measures of distance which consider all p
variances as well as all p(p-1)/2 covariances (as Mahalanobis’ distance and Euclidean distance obtained from canonical variates) are more suitable for population divergence studies than mere Euclidean distance. The discrepancy verified among the statistics constituted an additional complication. It is especially true in studies on divergence between accessions arranged in germplasm banks or even under natural conditions, where usually there is no replication. In these cases, however, the error variance-covariance matrix is likely to be obtained from the variation among plants within the accessions. Nevertheless, in cases where only the means of accessions are available, the application of the Euclidean distance to the original or standardized data and to the scores of principal components is the only feasible solution, although the possibility of a successful analysis be reduced.
Importance of Characters for Divergence:
The implications of the inclusion of redundant characters in this study was possible to be quantified. The topic has been treated in the light of the relative importance of different characters for divergence and the possibility of discarding them, without distortion in the distance matrix taking place. In order to identify the most potent characters in the determination of genetic divergence, Singh’s (1981) criterion was applied to Mahalanobis’ distance matrix. The relative contributions of characters in terms
of percentage of overall D2 were 38.6% to
NCFP, 32.5% to WHSF, 16.9% to NHFP, 8.8% to WHSP and 3.2% to PDFP. When applied to canonical variates (see Table 2), Singh’s criterion identified NHFP and WHSP as being of minor importance to divergence. In relation to principal components, the characters of minor importance for the divergence were NCFP and WHSP (as it can be seen in Table 1), when Jolliffe’s (1972, 1973) criterion was employed. Hence, the different rejection criteria used have indicated precisely those characters known to be redundant.
Table 3. Estimates of Mahalanobis' distance (D2), Euclidean distance obtained from canonical variates (dcv), mean Euclidean distance (de) and Euclidean distance obtained from principal components (dpc), considering all the characters (without subscript), discarding of NHFP (subscript 1) and simultaneous discarding of NHFP and WHSP (subscript 2).
Cult. D2 D21 D22 dcv Dcv1 dcv2 de de1 de2 dpc dpc1 Dpc2
1, 2 11.77 9.76 9.71 2.39 3.06 3.11 1.31 1.43 1.44 2.07 2.02 1.76
1, 3 7.96 7.64 6.84 1.72 2.48 2.50 1.19 1.08 1.05 1.83 1.46 1.21
1, 4 32.16 32.12 32.01 4.00 5.66 5.65 1.50 1.52 1.74 2.26 2.07 2.10
1, 5 1.94 1.93 1.89 0.81 1.15 1.18 0.53 0.56 0.47 0.38 0.32 0.22
2, 3 11.95 11.20 9.99 2.36 3.29 3.11 1.95 1.91 1.67 3.06 2.67 1.91
2, 4 23.51 22.02 22.00 3.40 4.64 4.67 1.95 1.94 1.99 2.99 2.67 2.43
2, 5 8.50 6.71 6.54 1.95 2.38 2.39 1.20 1.33 1.49 1.71 1.71 1.79
3, 4 13.10 12.97 11.44 2.32 3.37 3.23 0.85 0.95 0.99 0.72 0.81 0.88
3, 5 5.10 4.88 4.40 0.99 1.55 1.49 1.50 1.38 1.13 2.07 1.54 1.01
4, 5 20.86 20.85 20.55 3.21 4.53 4.51 1.52 1.45 1.54 2.40 2.05 1.89
r 0.99 0.99 r 0.94 0.95 r 0.96 0.89 r 0.95 0.85
Cultivars: 1 = CC 41; 2 = SIAL 169; 3 = CEPEC 1; 4 = ICS 1; 5 = SIC 19.
r refers to the Spearman’s rank correlation coefficient between distance estimates obtained from all the characters and their corresponding distance estimates considering discarding of NHFP (subscript 1) and simultaneous discarding of NHFP and WHSP (subscript 2).
Jolliffe (1972, 1973) has demonstrated that
results obtained from real data and artificial data
analyzed by principal components were little
changed if some of the variables, which were
previously known to be redundant, were
discarded. In this study, when the discarding of
both NHFP and WHSP was simulated, there was
a change in the mean Euclidean distance matrix
and mean Euclidean distance matrix obtained
from principal components (see Table 3). In
these cases, the de and dpc statistics identified cultivar pairs 1, 4 and 2, 4 as the most divergent
and only pair 1, 5 as the most similar, repeating
part of results obtained with the D2 and dcv
statistics. Hence, the presence of redundant
characters influenced the de and dpc statistics and it provided distortion in the distance matrix,
since these statistics are not sufficiently robust
to support redundancy in high degree.
RESUMO
REFERENCES
Calamassi, R.; Puglisi, S.R. & Vendramin, G.G. (1988), Genetic variation in morphological and anatomical needle characteristics in
Pinus brutia Ten.. Silvae Genet., 37, 199-206
Cruz, C.D.; Vencovsky, R. & Carvalho, S.P. (1994), Estudos sobre divergência genética. III. Comparação de técnicas multivariadas.
Rev. Ceres., 41, 191-201
Das, P.K. & Das Gupta, T. (1984), Multivariate analysis in black gram {Vigna mungo (L) Hepper}. The Indian J. Genet. Plant Breed.,
44, 243-247
Dias, L.A.S. (1998), Análises multidimensionais. In: Eletroforese de Isoenzimas e Proteínas Afins: fundamentos e aplicações em plantas e microrganismos, (Ed.) A. C. Alfenas, Editora UFV, Viçosa, pp. 405-475
Dias, L.A.S. & Kageyama, P.Y. (1995), Combining-ability for cacao (Theobroma cacao L.) yield components under southern Bahia conditions. Theor. Appl. Genet., 90, 534-541
Dias, L.A.S. & Kageyama, P.Y. (1997a), Multivariate genetic divergence and hybrid performance of cacao (Theobroma cacao L.).
Brazil. J. Genetics, 20, 63-70
Dias, L.A.S. & Kageyama, P.Y. (1997b), Temporal stability of multivariate genetic divergence in cacao (Theobroma cacao L.) in Southern Bahia conditions. Euphytica., 93, 181-187
Dias, L.A.S.; Kageyama, P.Y. & Castro, G.C.T. (1997), Divergência fenética multivariada na preservação de germplasma de cacau (Theobroma cacao L.). Agrotrópica., 9 29-40 Godoi, C.R.M. (1985), Análise Estatística Multidimensional. Departamento de Matemática, ESALQ, USP, Piracicaba Hussaini, S.H., Goodman, M.M. & Timothy,
D.H. (1977), Multivariate analysis and the geographical distribution of the world collection of finger millet. Crop Sci., 17, 257-263
Jain, A.K., Dhagat, N.K. & Tiwari, A.S. (1981),
Genetic divergence in finger millet. The
Indian J. Genet. Plant Breed., 41, 346-348
Jolliffe, I.T. (1972), Discarding variables in a principal component analysis. I. Artificial data. Appl. Stat., 21, 160-173
Jolliffe, I.T. (1973), Discarding variables in a principal component analysis. II. Real data.
Appl. Stat.,22, 21-31
Maluf, W.R. & Ferreira, P.E. (1983), Análise multivariada da divergência genética em feijão-vagem (Phaseolus vulgaris L.).
Brazil. Hort., 1, 31-34
Maluf, W.R.; Ferreira, P.E. & Miranda, J.E.C. (1983), Genetic divergence in tomatoes and its relationship with heterosis for yield in F1 hybrids. Brazil. J. Genet., 6, 453-460
Narayan, R.K.J. & Macefield, A.J. (1976), Adaptive responses and genetic divergence in a world germplasm collection of chick pea (Cicer arietinum L.). Theor. Appl. Genet.,
47, 179-187
Pires, C.E.L.S.. (1993), Diversidade genética de variedades de cana-de-açucar (Saccharum spp.) cultivadas no Brasil. Tese de Doutorado, ESALQ, USP, Piracicaba
Ramanujam, S.; Tiwari, A.S. & Mehra, R.B. (1974), Genetic divergence and hybrid performance in mung bean. Theor. Appl.
Genet., 45, 211-214
Rao, C.R. (1952), Advanced Statistical Methods in Biometric Research. John Wiley, New York
Singh, D. (1981), The relative importance of characters affecting genetic divergence. The
Indian J. Genet. Plant Breed., 41, 237-245
Sneath, P.H.A. & Sokal, R.R. (1973), Numerical taxonomy. Freeman, San Francisco
Van Laar, A. (1991), Forest Biometry. Sappi Forests, Stellenbosch