DOI: 10.1590/0004-282X20130168 ARTICLE
Interleukin-10 may protect against progressing
injury during the acute phase of ischemic stroke
Interleucinas 1B, 2 e 10 e prognóstico neurológico durante a fase aguda do AVC isquêmico
Gustavo G. Protti1, Rubens J. Gagliardi2, Wilma C. N. Forte3, Sandra Regina S. Sprovieri4
Faculty of Medical Sciences, Irmandade da Santa Casa de Misericórdia de São Paulo, São Paulo, Brazil.
1Neurologist of the Emergency Service, Department of Medicine; 2Full Professor of the Neurology Division, Department of Medicine; 3Professor of the Immunology Division, Department of Pathological Sciences;
4Clinical Coordinator of the Emergency Service and Discipline Leader Emergency Medicine, Department of Medicine;
Correspondence: Rubens José Gagliardi; Rua Dr. Cezário Motta Jr. 112; Vila Buarque; 01221-020 São Paulo SP - Brasil; E-mail: [email protected]
Conflict of interest: There is no conflict of interest to declare.
Received 18 October 2012; Received in final form 26 June 2013; Accepted 04 July 2013.
ABSTRACT
Atherosclerosis is an inflammatory disease, and ischemic stroke is one of its most common and devastating manifestations. Proinflam-matory cytokines play a key role in the progression of the irreversible ischemic lesions. The presence of anti-inflamProinflam-matory mediators may prevent secondary ischemic injury. Objectives: 1) To assess the relationship between stroke severity and the serum levels of IL-1β, IL-2, and IL-10; and 2) To analyze the neurological outcome after 72 h of ischemic stroke onset and expression of interleukins. Method: We measured the serum levels of IL-1β, IL-2, and IL-10 in 26 patients with acute stroke. Neurological impairment was scored using the National Institute of Health Stroke Scale within the first 72 h after stroke onset. Thirty healthy subjects were analyzed as controls. Results: Patients with IL-10 <925.0 pg/mL presented with neurological deterioration within the first 72 h. Conclusion: IL-10 may protect against ischemic injury during the acute phase of stroke.
Keywords: ischemic stroke, cytokines, inflammation.
RESUMO
Aterosclerose é considerada um doença inflamatória e o acidente vascular cerebral (AVC) isquêmico uma de suas principais manifestações. Citocinas pró-inflamatórias exercem importante função na progressão para uma lesão isquêmica irreversível. A presença de mediadores anti-inflamatórios age prevenindo a lesão isquêmica secundária. Objetivos: 1) Avaliar a relação entre gravidade do AVC e níveis de IL-1β, IL-2 e IL-10; 2) Avaliar a relação entre prognóstico neurológico nas primeiras 72 horas do AVC e o nível destas citocinas. Método: Mensuramos os níveis de IL-1β, IL-2 e IL-10 de 26 pacientes com AVC isquêmico. O comprometimento neurológico foi avaliado através da escala do National Institute of Health nas primeiras 72 horas do AVC. Trinta indivíduos saudáveis foram usados como controles. Resultados: Pacientes com IL-10 <925,0 pg/mL apresentaram deterioração neurológica nas primeiras 72 horas após o início do AVC. Conclusão: IL-10 pode apresentar um efeito protetor contra a progresso da lesão isquêmica durante a fase aguda do AVC.
Palavras-chave: acidente vascular cerebral isquêmico, citocinas, inflamação.
Stroke is a frequent cause of death and long-term disa-bility worldwide. One-third of the patients with acute ische mic stroke develop early neurological defects, resulting in increased mortality and functional disability1. he underlying mechanism is not completely understood, but there is evidence pointing
toward the role of inlammation in acute stroke progression. Peripheral leukocyte inlux into the ische mic cerebral paren
-chyma and activation of microglia occur during the irst few hours after stroke onset. he activated cells secrete cytokines
resulting in a local upregulation of adhesion molecules and fur-ther recruitment of peripheral leukocytes, fur-thereby amplifying
the inlammatory response trigged by ischemia2.
Neutrophils are generally the irst leukocyte sub-type
recruited to ischemic cerebral tissue, followed by lympho-cytes. Both neutrophils and lymphocytes secrete
poten-tially cytotoxic substances, such as inlammatory media -tors and proteolytic enzymes, involved in secondary tissue
damage among the penumbra surrounding the infarct core2.
Leukocyte recruitment and adhesion to cerebral endothe-lium also obstruct the microvessels within the penumbra and contribute to the impairment of complete reperfusion of the ischemic brain tissue3.
Expression of proinlammatory cytokines was detected
the last complication of atherosclerosis responsible for myo-cardial infarction and most strokes4. Moreover, these inlam -matory mediators are considered to be responsible for re-cruiting leukocytes to the ischemic area after stroke5.
Interleukin 1 (IL-1) is the prototypic inlammatory cy -tokine with widespread impact on neural function. IL-1
family cytokines consist of six members, three receptor li -gands [IL-1a, IL-1β, and IL-1 receptor antagonist (IL-1ra)], two receptor subtypes (IL-1RI and IL-1RII), and an accessory
protein (IL-1AcP). he IL-1 family inlammatory mediators show cell-speciic patterns of production, expression, and
release. Ligands are primarily produced by glia (and some
neurons), while astrocytes and neurons express the signal
transducing receptor IL-1RI6. Under normal conditions, IL-1 expression is very low in the brain6; however, IL-1β expres -sion is rapidly induced in stroke models. It has been shown
that rats expressing low serum levels of IL-1 exhibit lesser extent of ischemic injury following transient or permanent
middle cerebral artery (MCA) occlusion, suggesting that IL-1 may play a deleterious role in cerebral ischemia. Similarly,
administration of IL-1ra or Il-1β blocking antibodies has
been shown to reduce neuronal death. On the other hand,
administration of recombinant IL-1β is associated with
larger lesions, brain edema, and neutrophil adhesion and
iniltration within the ischemic tissue. Furthermore, IL-1 also regulates the expression of the endothelial cell adhe
-sion molecules, and promotes the neutrophil tissue iniltra -tion. In addition, IL-1 induces the production of other
cy-tokines, such as IL-6, TNF-α, CSFs and itself, in a positive feedback loop, thereby making it diicult to distinguish the IL-1-speciic efects compared with the indirect efects from
other cytokines2.
IL-10, an anti-inlammatory cytokine inhibits the pro
-duction of IL-1 and TNF-α by suppressing cytokine receptor
expression and activation. IL-10 is synthesized in the central
nervous system (CNS) and is upregulated in stroke models.
Exogenous expression of IL-10 or IL-10 gene transfer are as -sociated with reduced ischemic area after MCA occlusion,
suggesting a protective role for IL-10 against ischemic injury2. Furthermore, subjects with low peripheral serum levels of
IL-10 have an increased risk for stroke7. Low serum levels of IL-10 have also been associated with unstable clinical pro-gression in angina patients8.
Interleukin-2 (IL-2), the cytokine also known as T-cell growth factor, is involved in several immunoregulatory and biological functions not only related to the T-cells. IL-2 is known to regulate several processes in CNS, such as sleep and arousal, memory function, and locomotion and the
modula-tion of the neuroendocrine axis. IL-2 and/or IL-2R have been shown to be expressed in rodent and human frontal cortex,
septum, striatum, hippocampal formation, hypothalamus,
lo-cus coeruleus, cerebellum, and the pituitary and iber tracts
such as the corpus callosum. Due to its blood–brain barrier
permeability, IL-2 from either peripheral or central origin, can access the functional IL-2R molecules on neurons and glia9. herefore, IL-2 may play a key role in the pathogenesis of stroke either by promoting T-cell recruitent or by its direct action upon the neurons and glia cells.
PURPOSE
In view of this issue, we evaluated the relationship between IL-1β, IL-2, and IL-10 expression and neurologic out -come following 72 h of ischemic stroke onset. Serum levels of IL-1β, IL-2, and IL-10 of patients with acute stroke were
com-pared with those of controls classiied as having signiicant
atherosclerosis.
METHOD
Patients and control subjects
In brief, all the subjects were over 18 years and from Santa Casa de Misericórdia de São Paulo. Subjects within 72 h of
acute ischemic stroke onset were integrated in to the group 1.
Subjects were selected on Monday, Tuesday, and Wednesday, between June 2005 and December 2006. Subjects with known chronic inlammatory or infectious disease, cancer, hemato
-logic disease and renal or hepatic insuiciency were excluded
from the study. Patients where time of symptom onset could
not be reliably determined were also excluded. Group 2 com posed of control subjects with no history of stroke or tran sient ischemic attack, infectious or inlammatory disease, malignances or renal or hepatic failure. Control subjects had
at least two risk factors for atherosclerosis10 at the time of inclusion in this study and were under regular follow-up at the geriatric ambulatory of the D. Pedro II Hospital,
main-tained by Santa Casa de Misericórdia de São Paulo. Written
informed consent of approval was obtained from all the
pa-tients and control subjects. his study had the approval of the
Local Research Ethics Committee.
Diagnosis of ischemic stroke was based on the clinical features. Computed tomography (CT) scans of brains were
performed within 24 h of admission, to exclude the patients
with primary intracerebral hemorrhage and other stroke-mimicking conditions. To evaluate the degree of atheroscle-rosis, bedside carotid ultrasound was performed on patients
and control subjects with conditions that allowed the exami -nation; because this facility was not available at the hospital, it was conducted at the radiology department11. Patients and control subjects evaluated by carotid ultrasound were classi
-ied into two subgroups, one without signiicant atheroscle -rosis (bilateral, <50% carotid artery stenosis) and the other
with signiicant atherosclerosis (≥50% carotid artery stenosis
Clinical outcome assessment
he severity of neurological impairment was evaluated
and scored by the National Institutes of Health Stroke Scale (NIHSS, referred to as NIH1). A new neurological examination was performed after 72 h of stroke onset. he neurolo gical deicit and functional disability were scored by the NIHSS
(referred to as NIH2) and the modiied Rankin Scale (mRS)
respectively. Neurological outcome evaluation was based
on the NIHSS score variation (NIH1–NIH2) and the mRS
score. For the purpose of stratifying into diferent outcome subgroups, patients were further classiied into the better
(NIH2≤NIH1) or worse (NIH2>NIH1) outcome groups.
Blood samples
At baseline, venous blood samples were collected from
patients and control subjects into tubes containing heparin. hirty minutes after collection, 30 mL of blood was centrifu-ged in Ficoll-Paque (Pharmacia™) gradient (300 g, 30 min,
room temperature). Cell pellets were washed twice with sterile Roswell Park Memorial Institute-1640 medium (RPMI, Cultilab™) (300 g, 10 min, 4°C) and resuspended in RPMI-1640 medium supplemented with 10% fetal bovine serum (FBS), L-glutamine [2 mM], and gentamicine [5 μg/mL]. Cell num
-ber was adjusted to 1 × 10⁶ cell/mL and stimulated with
phytohemagglutinin for 48 h, 37 °C, 5% CO2 atmosphere.
Cell culture supernatants were aliquoted and stored at −70°C
until analysis.
Immunological Assays
Blood culture supernatants were assayed for the serum
levels of IL-1β, IL-2, and IL-10 by using the commercial
kits for quantitative enzyme-linked immunosorbent assay (ELISA) supplied by BD Biosciences (OptEIA™). Assay sensi-tivities were 7.8 pg/mL minimum and 500 pg/mL maximum. Samples were diluted to 1:10 to achieve maximum allowed sensitivity of 5000 pg/mL. Values over 5000 pg/mL were estimated using the linear coeicient 0.9979. Analyses were
performed by technician’s blind to clinical information.
Statistical Analysis
he χ2 and Studentt-tests were irst applied for “gender”
and “age” variable assessment. Clinical data (mRS and
NIHSS) and cytokine levels were not normally distributed.
Analyses were performed using the Statistical Package for
Social Sciences software (SPSS v13.0), considering a p-value
<5% as signiicant. Diference in cytokine levels between the two groups was assessed using the Mann–Whitney test. he
Spearman correlation analysis was applied to verify the pos-sible relationship between cytokine levels and stroke severity (NIH1). Finally, the Mann-Whitney test was again applied on group 1 to compare the cytokine levels on admission and
neurological impairment progression (mRS and NIH2). he
receiver-operating characteristic (ROC) curve analysis was
applied on signiicant cytokine data to determine the cutof
values in group 1 patients.
RESULTS
Eighty-seven patients were recruited in group 1. Sixty-one patients were excluded due to one or more of the following
criteria: 32 could not sign the written informed consent, 53
could not deine the exact time of symptoms onset, 3 pa -tients had a diagnosis of cancer, and 6 presented evidence of
active malignancy during the irst few days after admission. herefore, only 26 patients [14 women and 12 men, mean age
65.54 (±12.54) years] were eligible to remain in the group 1. According to Toast11, 13 patients were classiied as probable, and 5 as possible toward large-artery atherosclerosis stroke, 4 for small-vessel occlusion (lacune), and 4 for
cardioembo-lism. he mean time between stroke onset and blood sample collection was 22.85 (7-49) h. Group 2 composed of 30 con
-secutive control subjects [23 women and 7 men, mean age
73.06 (±10.63) years]. Participant characteristics are summa-rized in Tables 1 and 2.
Among the patients evaluated with carotid ultrasound,
there was a signiicant (p=0.016) predominance of high-grade atherosclerosis within the stroke patients compared to
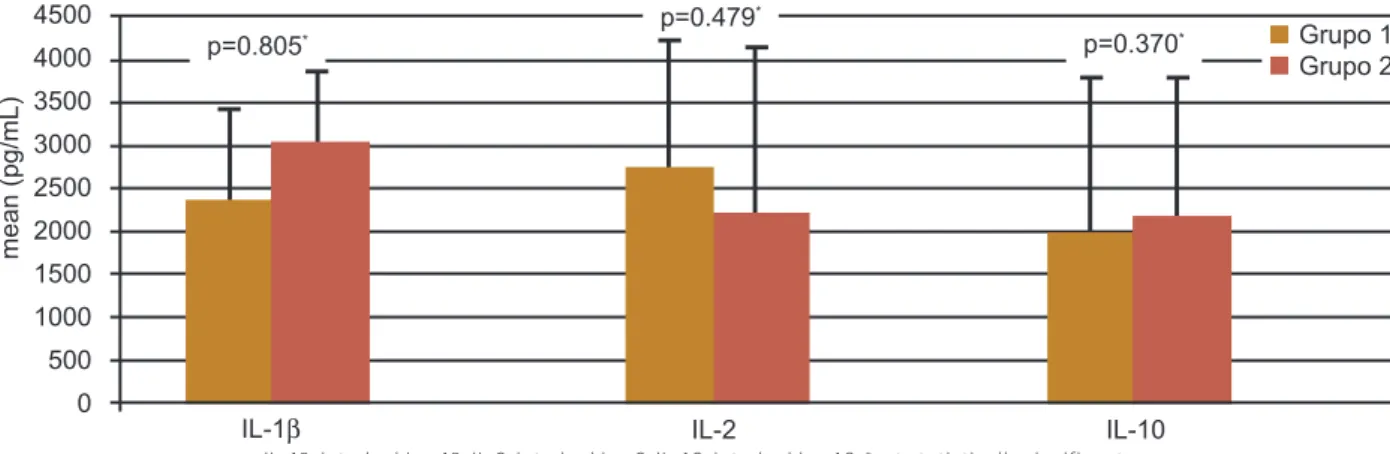
the control subjects. here were no signiicant diferences in
IL-1β, IL-2, and IL-10 levels between groups 1 and 2 (p=0.479,
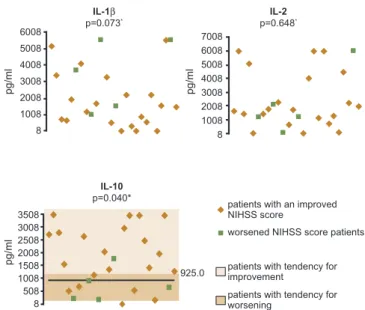
0.370, and 0.805, respectively, Figure 1). Neurologic impair -ment severity on admission had no correlation with the cyto-kines tested (p=0.919, 0.053, and 0.493 for IL-1β, 2, and IL-10 respectively). IL-1β and IL-2 levels were not signiicantly
altered with either better or worse outcomes (p=0.073 and
0.648, respectively, Figure 2). On the other hand, a signiicant
increase in IL-10 level was associated (p=0.040) with neurolo-gical improvement following 72 h of stroke onset (better
out-come subgroup patients). From ROC curve analysis, the IL-10 cutof value of 925.0 pg/mL is associated with the best sensi
-tivity and speciicity (76.2% and 80% respectively) (Figure 2). herefore, patients with an IL-10 value above the 925.0 pg/mL cutof tend to have a better outcome after 72 h.
DISCUSSION
he immune activity in the healthy central nervous sys -tem (CNS) is tightly regulated to prevent unwanted
immune-mediated damage12. Cytokines such as IL-1, IL-2, and IL-10
However, distinguishing inlammation as a response to ischemic brain injury from an inlammatory trigger for acute stroke is diicult. In our study, cytokine levels in stroke pa
-tients did not difer from the control subjects, indicating that
the changes in cytokine levels following stroke may in fact
relect a pre-existing situation. It is known that the efect of stroke is strongly inluenced by pre-existing inlammato
-ry and infectious conditions. he exclusion of patients with
known infectious illnesses could apparently attenuate this
bias. However, atherosclerosis as an inlammatory di sease might also be expected to contribute to a pre-existing inlam -matory state and acts as a confounding factor.
Carotid atherosclerosis is an important mechanism in patients with ischemic stroke or transient attack due to
the possibility of intervention by endarterectomy or angio-plasty. In combination with the degree of luminal stenosis,
non- invasive measure of inlammation and plaque instability would be a useful adjunct method to determine the risk of
cerebral ischemic events in selected patients for appropriate clinical or surgical treatment. However, further studies ana-lyzing the long-term follow-up are warranted to investigate this issue.
Possible criticism of the present study includes the rela-tively small sample size. In addition, the release of cytokines is often time-dependent: a single sample from each patient
collected at varied time intervals from 7 to 49 h can relect diferent phases of the biomarker kinetics. he diference in timing of sample collection and the extent of severity of
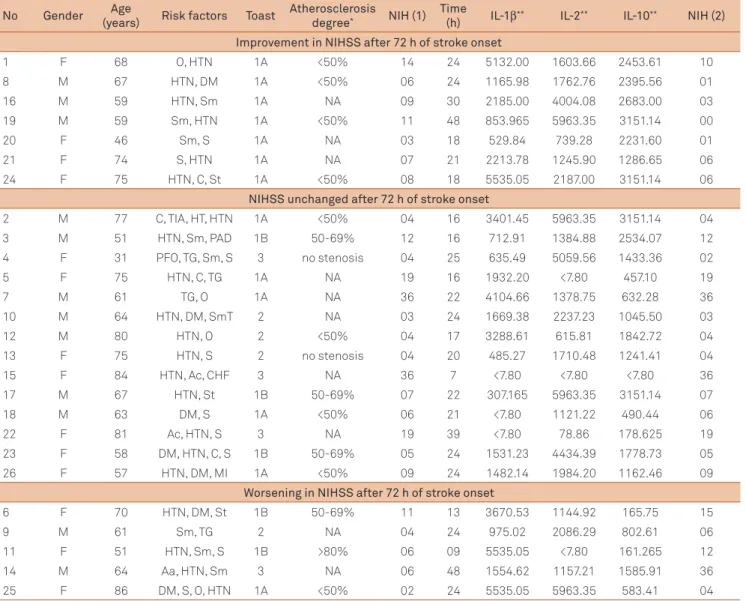
Table 1. Main characteristics of patients with acute ischemic stroke (group 1).
No Gender Age
(years) Risk factors Toast
Atherosclerosis degree* NIH (1)
Time
(h) IL-1β** IL-2** IL-10** NIH (2) Improvement in NIHSS after 72 h of stroke onset
1 F 68 O, HTN 1A <50% 14 24 5132.00 1603.66 2453.61 10
8 M 67 HTN, DM 1A <50% 06 24 1165.98 1762.76 2395.56 01
16 M 59 HTN, Sm 1A NA 09 30 2185.00 4004.08 2683.00 03
19 M 59 Sm, HTN 1A <50% 11 48 853.965 5963.35 3151.14 00
20 F 46 Sm, S 1A NA 03 18 529.84 739.28 2231.60 01
21 F 74 S, HTN 1A NA 07 21 2213.78 1245.90 1286.65 06
24 F 75 HTN, C, St 1A <50% 08 18 5535.05 2187.00 3151.14 06
NIHSS unchanged after 72 h of stroke onset
2 M 77 C, TIA, HT, HTN 1A <50% 04 16 3401.45 5963.35 3151.14 04
3 M 51 HTN, Sm, PAD 1B 50-69% 12 16 712.91 1384.88 2534.07 12
4 F 31 PFO, TG, Sm, S 3 no stenosis 04 25 635.49 5059.56 1433.36 02
5 F 75 HTN, C, TG 1A NA 19 16 1932.20 <7.80 457.10 19
7 M 61 TG, O 1A NA 36 22 4104.66 1378.75 632.28 36
10 M 64 HTN, DM, SmT 2 NA 03 24 1669.38 2237.23 1045.50 03
12 M 80 HTN, O 2 <50% 04 17 3288.61 615.81 1842.72 04
13 F 75 HTN, S 2 no stenosis 04 20 485.27 1710.48 1241.41 04
15 F 84 HTN, Ac, CHF 3 NA 36 7 <7.80 <7.80 <7.80 36
17 M 67 HTN, St 1B 50-69% 07 22 307.165 5963.35 3151.14 07
18 M 63 DM, S 1A <50% 06 21 <7.80 1121.22 490.44 06
22 F 81 Ac, HTN, S 3 NA 19 39 <7.80 78.86 178.625 19
23 F 58 DM, HTN, C, S 1B 50-69% 05 24 1531.23 4434.39 1778.73 05
26 F 57 HTN, DM, MI 1A <50% 09 24 1482.14 1984.20 1162.46 09
Worsening in NIHSS after 72 h of stroke onset
6 F 70 HTN, DM, St 1B 50-69% 11 13 3670.53 1144.92 165.75 15
9 M 61 Sm, TG 2 NA 04 24 975.02 2086.29 802.61 06
11 F 51 HTN, Sm, S 1B >80% 06 09 5535.05 <7.80 161.265 12
14 M 64 Aa, HTN, Sm 3 NA 06 48 1554.62 1157.21 1585.91 36
25 F 86 DM, S, O, HTN 1A <50% 02 24 5535.05 5963.35 583.41 04
M:F: 12:14; Mean age: 65,54 (±12,61) years.
F: female; M: male; Aa: acute cardiac arrhythmia; Ac: chronic cardiac arrhythmia; PFO: patent foramen ovale; HTN: arterial hypertension; DM: diabetes mellitus; Sm: smoke; C: hypercholesterolemy; TG: hypertrigliricidemy; CHF: chronic heart failure; O: obesity; S: sedentarism; St: previous ischemic stroke; TIA: transient ischemic attack; MI: previous myocardial infarction; HT: controlled hyperthyroidism; PAD: peripheral artery disease; Toast: classification of ischemic stroke according to Toast: 1A- possible large vessel stroke (atherothombotic), 1B- probable large vessel stroke (atherothrombotic), 2- small vessel stroke (lacune), 3- carioembolic stroke; *atherosclerosis degree: stenosis degree according to carotid ultrasound; NA: not available; **pg/mL. NIHSS: (referred to NIH
1) National
Table 2. Main characteristics of control subjects (group 2).
No Gender Age (years) Risk factors Atherosclerosis degree* IL-1β** IL-2** IL-10**
Low grade atherosclerosis
1 F 82 Ac, HTN, C stenosis <50% 5535.05 1405.84 592.22
2 F 69 HTN, DM stenosis <50% 5085.05 1399.70 443.54
4 F 64 C, HTN no stenosis 1041.85 216.67 3007.25
6 M 88 O, TG, C, HTN, DM stenosis <50% 5535.05 540.68 1096.26
9 F 74 Ac, HTN, DM, CHF stenosis <50% 5535.05 1200.70 3151.14
11 F 64 HTN, Sm stenosis <50% 5132.00 <7.80 2975.83
12 M 59 HTN, DM, O no stenosis 3620.90 <7.80 920.24
13 M 43 Sm, HTN no stenosis 3768.80 1929.90 3151.14
14 F 67 Sm, C no stenosis 864.95 503.69 3151.14
15 F 86 CHF, HTN, S stenosis <50% 2746.64 46.27 2279.51
16 F 84 HTN, DM stenosis <50% 1280.47 5963.35 2343.96
17 F 70 HTN, C no stenosis 1512.96 2233.54 2546.15
18 F 58 HTN, DM, C no stenosis 1264.99 5963.35 3007.25
19 F 64 HTN, C no stenosis 498.51 4525.93 1892.92
20 M 74 S, Sm, C no stenosis 1381.08 5347.24 258.73
21 F 66 HTN, TG, C no stenosis 1158.57 3279.84 2276.71
22 F 67 S, C no stenosis 41.54 622.44 1868.34
23 M 72 C, TG, DM no stenosis 76.87 3563.91 1316.59
24 F 79 HTN, DM, O stenosis <50% 245.18 5221.68 1125.20
25 F 72 HTN, DM, C, O. stenosis <50% 199.27 2795.64 1430.20
26 F 68 HTN, S, TG no stenosis 814.18 <7.80 588.96
27 F 69 HTN, O, C, TG no stenosis <7.80 337.05 1018.51
28 M 77 HTN, C, TG no stenosis <7.80 <7.80 371.74
29 F 81 HTN, C stenosis <50% 4681.12 2051.47 1018.51
High grade atherosclerosis
5 F 87 HTN, DM, C stenosis >70% 5369.00 503.71 1122.50
7 F 91 HTN, Ac, DM, CHF stenosis 50-69% 4068.02 1036.43 1493.87
8 M 89 CHF, HTN, DM stenosis >70% 4366.17 610.60 477.37
10 F 77 DM, HTN stenosis 50-69% 4132.28 2755.23 3007.25
30 F 77 DM, HTN, C stenosis 50-69% 4626.83 3411.61 371.74
Carotid ultrasound not performed
3 F 74 Ac, Sm, C NA 5109.45 <7.80 324.18
M:F: 7:23; Mean age: 73,06 (±10,63) years; F: female; M: male; Ac: chronic cardiac arrhythmia; HTN: arterial hypertension; DM: diabetes mellitus; Sm: smoke; C: hypercholesterolemy; TG: hypertrigliricidemy; CHF: chronic heart failure; O: obesity; S: sedentarism; *atherosclerosis degree: stenosis degree according to
carotid ultrasound; NA: not available; **pg/mL.
Figure 1. Comparison of interleukines 1β, 2 and 10 levels admission between groups 1 and 2.
4500
4000
3500
3000
2500
2000
1500
1000
500
0
me
a
n
(p
g
/mL
)
p=0.805*
p=0.479*
p=0.370*
IL-1β IL-2 IL-10
IL-1β: interleukine 1β: IL-2: interleukine 2: IL-10: interleukine 10: *not statistically significant
References
1. Dávalos A, Toni D, Iweins F, et al. Neurological deterioration in acute ischemic stroke: potential predictors and associated factors in the European cooperative acute stroke study (ECASS) I. Stroke 1999;30:2631-2636.
2. Wang Q, Tang XN, Yenari MA. The inflammatory response in stroke. J Neuroimmunol 2007;184:53-68.
3. Huang J, Upadhyay UM, Tamargo RJ. Inflammation in stroke and focal cerebral ischemia. Surg Neurol 2006;66:232-245.
4. Libby P. Inflammation in atherosclerosis. Nature 2002;420:868-874 5. Emsley HCA, Smith CJ, Gavin CM, et al. Clinical outcome following
acute ischaemic stroke relates to both activation and autoregulatory inhibition of cytokine production. BMC Neurol 2007;7:5.
6. Simi A, Tsakiri N, Wang P, Rothwell NJ. Interleukin-1 and inflammatory neurodegeneration. Biochem Soc Trans 2007;35:1122-1126. 7. van Exel E, Gussekloo J, de Craen AJM, et al. Inflammation and stroke:
the Leiden 85-Plus Study. Stroke 2002;33:1135-1138.
8. Vila N, Castillo J, Dávalos A, et al. Levels of anti-inflammatory cytokines and neurological worsening in acute ischemic stroke. Stroke 2003;34:671-675 9. Hanisch UK, Quirion R. Interleukin-2 as a neuroregulatory cytokine.
Brain Res Brain Res Rev 1995;21:246-284.
10. Goldstein LB, Adams R, Alberts MJ, et al. Primary prevention of ischemic stroke: a guideline from the American Heart Association/ American Stroke Association Stroke Council: cosponsored by the Atherosclerotic Peripheral Vascular Disease Interdisciplinary Working Group; Cardiovascular Nursing Council; Clinical Cardiology Council; Nutrition, Physical Activity, and Metabolism Council; and the Quality of Care and Outcomes Research Interdisciplinary Working Group. Circulation. 2006;113:873-923.
11. Adams HP, Bendixen BH, Kappelle LJ, et al. Classification of subtype of acute ischemic stroke. Definitions for use in a multicenter clinical trial. TOAST. Trial of Org 10172 in Acute Stroke Treatment. Stroke 1993;24:35-41.
12. Sotgiu S, Zanda B, Marchetti B, et al. Inflammatory biomarkers in blood of patients with acute brain ischemia. Eur J Neurol 2006;13:505-513. 13. Tarkowski E, Rosengren L, Blomstrand C, et al. Intrathecal release
of pro- and anti-inflammatory cytokines during stroke. Clin Exp Immunol 1997;110:492-499.
14. Muir KW, Tyrrell P, Sattar N, Warburton E. Inflammation and ischaemic stroke. Curr Opin Neurol 2007;20:334-342.
15. Boutin H, LeFeuvre RA, Horai R, et al. Role of IL-1alpha and IL-1beta in ischemic brain damage. J Neurosci 2001;21:5528-534.
stroke in diferent patients (NIHSS score between two and 36) can in part explain the diversity of the cytokine expres
-sion in our study. Also, the control subjects were not matched for atherosclerosis degree, sex or age. Taken together, these
problems may account for the discrepancy between our data and the other studies where an increase in cytokine levels after stroke is reported2.
Substantial data demonstrate correlation between in-creased levels of IL-1 after ischemia and worsening of infarct severity2,3,14,15. In our study, we did not notice this correlation; however, we did ind a signiicant correlation with IL-10 ex -pression levels and neurological improvement. Our data re-garding IL-10 is supported by other studies8. IL-10 provides a negative feedback mechanism by blocking the monocytes/
macrophage gene transcription to limit the production of
proinlammatory cytokines, IL-6 and TNF-a, intercellular adhe sion molecule-1 (ICAM-1), and matrix metalloproteina-se (MMP). he involvement of IL-10 in the pathophysiology
of ischemic neurological deterioration should be considered with caution, because to our knowledge, there are no studies
deining the level and/or possible efect of IL-10 during neu -rological worsening. If the association between IL-10 levels
and early neurological deterioration is conirmed, it is likely that administration of exogenous IL-10 during acute ische-mic stroke can serve as a therapeutic strategy. hus, this
study gives additional evidence that IL-10 may have a poten-tial role as a neuroprotector following acute ischemic stroke.
NIHSS: National Institutes of Health Stroke Scale.
Figure 2.Distribution pattern of patients from group 1 based on the variations in the NIHSS score during the first 72 h after ischemic stroke onset, upon arrival at the emergency room; improved: patients with reduction in NIHSS score; worsened: patients with increase in the NIHSS score; *not significant; **significant difference between patients with NIHSS score
improvement and those with NIHSS score worsening regarding the IL-10 levels; according to the ROC curve, the cutoff value of IL-10 that represents the best relationship between sensitivity (80%) and specificity (76.2%) is 925.5 pg/mL, i.e., patients with IL-10 higher than this cutoff value tend to have a better outcome during the first 72 h after ischemic stroke onset.
6008
5008
4008
3008
2008
1008
8
7008 6008 5008 4008 3008 2008 1008 8
3508 3008 2508 2008 1508 1008 508 8
IL-1β p=0.073*
IL-2 p=0.648*
IL-10 p=0.040*
925.0
patients with an improved NIHSS score
worsened NIHSS score patients
patients with tendency for improvement
patients with tendency for worsening
p
g
/ml
p
g
/ml
p
g