TECNOLOGY CENTER
CHEMICAL ENGINEERING DEPARTMENT
POS-GRADUATION PROGRAM IN CHEMICAL ENGINEERING RESEARCH GROUP IN SEPARATIONS BY ADSORPTION - GPSA
PEDRO AUGUSTO SILVA DE MOURA
ASSESSING THE POTENTIAL OF ACTIVATED CARBONS FROM POLYETHYLENE TEREPHTHALATE (PET) AS ADSORBENTS TO
SEPARATE CO2 FROM FLUE GAS
PEDRO AUGUSTO SILVA DE MOURA
ASSESSING THE POTENTIAL OF ACTIVATED CARBONS FROM POLYETHYLENE TEREPHTHALATE (PET) AS ADSORBENTS TO SEPARATE
CO2 FROM FLUE GAS
Dissertation submitted to Universidade Federal do Ceará as a requirement to obtain the Master’s Degree in Chemical Engineering.
Supervisor: Profª. Diana Cristina Silva de Azevedo
Co-Supervisor: Dr. Enrique Vilarrasa Garcia
FORTALEZA
PEDRO AUGUSTO SILVA DE MOURA
ASSESSING THE POTENTIAL OF ACTIVATED CARBONS FROM POLYETHYLENE TEREPHTHALATE (PET) AS ADSORBENTS TO SEPARATE
CO2 FROM FLUE GAS
Dissertation submitted to Universidade Federal do Ceará as a requirement to obtain the Master’s Degree in Chemical Engineering.
Supervisor: Profª. Diana Cristina Silva de Azevedo
Co-Supervisor: Dr. Enrique Vilarrasa Garcia
Approved on 16 February 2017
________________________________________
Profª. Diana Cristina Silva de Azevedo Universidade Federal do Ceará
________________________________________
Drª. Débora Aline Soares Maia Universidade Federal do Ceará
________________________________________
Dr. Hugo Leonardo de Brito Buarque
ACKNOWLEDGMENTS
First things first, I would like to thank God for everything.
To my mom’s memory that is always beside me.
To my dad who takes care of me in many aspects of my life, all the time. My brother,
Adroaldo, “Brotherhood is to be the shadow of each other all the time.”
I would like to thank my entire family, especially my grandmother Francisca and grandfather Mourinha.
My supervisors, Profª. Diana and Dr. Enrique, for believing in my capacity, teaching and helping me in both my academic and personal life.
Friends and coworkers from the academy: Thalles, Rômulo, Davi, Débora, Alexandre, Isabela, Breno, Rafael, Edilson, Bruno, Melina, Karine, Santiago, Juliana, Suliene, Caiuã, Randreanne, Lairana, Rafaelle, Giovani, Felipe, Emmanuel, Rafael Siqueira, Zé Wilson, Dani, Rafael Morales, Bianca, Heather, Stuart, Ross, Greta, Charithea, Alícia, Raquel, Maria, Laura, Irma, Hilmar and Antonio that have made every day more pleasant throughout my master degree.
Just as importantly, friends outside the university, that have helped me on many occasions: Paula, Lívio, Felipe, Luciano, Volney, Rafael, Fabrício, Eduardo, Gilson, Allyson, CV, Duda, Vic, Haroldo, Felipe, Hélio Neto, Beto, Cezar, Ray, João Lucas, Mica, Pâmela, Sisi and many others.
Besides that, friendly professors: Moisés, Eurico, Célio, Parra, Conchi, Alírio, Mardônio, Luciana, Enrique and Rílvia from both within and outside my research group for many offerings of advice during my degree.
I would like to thank all people that have contributed directly or indirectly to this work.
“If you don't go after what you want, you'll never have it. If you don’t ask, the answer is always no. If you don't step forward, you're always in the same
place.”
ABSTRACT
The Greenhouse Effect is a serious problem that concerns all countries and a solution to minimize or slow down this effect is mandatory. Increases in temperature and sea water level have caused some relevant impacts that can be felt by most of the world population. Carbon Dioxide (CO2) is claimed as one of the main causes of this effect. Another problem in our society is the increasing production of Polyethylene Terephthalate (PET) polymers along the years, mainly used as soft drink bottles. Post-consumption bottles disposal is a huge problem to the world. The production of activated carbons from PET wastes generates materials with interesting properties for gas adsorption and storage. The aim of this work is to assess the potential of these activated carbons from PET (ACPXs) as adsorbents to separate CO2 from flue gas. ACPXs have an exceptionally high surface area with pore sizes concentrated in a very narrow range (0.5-2 nm) and a hydrophobic surface with nearly no functional groups. Increasing burn-off degrees (22, 41 and 76%) led to adsorbents with a broader pore size distribution (PSD), but all mainly in the range of micropores. Single gas and mixed gas isotherms with CO2 and N2 reveal that the samples have an interesting selectivity for flue gas separation. These adsorbents have a high affinity for CO2, ACPX-76 reaching an adsorption uptake of 6.323 mmol g-1 at 4 bar and 298 K. On the other hand, sample ACPX-22 has a higher narrow microporosity proportion (97.3%), which in turn gives a higher selectivity for CO2 over N2 (15.98 at 4 bar and 298 K). The differential adsorption enthalpy curves are typical of highly microporous samples reaching values close to those found in zeolites (40 kJ mol-1) for low loadings, going down to values only slightly above the neat of condensation of CO2 (17 kJ mol-1) at higher loadings. It was found that the higher the burn-off, the wider the PSD and hence the greatest CO2 capacity may be achieved. Nevertheless, higher CO2/N2 selectivities are found for the less activated sample, which has the lowest burn-off, lowest CO2 uptake and the narrower Pore Size Distribution (PSD). The best trade-off of these parameters (working capacity, selectivity and adsorption enthalpy) was found for sample ACPX-41, with an intermediate burn-off, by comparison of an adsorbent performance indicator (API), as proposed in the literature.
RESUMO
O Efeito Estufa é um grave problema que preocupa todos os países, fazendo-se necessário encontrar uma solução definitiva para minimizar ou desacelerar seu efeito. O aumento da temperatura e do nível dos oceanos são alguns relevantes efeitos que podem ser sentidos por toda a população mundial. A concentração de Dióxido de Carbono (CO2) no ar atmosférico é um dos principais responsáveis por este efeito. Outro grande problema em nossa sociedade, é a alta produção e acúmulo de resíduos de polímeros de Polietileno Tereftalato (PET) nos últimos anos, principalmente, como embalagens para produtos líquidos. A produção de carbonos ativados a partir do PET gera materiais com propriedades interessantes para a adsorção de gases e armazenamento. O objetivo central deste trabalho é avaliar o potencial destes carbonos ativados de PET (ACPX’s) como adsorventes para a captura de CO2 presente em diferentes correntes gasosas, como em gases de combustão. ACPX’s tem altos volume de poro e área superficial com uma estreita distribuição de tamanho dos poros (0,5-2 nm) e uma superfície hidrofóbica, praticamente, sem grupos funcionais. Isotermas mono e multi componentes com CO2 e N2 revelaram uma seletividade interessante para um cenário de separação de gases de pós-combustão. Foram produzidos carbonos ativados em distintas condições de ativação, que
levaram a distintos graus de “burn-off” (22, 41 e 76) e distribuição de tamanho de poros. Estes adsorventes têm uma elevada afinidade para o CO2, ACPX-76 atinge a capacidade de adsorção de 6,323 mmol g -1 a 4 bar e 298 K. Por outro lado, a amostra ACPX-22 tem uma maior proporção de microporosidade estreita (97,3%), Por sua vez, uma maior seletividade para o CO2 em relação a N2 (15,98 a 4 bar e 298 K). A curva de entalpia de adsorção diferencial é típica de amostras altamente microporosas que atingem valores próximos aos encontrados em zeólitas (40 kJ mol-1) para cargas baixas, descendo para valores apenas ligeiramente acima da pura condensação de CO2 (17 kJ mol-1) a cargas mais elevadas. Verificou-se que quanto maior a queima, maior a Distribuição do Tamanho de Poros (PSD) e, portanto, a maior capacidade de CO2 pode ser alcançada. No entanto, maiores seletividades de CO2 / N2 são encontradas para a amostra menos ativada, que tem a menor queima, menor absorção de CO2 e o PSD mais estreito. O melhor comprometimento desses parâmetros (capacidade de trabalho, seletividade e entalpia de adsorção) foi encontrado para a amostra ACPX-41, usando um indicador.
LIST OF FIGURES
Figure 1 - Polyethylene Terephthalate Monomer…..………….…….……….……. 14
Figure 2 - Production of plastic materials (thermoplastics and polyurethanes) and other plastics (thermosets, adhesives, coatings and sealants) ………..….…… 14
Figure 3 - Differential PSDs based on simultaneous fitting the 2D-HS models to both N2 and CO2 isotherms measured for the PC and its activated derivatives: 5, PC-23, PC-39, PC-63 and PC-85. ………..………… 15
Figure 4 - Combustion Flue Gas Scenarios ……….. 18
Figure 5 - Adsorption Process ……….. 18
Figure 6 - Classification of vapor adsorption isotherms combining proposal from IUPAC, linking the relative pressure and adsorbed mass. ………. 20
Figure 7 - Single Gas Magnetic Suspension Balance ………...… 31
Figure 8 - Mixed Gases Magnetic Suspension Balance ……….………..…… 32
Figure 9 - Micro Calorimetry Equipment ………...………..… 34
Figure 10 - Thermo-Gravimetric Analyzes ………..…….. 36
Figure 11 - Infrared Spectroscopies ……….………..……….… 38
Figure 12 - Adsorption/Desorption N2 Isotherms at 77 K .….……….…….………... 39
Figure 13 - Adsorption/Desorption CO2 Isotherms at 273 ……….…..………... 39
Figure 14 - Pore Size Distributions (PSD’s) by N2 Isotherms ……….….……..….… 41
Figure 15 - Pore Size Distributions (PSD’s) by CO2 Isotherms ……….…...….. 41
Figure 16 - Single Components CO2 and N2 Isotherms for ACPX-22, 60 and 76 ….……. 43
Figure 17 - Binary Isotherms 0.12 CO2 and 0.88 N2 Isotherms for ACPX-22, 60 and 76 .. 49
Figure 18 - CO2 Amount Adsorbed Comparison in Single and Binary Isotherms …….… 51
Figure 19 - Selectivity from Mono Components Isotherms CO2 and N2 ……… 52
Figure 20 - Selectivity from Binary Isotherms CO2/N2 ……….…………...…..…... 53
Figure 21 - CO2 Heats of Adsorption for ACPX-22, 41 and 76 ……….…...… 54
Figure 22 - Isosteric Heats of Adsorption for CO2 by Clausius-Clayperon Equation …... 55
Figure 23 - Isosteric Heats of Adsorption for N2 by Clausius-Clayperon Equation ……… 55
LIST OF TABLES
Table 1 - Greenhouse Effect Gases (GEG) ……….………..…….……..… 16
Table 2 - Comparison between Physical and Chemical Adsorption ………..……. 19
Table 3 - Activated Carbons Studies ……….……..…… 21
Table 4 - Mono Component Adsorption Isotherm Models ………….…..…………...… 23
Table 5 - Multi Component Adsorption Isotherm Models ………..……… 23
Table 6 - Gases used in experiments ……….……...………… 29
Table 7 - Obtained ACPX Samples ………...…….. 30
Table 8 - Technical Information of the Mono Component Gas Magnetic Suspension Balance ……….….... 30
Table 9 - Technical Information of the Multi Component Gases Magnetic Suspension Balance ……….……… 32
Table 10 - Thermo-Gravimetric Analyzes ACPX Series ……….………... 37
Table 11 - Elemental Analysis ……….………..…………... 37
Table 12 - Infrared Spectroscopies ……….………... 38
Table 13 - Properties of the Obtained Activated Carbons from N2 and CO2 Isotherms .... 40
Table 14 - Adsorbates Properties ………..… 45
Table 15 - CO2 Langmuir and Sips Models Parameters ………... 46
Table 16 - N2 Langmuir and Sips Models Parameters ……….. 46
Table 17 - Relative Squared Deviation for CO2 Mono Components Isotherms ….…..…. 47
Table 18 - Relative Squared Deviation for N2 Mono Components Isotherms ….………. 47
Table 19 - Adsorption Working Capacities (1—4 bar) for CO2 and N2 for ACPX-22, 41 and 76 ………. 47
Table 20 - Activated Carbons Adsorbed Amount at 4 bar and 298 K ……….. 48
Table 21 - Relative Squared Deviation for Binary Isotherms (0.12 CO2; 0.88 N2) ...…. 50
ABREVIATIONS
NG Natural Gas GHG Greenhouse Gases GRF Global Radiative Force SV Specific Volume
MSB Magnetic Suspension Balance PVOH Polyvinyl Alcohol
PET Polyethylene Terephthalate MEA Mono-ethanolamine
CCS Carbon Capture and Storage
VSA Pressure/ Vacuum Swing Adsorption TSA Temperature Swing Adsorption PSA Pressure Swing Adsorption AC Activated Carbon
TGA Thermo-Gravimetric Analyzes
FT-IR Fourier Transform Infrared Spectroscopy TGA Thermo-Gravimetric Analysis
PSD Pore Size Distribution
2D NLDFT 2D Non-Local Density Functional Theory QSDFT Quenched Solid Density Functional Theory DR Dubinin-Radushkevich
LM Langmuir Model SM Sips Model
BET Brunauer-Emmett-Teller ELM Extended Langmuir Model ESM Extended Sips Model
MRELM Multi-Region Extended Langmuir Model IAST Ideal Adsorbed Solution Theory
IUPAC International Union of Pure and Applied Chemistry MOF Metal Organic Framework
SUMMARY
1 INTRODUCTION AND MOTIVATION ………...….…………. 13
2 LITERATURE REVIEW ……..…………...…..…..………. 14
2.1 Activated carbons from Polyethylene Terephthalate (PET) ………... 14
2.2 Greenhouse Effect and CO2 ………..…………...………... 15
2.2.1 Carbon Capture and Storage (CCS)………..………...….. 16
2.2.2 F lue Gas and CO2………...………..…...………… 17
2.3 Adsorption ………..……….……… 18
2.3.1 Adsorption Isotherms………..……….…...……….…… 19
2.3.2 Adsorbents and Activated Carbons………….…………..………….…..… 21
2.3.3 Enthalpy of Adsorption………..……….…………....……... 22
2.3.4 Adsorption Equilibrium Models………..…….…………..…………. 22
2.3.5 Excess and Absolute Mass……….….….……..……….….…… 25
2.3.6 Surface Area and Pore Volume………...……….…….……….. 26
2.3.7 Selectivity………..….……….. 28
2.3.8 Working Capacity………...….………..……….. 28
2.3.9 Adsorbents Performance Indicator – API………..…...…….. 28
3 EXPERIMENTAL ……….………….……….…..…...…………. 29
3.1 Materials ……….………..………..… 29
3.1.1 Gases……….………..…………...…..…… 29
3.1.2 Adsorbents……...…………...……….…………..…..… 29
3.2 Methods ………..……….……… 30
3.2.1 Adsorbents Characterization………...…………..……… 30
3.2.2 Pure gas Isotherms……….………...……… 30
3.2.3 Mixed gas Isotherms……… 32
3.2.4 Adsorption Microcalorimetry……….………. 33
4 RESULTS AND DISCUSSION ……….……….…...…… 35
4.1 Textural Characteristics ……….……...… 35
4.2 Pure Gas Component Isotherms .………....….…..…… 42
4.3 Binary Gases Components Isotherms .……….…………...………..…… 48
4.4 Selectivity ………...………..………..…….……… 52
4.5 Enthalpies of Adsorption ..……….….….…..… 53
4.6 Adsorbent Performance Indicator – API …….….….….….….………… 55
5 CONCLUSION ……….……….…..……...… 58
6 SUGGESTIONS FOR FUTURE WORK …....…….…………...….…… 59
CHAPTER 1 – INTRODUCTION AND MOTIVATION
Life on earth may adjust to a temperature increase of 2 °C, approximately, but gas emissions have been rising steadily every year. Carbon Dioxide (CO2) is claimed as one of the main causes of this effect (IPCC, 2014).
Several techniques have been developed to capture CO2 from stationary emission points. Absorption, selective membrane permeation and cryogenic processes are some of them, but drawbacks, such as energy requirements, prevent their wide-spread use (THITAKAMOL; VEAWAB, 2009). Adsorption processes seem to be a promising alternative to reduce the CO2 emission, due to low energy requirements and fast kinetics if a physisorbent with adequate capacity is found (RITTER, J.A., EBNER, 2009).
Another important environmental problem in the world is the amount of polyethylene terephthalate (PET) waste. The extensive use of this polymer in packages is due to its easy production and excellent water barrier properties, flexibility and thermal insulation. Oxygen permeability may be further reduced with an additional layer of polyvinyl alcohol (PVOH). Physical characteristics, such as transparency, semi- crystallinity, flexibility and high resistance to impact are excellent qualities for its use (BUNN, 1954).Present in several different products, particularly as soft drinks bottles and PET films, PET waste is nowadays a relevant environmental problem. Its consumption keeps rising and handling this material after consumption has become a major concern. Different solutions have been proposed for PET waste, such as recycling, incineration and disposal in landfills. Recycling is not enough to account for the generation of PET waste produced in the world. Incineration releases unwanted gases, such as CO2, to the atmosphere. Disposal in landfills is the easiest and cheapest solution and has become the most common choice around the world. On other hand, this alternative has some disadvantages, such as atmospheric air pollution and contamination of underground aquifers.
CHAPTER 2 – LITERATURE REVIEW
2.1. ACTIVATED CARBONS FROM POLYETHYLENE TEREPHTHALATE (PET)
Dickson and Whinfield (USA) patented PET in 1941 (REX et al., 1961). Polyethylene Terephthalate (PET) is a crystalline thermoplastic polymer, which in natural state is a colorless resin. Crystal density is about 1.455 g cm-3. The polymer has a high melting point (264 °C), due to rigid aromatic rings (Figure 1) (BUNN, 1954).
Figure 1. Polyethylene Terephthalate Monomer
Source: (BUNN, 1954)
X
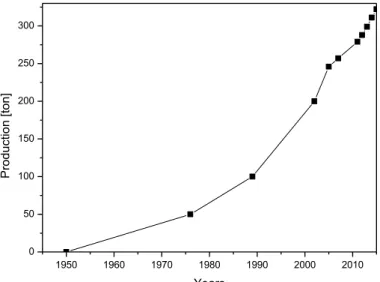
PET polymers production has increased along the years, mainly used as soft drinks bottles. Post-consumption bottles disposal is a huge problem to the world. The nearly exponential increase in world production of thermoplastics, polyurethanes, thermosets, elastomers, adhesives, coatings, sealants and PP-fibers along the last 60 years is illustrated in Figure 2. A friendly solution to the environment for the amount polymers already produced has to be done.
Figure 2. Production of plastic materials (thermoplastics and polyurethanes) and other
plastics (thermosets, adhesives, coatings and sealants).
1950 1960 1970 1980 1990 2000 2010 0
50 100 150 200 250 300
Pro
d
u
ct
io
n
[
to
n
]
Years
Some of the solutions for plastics disposal in several countries are recycling and incineration. Using post-consumption soft-bottles as a substrate for activated carbon production through pyrolysis at around 1273 K is an interesting option, which has been addressed by some authors since 1997 (BLAZSÓ, 1997; PARRA et al., 2004b).
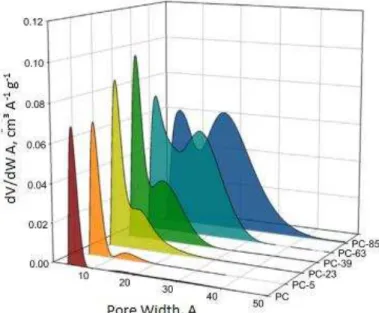
The production of activated carbons from PET generates materials with a high surface area and pore volume. The procedure involves four steps: (1) collection of similar materials with no impurities; (2) size reduction and sieving down to 0.5—1.0 mm particles; (3) pyrolysis at 1198 K under nitrogen atmosphere for 1 h to obtain the char; and (4) char activation with a carbon dioxide flow of 10 ml min-1 (PARRA et al., 2002, 2006, 2004a). By varying the activation time, samples of activated carbon with different textural properties may be obtained. The time of activation has a direct influence on the degree of burn-off (i.e. 720 min—2880 min), which in turn, affects the porosity. The pore size distributions (PSDs) obtained for different activation degree has been studied by (JAGIELLO et al., 2015) and is reproduced Figure 3. It is interesting to know how these different PSDs, within the micropore range, affect the working capacity, selectivity and adsorption enthalpy for a given gas separation or storage process.
Figure 3. Differential PSDs based on simultaneous fitting the 2D-HS models to both N2 and
CO2 isotherms measured for the PC and its activated derivatives: PC-5, PC-23, PC-39, PC-63
and PC-85.
Source: Jagiello et al. 2015
2.2. GREENHOUSE EFFECT AND CO2
on the earth surface. The problem is the intensification of this effect. Among all gases that contribute to global warming, three GHG deserve attention: carbon dioxide (CO2), methane (CH4) and nitrous oxide (N2O). These gases are able to absorb and reissue infrared radiation (wavelength between 0.7 μm—100 μm) emitted by the sun. Apart from that, these gases have a high residence time in the atmosphere. (ESSENHIGH, 2009)
The main GHGs, their residence time in the atmosphere and their Global Radiative Forcing (GRF) are listed in Table 1. GRF refers to interference caused in equilibrium of temperature. Positive or negative coefficients mean warming or cooling the troposphere, respectively.
Table 1. Greenhouse Effect Gases (GEG)
Gases Residence Time [years] GRF [Watts m-2]
CO2 100 1.909
CH4 10 0.500
N2O 170 0.187
Source: (BUTLER, et al., 2015)
N2O has the largest residence time, but a low GRF. CH4 has an intermediate residence time and GRF, analyzing these parameters CH4 was expected to have a moderate influence in global warming. In turn, CO2 has a high reissue radiation and an intermediate residence time, so it is considered the most concerning GHG (ESSENHIGH, 2009; IPCC, 2014; KRUPA; KICKERT, 1989; SERREZE, 2010).
2.2.1. CARBON CAPTURE AND STORAGE (CCS)
Carbon Capture and Storage (CCS) processes are being developed aiming to capture CO2 from its emission point, compress, transport and store it indefinitely. In several processes, the capture step accounts for around 75 % of the total cost (FIGUEROA et al., 2008). The most common CO2 emission scenarios are natural gas pre and post combustion gas, in which cases, the other main competing gases are CH4 and N2, respectively (GARG; SHUKLA, 2009; PRAETORIUS; SCHUMACHER, 2009).
Adsorption is one of the capture technologies that may be used in CCS process. Besides, absorption, cryogenic distillation and membrane separations are other competing technologies (BAE et al., 2008).
secondary problems are foam formation and amine degradation caused by sulfur dioxide (SO2), nitrogen dioxide (NO2), hydrochloric acid (HCl), hydrofluoric acid (HF) and oxygen (O2).
Membranes made of carbon, polymers and inorganic components have also been studied for CO2 separation from gas streams (KOROS; FLEMING, 1993; SANDRU; HAUKEBØ; HÄGG, 2010; SHEKHAWAT, 2003). Unlike absorption, a chemical as separation agent is not required and hence membranes have low maintenance cost (Ritter, J.A. and Ebner 2009). Their main disadvantages is fouling, particularly due to heavy hydrocarbons, causing sometimes irreversible damage (Ritter, J.A. and Ebner 2009; Sandru et al. 2010). Furthermore, they tend not to be efficient for high output pressures (YANG et al., 2008). Selective permeation in membranes is largely used to separate O2, N2 and CH4, mainly when present in an atmosphere containing gases with larger diameters, as CO2 and H2S (SHEKHAWAT, 2003).
Cryogenic distillation separates gases with different vapor pressures at low temperatures. There is no need of chemical compounds, adsorbents or high pressure (DE STEFANI; BABA-AHMED; RICHON, 2003; TUINIER et al., 2010). However, there is a high energy consumption, pipes tend to clog with solidification of CO2 and heat loses may be a problem (TUINIER et al., 2010).
If compared to these technologies, gas adsorption potentially requires less energy input. The adsorbent may be reused in cycles upon changes in pressure (VSA), temperature (TSA) or concentration (Concentration Swing Adsorption – CSA) (WONG; BIOLETTI, 2002).
2.2.2. FLUE GASES AND CO2
CO2 emissions linked to energy generation by fuel combustion may be found in three different scenarios: pre-combustion, oxy-combustion and post-combustion. Schematically the three emission scenarios are shown in Figure 4. Post-Combustion is the most commonly found scenario in thermo-electric energy generation. Fuels are burned with atmospheric air and N2 and CO2 are the major effluent gases (flue gas), besides water vapor (KANNICHE et al., 2010). Pre-Combustion involves gasifying the fuel to synthesis gas (CO2 + H2) prior to hydrogen combustion and energy conversion. The combustion effluent is only water, which is a clear advantage. However, this requires changing the energy vector from carbon to hydrogen. Oxy-Combustion consists in burning fuels with pure O2 so that the combustion products are only water vapor and CO2, which may be readily separated by condensation. However, in the absence of nitrogen, combustion temperature would be extremely high and current thermo-electric plant equipment would not withstand such conditions.
Figure 4. Combustion Flue Gas Scenarios
Source:(VASEGHI; AMIRI; PESARAN, 2012) 2.3. ADSORPTION
One of the most common application of adsorption in everyday life is odor removal inside refrigerators by volatile compounds released by food decomposition.The compounds responsible for odor “adhere” to the char surface at low temperatures. Adsorption is hence defined as the spontaneous concentration of molecules from a fluid at the vicinity of an interface (Figure 5), usually between a solid and a fluid, due to unbalanced forces at the surface. This definition is restricted to physisorption, which is an exothermic and reversible process. The free fluid that is named the adsorptive, the molecules concentrated on the surface is the adsorbate and the adsorbent is the solid surface. Desorption is the opposite process of molecules concentration in adsorbent surface.
Adsorption can be classified in two types: physisorption and chemisorption. Physisorption or physical adsorption involves weak interactions between adsorbate and adsorbent, such as electrostatic interactions and van der Waals forces. Chemisorption or chemical adsorption, on the other hand, is characterized by strong interactions between adsorbate and adsorbent, such as covalent bonding, heats of adsorption being in the order of magnitude of that of chemical reactions. Some other characteristics are summarized in Table 2 (SING; ROUQUEROL; ROUQUEROL, 2014).
Table 2. Comparison between Physical and Chemical Adsorption
Characteristic Physical Adsorption Chemical Adsorption Adsorption Enthalpy 1 - 15 kcal mol-1 9.5 - 95 kcal mol-1 Adsorbate-adsorbent
Interactions
Van Der Waals Bonds; Electrostatic Bonds
Covalent Bonds
Temperatures Low Temperatures Wide range of Temperatures Number of adsorbed
Layers
Mono and Multi Mono
Kinetics Fast and Reversible Slow and Irreversible Source: (Ruthven, 1984).
2.3.1. ADSORPTION ISOTHERMS
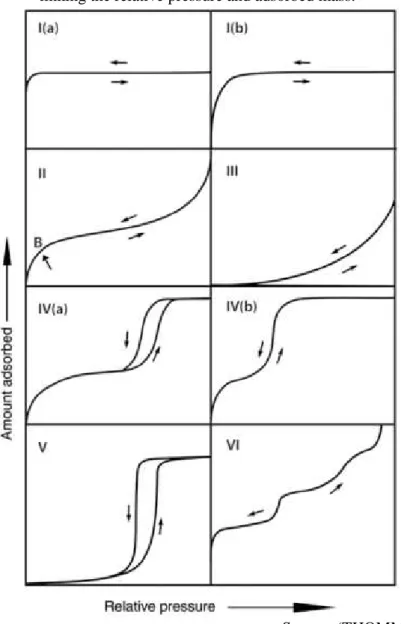
Adsorption equilibrium data is represented by isotherms or isobars, which describe adsorbed phase concentration (g or mol per unit mass adsorbent) as a function of temperature and pressure. Brunauer, Deming and Teller proposed the BDDT classification with five types of isotherms (BRUNAUER et al., 1940). Later, a sixth category was identified (SING et al., 1985). The International Union of Pure and Applied Chemistry (IUPAC) has recently defined six isotherms categories (THOMMES et al., 2015), which are shown in Figure 6.
and emptying in mesopores. Type VI isotherms is associated with layer-by-layer adsorption in very homogeneous materials. It is a relatively rare isotherm.
Figure 6. Classification of vapor adsorption isotherms combining proposal from IUPAC,
linking the relative pressure and adsorbed mass.
Source: (THOMMES et al., 2015)
Convenient application of equilibrium models to the adsorption isotherms of probe gases (such as N2 at 77K) allows for the determination of important textural features of the adsorbent, such as pore volume, specific surface area, PSD and average pore size. With respect to pore sizes, solids are also classified in three types according to IUPAC:
Micropores: pore sizes below 2 nm;
Mesopores: pore sizes between 2 nm and 50 nm;
2.3.2. ADSORBENTS AND ACTIVATED CARBONS
Adsorbents for gas separation or storage/delivery by physisorption must have a number of desirable features:
- Predominantly microporous, because gas molecules are small and only sufficiently narrow pores would provide potential for significant adsorption; - High surface area, to allow for high adsorption capacity and hence more compact
adsorbers;
- Nearly hydrophobic surface, so that the main retention mechanism are weak van der Waals forces. This allows for reversible fast adsorbent regeneration with low energy requirements;
- Good mechanical resistance and suitable particle (grain) size to avoid high pressure drops in adsorption columns;
- Good selectivity of the target adsorbate with respect to other gases, in the case of separation/purification.
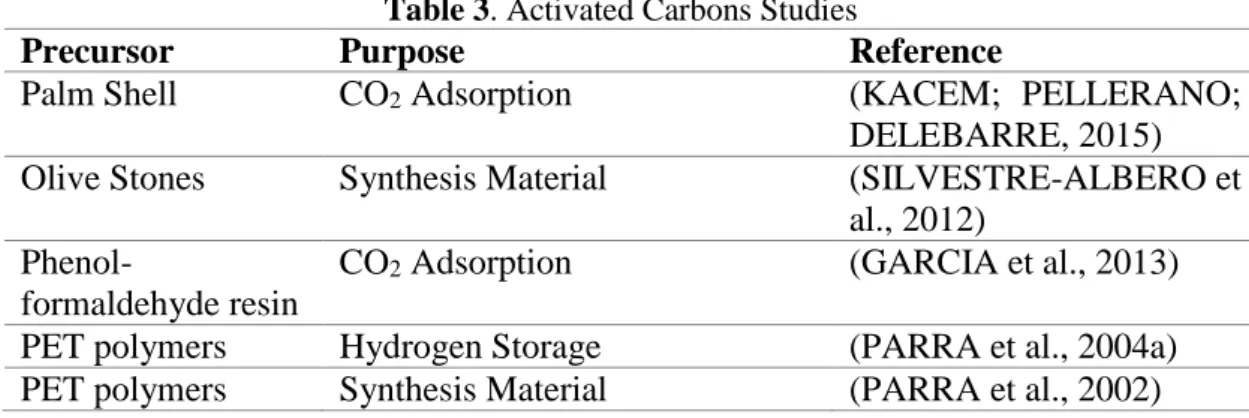
All of these characteristics may potentially be found in activated carbons, depending on their starting material and activation mode. Activated Carbons (AC) have an amorphous structure, which is generally accepted to be composed of randomly packed graphene sheets, which generate a network of slit-like pores. It can be produced from several raw materials, such as coconut shells, anthracite, peach/olive stones and wood (ALBANEZ, 2008). In Brazil, bituminous carbon, wood and coconut shells are the most widely used precursos (DI BERNARDO, 2005). The annual production is about 1,437 million tons in 2014 (MARKET, 2017) in different industrial applications, e.g. adsorbent, catalyst or catalyst support for gas and liquid (KIM; KANG, 2008). Pyrolysis is the most common method to prepare these adsorbents at temperatures lower than 1273 K. In this process most of non-carbon elements are volatilized, e.g. oxygen, nitrogen and sulfur compounds. After that, a physical or chemical activation procedure is used to increase the adsorption capacity. The activation procedure involves particle size, chemical agents and method of mixing to obtain a specific activated carbon. Several activated carbon sources are shown in Table 3.
Table 3. Activated Carbons Studies
Precursor Purpose Reference
Palm Shell CO2 Adsorption (KACEM; PELLERANO; DELEBARRE, 2015) Olive Stones Synthesis Material (SILVESTRE-ALBERO et
al., 2012)
Phenol-formaldehyde resin
CO2 Adsorption (GARCIA et al., 2013)
2.3.3. ENTHALPY OF ADSORPTION
Adsorption calorimetry is a thermodynamic technique that allows the direct measurement of the total heat released during the adsorption process (WADSÖ, 1997). Overall, calorimetry is a tool of high accuracy and precision to characterize adsorbents and surface phenomena. One of the drawbacks of this widespread technique is the need to develop tailor-made equipment for a given phenomenon (reaction, dissolution, adsorption, etc.). One must also take into account that the adsorption energy measured by these devices is the sum of the fluid-fluid and fluid-solid interactions.
Physisorption is exothermic with heat transfer from the adsorbed phase to the surrounding fluid. Thermal effects are important to predict and to handle bed heating and cooling upon adsorption and desorption cycles, respectively. By measuring the evolved adsorption heat as a function of the adsorbed phase concentration, one can also investigate the heterogeneities of the solid surface (DUNNE et al., 1996; ROUQUEROL et al., 2014). A decrease in the differential heat of adsorption as the adsorbed phase concentration increases is common for heterogeneous solid, whereas a constant adsorption enthalpy for increasing adsorbed phase concentration is characteristic of homogeneous surfaces (LLEWELLYN, 2000). These heat curves may be measured directly, with the aid of a micro-calorimeter, or indirectly from equilibrium adsorption data measured at various temperatures, the so-called isosteric enthalpy of adsorption.
The isosteric enthalpy of adsorption (∆H) may be calculated from Clausius-Clapeyron Equation (Equation 2.1). By plotting ln versus
�, the slope gives ∆ / .
∆ = − ∙ � ln
� ⁄ (2.1)
2.3.4. ADSORPTION EQUILIBRIUM MODELS
Table 4. Mono Component Adsorption Isotherm Models
Isotherm Model Equation
Henry or Linear = ∙ (2.2)
Langmuir (LM)
= á+ ∙∙ ∙ (2.3)
Sips (SM)
= ∞+ � ∙∙ � ∙ (2.4)
Freundlich = � ∙ / (2.5)
Toth
= + � ∙á ∙ � ∙ / (2.6)
Brunauer-Emmett – Teller (BET) =
°
[ + −
° ] ∙ [ − ° ]
(2.7)
Table 5. Multi Component Adsorption Isotherm Models
Isotherm Model Equation Extended Langmuir
(ELM) =
á ∙ ∙
+ ∙ + ∙
(2.8)
Extended Sips
(ESM) =
∞ ∙ � ∙
+ � ∙ + (� ∙ )
(2.9)
Multi-Region Extended Langmuir
(MRELM)
= + ∙ + ∙ +á ∙ ∙ á −+ ∙á ∙ ∙
= + ∙ + ∙á ∙ ∙
(2.10)
Ideal Adsorbed Solution Theory
(IAST)
∗= ∙ ln + ∙ (2.11)
Some models have thermodynamic inconsistencies. For instance, in Toth and Freundlich models, when pressure tends to zero, the isotherm equation does not reduce
to Henry’s Law (Equation 2.13) (TÓTH, 2003).
log → / = (2.12)
adsorption sites; and ( ) expresses the magnitude of the interaction between adsorbate and adsorbent.
The SM (Equation 2.4) is an extension of LM. It includes an additional parameter
‘C’, which accounts for the heterogeneity of the adsorbent surface (MYERS; PRAUSNITZ, 1965). Hence, this equation includes three parameters: parameters related to maximum adsorbed quantity ( ∞ ); interaction between adsorbed particles (�) and heterogeneous sample surface ( )that is a characteristic of a given adsorbent.
The Freundlich Model (Equation 2.5) is the most empirical model attempting to describe adsorption on a heterogeneous adsorbent surface. The parameter ( ) qualifies the adsorbent heterogeneity and commonly admits values higher than unity. Toth Model (Equation 2.6) is an empiric model that can be applied for a wide pressure range. The ( ) parameter accounts for the heterogeneity of the sites (TÓTH, 2002).
The BET Model (Equation 2.7) (BRUNAUER et al., 1940) also assumes an energetically homogeneous surface, but take into account the formation of multiple adsorbed layers. The first adsorbed molecules helps the formation of a second layer, providing an adsorption site and so forth. From the second and subsequent layers, the adsorbed molecules behave as a saturated liquid. The parameter ( ) represents the equilibrium absorbed concentration; ( ) is the adsorbed concentration in a monolayer; ( ) is exponentially related to E1 (the first-layer adsorption); ( ⁄ °) is the relative pressure.
The ELM (Equation 2.8), follows a similar concept as LM, but applied to multicomponent adsorption. All parameters ( , , , ) are those measured
from single component isotherms. Extended Sips Model (Equation 2.9) is analogous to its version for mono-component model. Both ELM and ESM are based on the adsorbed concentration of each component of a mixture as a function of the partial pressures of all components present at a given temperature. They are, normally used in binary atmosphere with CO2, CH4 and N2, due to their reasonable accuracy and simplicity. Nevertheless, their accuracy in the prediction of multicomponent adsorption relies heavily on good measurements of single-component isotherms.
The Multi-Region Extended Langmuir (Equation 2.10) is a model that has the main difference in the existence of two different pores in the material surface. One of them, adsorb both adsorbates, but the other adsorbent site only adsorb the most affinity adsorbate. Other important fact is the presence of á in amount adsorbed of i and j estimation, due to a majority physisorption, so the sites into the material are almost the same, which in turn causes the same maximum adsorbed in both adsorbates (VILARRASA-GARCÍA et al., 2015). IAST (MYERS; PRAUSNITZ, 1965) (Equation 2.11) is used to predict multi-components isotherms, using parameters from mono-components isotherms. In opposition to the other models, an analytical solution is not possible for IAST. This model has a high dependence for spreading pressure and adsorbed mass estimations at low pressures (MYERS; PRAUSNITZ, 1965).
% = ∑ , − ,
, ∙
�
=
(2.13)
2.3.5. EXCESS AND ABSOLUTE MASS
The definition for excess mass is all mass variation obtaining in the sample due to the adsorption. The adsorbate not adsorbed in the pores, just compressed into it, do not count for mass variations, so it is not measured. The devices normally only measure the excess mass, so some calculations are necessary. The absolute mass considers the adsorbates, not just adsorbed, but also compressed into the pores.
It is useful distinguish between excess and absolute adsorbed concentrations. Absolute adsorbed concentration is the total amount of sorbate (per unit mass adsorbent) contained in the adsorbed phase volume. Excess adsorbed concentrations is the amount of sorbate (per unit mass adsorbent) that exceeds the concentration to be excepted for a free fluid in given conditions of temperature and pressure. Because it is practically impossible to define the exact volume of the adsorbed phase, it is excess adsorbed concentration, which is actually measured in experimental devices. Additionally, in a gravimetric device, mass variations of an adsorbent are also subject to buoyancy forces acting on the solid and other suspended parts of the equipment. Therefore, excess adsorption ( ) may be measured from mass variations (∆ ) measured according to Equation 2.14 (DREISBACH; STAUDT; KELLER, 1999), where the second term on the right-hand side of the equation accounts for the buoyancy effects.
∆ = − � + (2.14)
Where (∆ ) is the mass variation per unit mass adsorbent is the excess adsorbed concentration; ( �) is gas phase density, ( ) is the volume of suspended parts inside the measuring chamber and ( ) is the adsorbent solid volume. In order to estimate the absolute adsorbed concentration, the amount of compressed gas present in the adsorbed phase volume should be added to the excess adsorbed concentration as in (Equation 2.15) (MURATA; KANEKO, 2001).
= + � ∙∙ (2.15)
estimated, according to some sound assumptions. For microporous adsorbents, it may be assumed the adsorbed phase volume is the specific pore volume (Equation 2.16) (QUIRKE; TENNISON, 1996).
= (2.16)
2.3.6. SURFACE AREA AND PORE VOLUME
SURFACE AREA
In order to calculate the specific surface area from adsorption/desorption isotherms of probe molecules at their saturation temperature (e.g., N2 at 77K), the BET Model (Equation 2.7) is commonly applied. The superficial area estimation comes from the total molecules adsorbed in the monolayer. The model equation is generally rearranged as in
(Equation 2.17). By plotting ( � �°)
[ −(�°�)] vs. ° in a sufficiently low pressure range, a
straight line is to be expected. The slope − and the intercept is . The BET
method can be applied in a pressure range of relative pressure from 0.05 to 0.35. Since is the number of mols to cover a monolayer, if the cross section of the probe molecule is known (�), it is possible to estimate the surface area ( ��) using Equation 2.18 (SING et al., 2014), where Avogadro Number (AN) (6. ∙ − ).
°
[ −
° ]
=
+ ( − ) (
°)
(2.17) �� = ∙ � ∙ (2.18)
TOTAL PORE VOLUME
The total pore volume is estimated using Equation 2.19, where ( 2) is the
adsorbed concentration at a relative pressure
° equal 0,99. At this relative pressure is assumed that all pores are filled with liquid adsorbate (THOMMES et al., 2015). In Equation 2.19, (MM) is the molar mass of N2 and ( 2) is the density of liquid N2.
= 2∙ 2
2
MICROPORE VOLUME
The micropore volume is the pores whose diameters are in the range of 0.5 < d < 2.0 nm. It can be defined by the volume found from Dubinin-Stoeckli method (DS) (DUBININ; STOECKLI, 1980) that is similar to Dubinin-Radushkevich considering a surface of different pores structures. (Equation 2.20), where W is the total pore volume and B is the structural constant.
= ∫∞ ∙ exp{− �} (2.20)
PORE SIZE DISTRIBUTION (PSD)
The PSD is one of the main properties of a physisorbent intended for gas separation/purification and storage. Besides that, ideal PSD obtained from theoretical calculations are useful in developing new adsorbents. N2 isotherms at 77 K are usually used to extract the PSD, although at this temperature, N2 molecules tend to diffuse slowly and equilibrium may not be reached in reasonable time for ultramicropores. In order to overcome this problem, CO2 isotherms at 273 K are commonly used to assess the narrow micropores (RODRIGUEZ-REINOSO, F., LINARES-SOLANO, 1988)
The PSD can be estimated using methods as 2D Non-Local Density Functional Theory (2D NL-DFT) (JAGIELLO et al., 2015). The 2D NLDFT considers the fluid structure close to narrow micropores and mesopores. In addition, it quantifies the adsorption from intermolecular potentials of interactions between fluid-fluid and solid-fluid. From Equation 2.21, it is related the theoretical microscopic adsorption and the experimental adsorption isotherm.
= ∫ �� ( , �) � � (2.21)
Where, �
2.3.7. SELECTIVITY
The selectivity is an important characteristic of an adsorbent in gas separations. It quantifies the adsorbent preference to adsorb a gas instead of another. This parameter can be defined by different ways. The capacity to adsorb CO2 preferentially to N2 is important for industrial applications from mono-components isotherms the selectivity is defined as the division between masses. From binary isotherms, the selectivity is defined using the binary model that better adjust the isotherms, calculated using Equation 2.22.
/ = ∙ (2.22)
2.3.8. WORKING CAPACITY
The working capacity (WC) is defined as the difference between the adsorption capacities at two specific working pressures. It is important to be considered in cyclic processes based on pressure swings to regenerate and reuse the adsorbent. For instance, if one assumes that the adsorption step is carried out at 4 bar and the dessorption step at 1 bar, the working capacity is calculated as Equation 2.23.
− = [ ] − [ ] (2.23)
2.3.9. ADSORBENT PERFORMANCE INDICATOR – API
In order to compare adsorbents indicated for a given gas separation/ purification, a performance indicator has been suggested in the literature (WIERSUM et al., 2013) (Equation 2.24).
= �, −∆ ∙ (2.24)
CHAPTER 3 – EXPERIMENTAL
3.1. MATERIALS
3.1.1. GASES
Three different gases were used, two of them were adsorbates and helium (He) line was used for calibration procedures. They were supplied by White Martins Praxair Inc. (Brazil) under the purities shown in Table 6.
Table 6. Gases used in experiments
Gas Chemical Formula
Purity Molar Mass [g mol-1]
Characteristics Helium He 99.999 4.00 Inert and Non-
flammable Nitrogen N2 99.999 28.01 Non- flammable
and Non- Toxic Carbon
Dioxide
CO2 99.800 44.01 Non- flammable and Toxic
3.1.2. ADSORBENTS
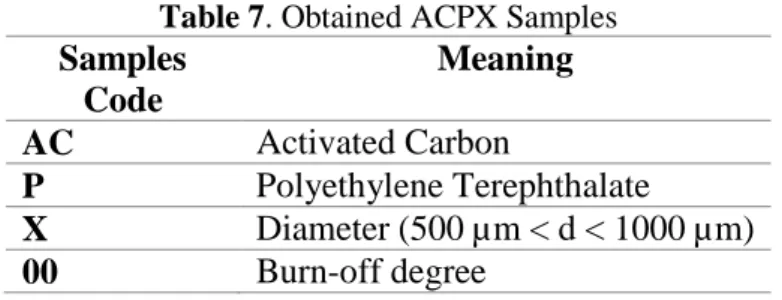
All experiments were carried out with activated carbons samples obtained from polyethylene terephthalate. Activated carbons obtained using the procedure according to that described in the literature (PARRA et al., 2002, 2004a). They were labeled as ACPX-22, ACPX-41 and ACPX-76, according to the key given in Table 7. Briefly, all the activated carbon samples by the pyrolysis of PET at 998.15 K for 2 hours under nitrogen atmosphere so as to form char. Then, the char was activated under CO2 flow (10 mL min -1 for an averagechar mass of 5 g)at 1198 K for 24 h, 36 h and 72 h, respectively.
The burn0off degree is calculated using the mass variation at activation process (Equation 3.1).
= − (3.1)
Table 7. Obtained ACPX Samples
Samples Code
Meaning AC Activated Carbon
P Polyethylene Terephthalate
X Diameter (500 µm < d < 1000 µm) 00 Burn-off degree
3.2. METHODS
3.2.1. ADSORBENTS CHARACTERIZATION
All ACPX samples were characterized regarding their thermal degradation properties, surface functional groups and textural features.
Thermo-Gravimetric Analyses (TGA) were performed in a TGA/DTA Setaram Instrumental Setsys 16/18 model, coupled to a mass spectrometer, ThermoStar, by Pfeiffer, model. The experiments were carried out under nitrogen flux (16 mL min-1) and in the range of room temperature (298 K) to 1273 K at a heating rate of 10 K min-1 to obtain the regeneration temperature. Approximately 10 mg sample was loaded in a sample port made of alumina. Textural characteristics of the sample were obtained from N2 and CO2 adsorption/desorption isotherms at 77 K and 273 K, respectively using ASAP 2020 and TriStar models, Micromeritics Instrumental, U.S.A, respectively. Prior to N2 adsorption, the sample was degassed at 423 K and (10-3 - 10-4 mbar) for 5 hours. Fourier Transform Infrared Spectroscopy (FT-IR) was performed in a Nicolet 6700 FTIR Thermo Scientific Spectrophotometer (128 scans with resolution of 4 cm-1). The sample was previously pressed (pressure 5 ton cm-2) in the form of tablets, using KBr at amass ratio sample: KBr of 0.25 wt. %. Elemental Analyses (C, H, N) was carried out in LECO CHNS-932 (ASTM D-5373), (S) was carried out in LECOS-144DR (ASTM D-4239) and (O) was carried out in LECO VTF-900 CHNS-932 microanalysers. Both experiments, FT-IR and Elemental Analyses are important experiments to characterize all element sand bonds at adsorbent surface.
3.2.2. PURE GAS ISOTHERMS
of the mono component gas magnetic suspension balance is shown in Figure 7. A summary of the instrument specifications may be found in Table 8.
Table 8. Technical Information of the Mono Component Gas Magnetic Suspension Balance
Characteristics Range Sample Mass 0 – 25 mg Reproducibility ±0.02 mg Resolution 0.01 mg Uncertain < 0.002% Pressure 0 – 15 MPa Temperature 285 – 773 K
The experimental procedure to measure a single gas adsorption isotherms comprises four steps:
1. Blank Test: The main objective of this experiment is to determine port-sample volume (Vb) and mass. In this experiment, there is no adsorbent inside the nmeasument chamber and helium doses are injected in the system so as to increase pressure stepwise. Helium is as inert gas, therefore a plot of gas density [g cm-3] versus mass variation [g], according to Equation (2.14) should give a straight line, with slope equal sample-port volume [cm-3].
2. Sample Degassing: In this step, the adsorbent sample is placed in sample port and heated under vacuum (10-3 mbar) until 423 K, as defined from TGA characterization, for 5 hours The objective of this step is to desorb humidity and previously adsorbed gases.
3. le Specific Volume (He): After degassing, the sample specific volume (Vs) may be determined in a similar way as the blank test. Helium is injected stepwise and the slope of the plot of gas density [g cm-3] versus Mass variation [g] gives the sum of specific solid volume [cm3 g-1] and Vb, according to Equation (2.14).
Figure 7. Single Gas Magnetic Suspension Balance
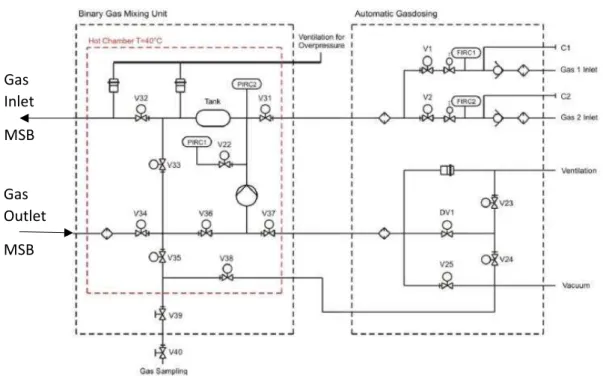
3.2.3. MIXED GASES ISOTHERMS
A multi component MSB was used to measure mixed gas adsorption equilibria. It is similar to mono component MSB in many aspects. The main difference is the dosing system to define binary composition of gases, which flow continuously through the measuring chamber. In this system, it is possible to mix gases in different compositions, so as to predict different scenarios. The main features of the instrument are summarize in Table 9. A schematic view of the instrument is shown in Figure 8 (DREISBACH; STAUDT; KELLER, 1999).
Table 9. Technical Information of the Multi Component Gases MSB
Characteristics Range Sample Mass 0 – 25 mg Reproducibility ±0.03 mg Resolution 0.01 mg Uncertain < 0.002% Pressure 0 – 35 MPa Temperature 285- 673 K
Figure 8. Mixed Gases MSB
3.2.5. ADSORPTION MICROCALORIMETRY
To measure the differential enthalpy of adsorption of CO2 as function of loading a Tian-Calvet microcalorimeter (model C80-Setaram, France) was used (Figure 9). It is important to note that each chamber is lined with a thermopile setup that was factory calibrated by the supplier (Setaram). The microcalorimeter was connected to an adsorption manometric setup to allow for the simultaneous measurement of the adsorption isotherm and differential enthalpy curve. All volumes in the manometric setup were previously determined by He expansion experiments.
The experimental procedure can be summarized in three steps:
1. After inserting the ACPX sample inside the measuring chamber, it was degassed (10-6 bar) and heated up to 423 K, for 6 h, in order to remove humidity and weakly adsorbed gases.
2. Then, a known amount of adsorbate gas is injected into the manometric setup. Pressure variations are recorded and used to calculate the adsorbed phase concentration, as in Equation 3.1 (ROUQUEROL et al., 2014).
= − (3.1)
Gas Inlet MSB
Where, is the number of moles adsorbed, Pdos is the injection pressure, Vdosis
the gas volume dosed into the system, Tdos is the temperature of the dosed gas, R is the
Ideal Gas Constant, Peq is the equilibrium pressure, Vtotal is the system and injected gas
volumes and Teq is the equilibrium temperature. Simultaneously, the thermopile setup
measures the released heat due to the adsorption process, as a calorimetric peak. The area under the peak may be converted to energy (kJ) units and then to adsorption enthalpy, as in Equation 3.2.
∆ �, = ( �)
�, + ( � )�,
(3.2)
Where, ∆ �, is the differential adsorption enthalpy; is the dead volume of the calorimetric cell; is the pressure difference; � is the amount adsorbed given the pressure increase and is the released heat measured by the calorimeter.
3. New gas injections are performed so that gas pressure increases stepwise inside the manometric setup. For each gas injection, differential heats of adsorption and adsorbed phase concentration are calculated as in step 2; the data is treated by Calisto® Software (v1.043 AKTS-Setaram).
Figure 9. Micro Calorimetry Equipment
1
3
1
2
1
4
1
5
1
6
1
7
1
TP
1
24.01 V 0,004A 3.998 mA DC
HELIUM
ADSORBATE 1 ADSORBATE 2
VACUUM PUMP
PRESSURE TRANSDUCER CALIBRATE VOLUME (VC)
INJECTION VALVE
V1
V2
CHAPTER 4 – RESULTS AND DISCUSSION
4.1. TEXTURAL CHARACTERISTICS
Figure 10. Thermo-Gravimetric Analyzes
(a) Thermo-Gravimetric Analyze for ACPX-22
200 400 600 800 1000 1200 1400
80 85 90 95 100 % Mass Derivative Temperature [K] % Ma ss [mg ] -0.14 -0.12 -0.10 -0.08 -0.06 -0.04 -0.02 0.00 2 1 D e ri va tive [mg mi n -1 ] 1
(b) Thermo-Gravimetric Analyze for ACPX-41
200 400 600 800 1000 1200 1400
80 85 90 95 100 % Mass Derivative Temperature [K] % Ma ss [mg ] -0.14 -0.12 -0.10 -0.08 -0.06 -0.04 -0.02 0.00 D e ri va tive [mg mi n -1 ] 1 2
(c) Thermo-Gravimetric Analyze for ACPX-76
200 400 600 800 1000 1200 1400
The higher temperature peak is due to the higher absolute micropore volume ratio in ACPX-76, than in the ACPX-22.
Table 10. Thermo-Gravimetric Analyzes ACPX Series
Sample Temperature
Section [K]
Average Mass Lost
[%]
ACPX-22
293 – 370 4
370 – 465 1
465 – 1273 4
ACPX-41 293 – 360 3
360 – 1273 2
ACPX-76
293 –351 1
351 – 463 3
463 – 1273 1
4
The elemental analysis of ACPX samples is summarized in Table 11. As expected from the nature of the precursor and the activation procedure, all samples are highly carbonaceous with insignificant presence of heteroatoms (N, S or O). These experiments suggest that the carbon surface is chemically homogeneous with almost no functional groups.
Table 11. Elemental Analysis
Sample % C % H2 % N2 % S % O2 Total
ACPX-22 95.77 0.27 0.13 0.00 0.50 96.67
ACPX-41 96.24 0.23 0.13 0.00 0.47 97.07
ACPX-76 96.90 0.23 0.13 0.00 0.51 97.77
Figure 11. Infrared Spectroscopies
4000 3500 3000 2500 2000 1500 1000 500 10
20 30 40
ACPX-22
ACPX-41
T
ra
n
smi
tt
a
n
ce
[
%
]
Wave Number [cm-1]
ACPX-76
1 2 3
4 5
Table 12. Infrared Spectroscopies
Data Point Wave Number Section [cm-1]
Probably Link 1 3600 – 3300 H2O; -OH
2 2950 – 2800 -CH2; -OH; -CH; -C-C- 3 1730 – 1530 =C; -C=C-
4 1310 – 910 -CH2; -C; -CH3 5 730 – 430 CO2; -CH2 Source: Silverstein M.Robert, Webster X. Francis 2005
Nitrogen adsorption/desorption isotherms at 77K for samples ACPX-22, ACPX-41 and ACPX-76 are shown Figure 12. They are classified as type I (a) and (b), which are typical of microporous materials. The initial steep slope in ACPX-22 N2 isotherm indicates a narrow distribution of micropores. Using this data, BET equation was applied in order to estimate the specific surface area. CO2 adsorption/desorption isotherms at 273 K for all samples are also shown in (Figure 13). The textural properties, surface area
Figure 12. Adsorption/Desorption N2 Isotherms at 77 K
0.0 0.2 0.4 0.6 0.8 1.0
0 100 200 300 400 500 600 700
Ad
so
rb
e
d
Q
u
a
n
ti
ty
[cm³/
g
ST
P]
Relative Pressure [P/Po] ACPX-22
ACPX-41 ACPX-76
Figure 13. Adsorption/Desorption CO2 Isotherms at 273 K
0.00 0.01 0.02 0.03 0.04
0 20 40 60 80 100 120
Amo
u
n
t
Ad
so
rb
e
d
[
cm³
g
-1 ]
Relative Pressure [P/Po]
Table 13. Properties of the Obtained Activated Carbons from N2 and CO2 Isotherms
Sample
Surface Area BET
[m² g-1]
C Range of Linearity
Pore VolumeA
[cm³ g-1]
Micropore Volume N2B
[cm³ g-1]
Micropore Volume CO2B
[cm3 g-1]
���� ��
� ��
[%]
ACPX-22
984 1220 0.0506 < P/Po < 0.1915 0.405 0.394 0.368 97.3
ACPX-41
1351 698 0.0504 < P/Po < 0.0758 0.585 0.500 0.522 85.5
ACPX-76
2176 126 0.0543 < P/Po < 0.1455 1.035 0.821 0.633 79.3
A Total pore volume, evaluated at relative pressure of 0.99 B Evaluated from the Dubinin-Stoeckli method
ACPX-76 has the highest N2 uptake, around 650 cm³ g-1 (Figure 12), due to its much higher porosity. In addition, ACPX-76 has the lowest microporosity fraction as compared to the other samples (Table 13). In opposition, sample ACPX-22 has the lowest total porosity, and hence the smallest N2 uptake, around 250 cm³ g-1, but the highest microporosity fraction. It is likely that such high microporosity may lead to a higher selectivity of CO2 in gas mixtures. From data in Table 13, combined with isotherms in Figure 12, there is evidence that a higher burn-off leads to larger pore volume and wider pore size distribution, shifting towards the mesopore range. Another important remark
concern the ‘C’ constant values, which can be related to surface affinity towards the probe gas. Constant C increases with decreasing burn-off, which in turn is related to a narrower pore size distribution in the micropore range.
Figure 14. Pore Size Distributions (PSD’s) by N2 Isotherms
0 1 2 3 4 5
0.0 0.5 1.0
ACPX-76
ACPX41
ACPX22
Pore Width [nm]
[c
m
3 g
-1 n
m
-1 ]
Figure 15. Pore Size Distributions (PSD’s) by CO2 Isotherms
(a) PSD by CO2 for ACPX-22
0.0 0.4 0.8 1.2 1.6 2.0
0.0 0.5 1.0 1.5
[cm
3 g -1 n
m
-1 ]
[nm]
(b) PSD by CO2 for ACPX-41
0.0 0.4 0.8 1.2 1.6 2.0
0.0 0.5 1.0 1.5
[cm
3 g -1 n
m
-1 ]
[nm]
PSD by CO2 at 273 K PSD by N2 at 77 K
(c) PSD by CO2 for ACPX-76
0.0 0.4 0.8 1.2 1.6 2.0
0.0 0.5 1.0 1.5
[cm
3 g -1 n
m
-1 ]
[nm]
PSD by CO2 at 273 K PSD by N2 at 77 K
4.2.PURE GAS COMPONENT ISOTHERMS
Figure 16. Single Components CO2 and N2 Isotherms for ACPX-22, 41 and 76
(a) CO2 Isotherms for ACPX-22
0 2 4 6 8 10
0 2 4 6 8 10 298 K 323 K 348 K Langmuir_Model Sips_Model Amo u n t_ Ad so rb e d (mmo l g -1 ) Pressure (bar)
(b) N2 Isotherms for ACPX-22
0 2 4 6 8 10
0 2 4 6 8 10 298 K 323 K 348 K Langmuir_Model Sips_Model Amo u n t_ Ad so rb e d (mmo l g -1 ) Pressure (bar)
0 2 4 6 8 10 0 2 4 6 8 10 298 K 323 K 348 K Langmuir_Model Sips_Model Amo u n t_ Ad so rb e d (mmo l g -1 ) Pressure (bar)
(d) N2 Isotherms for ACPX-41
0 2 4 6 8 10
0 2 4 6 8 10 298 K 323 K 348 K Langmuir_Model Sips_Model Amo u n t_ Ad so rb e d (mmo l g -1 ) Pressure (bar)
(e) CO2 Isotherms for ACPX-76
0 2 4 6 8 10
0 2 4 6 8 10 298 K 323 K 348 K Langmuir_Model Sips_Model Amo u n t_ Ad so rb e d (mmo l g -1 ) Pressure (bar)
0 2 4 6 8 10 0 2 4 6 8 10 298 K 323 K 348 K Langmuir_Model Sips_Model Amo u n t_ Ad so rb e d (mmo l g -1 ) Pressure (bar)
In all cases, the excess adsorbed concentration decreases with a rise in temperature, a typical behavior of physisorption. Moreover, experiments shown no hysteresis in all isotherms, which suggests full reversibility in pressure swings. CO2 uptake is directly proportional to the burn-off, so that the more activated sample ACPX76 reaches the highest adsorbed phase concentrations. It was also observed that CO2 uptake tends to decrease as the micropore volume decreases. This is because micropores have higher potential for physisorption, which enhance the CO2 adsorption. It is interesting to note that the less activated the sample is, the more favorable the shape of the isotherm is, due to its narrower pore size distribution. None of the isotherms reaches a plateau in the pressure range under study because all samples have a certain degree of mesopores (sizes above 2 nm), as indicated in Figure 14, and they may accommodate compressed gas as pressure increases further. The adsorbent shows a higher affinity to adsorb CO2 as compared to N2. Some key properties of these gases, as critical temperature, molecular size and polarizability are summarized (Table 14).
Table 14. Adsorbates Properties
Gas Critical Temperature [K] ¹ Molecular Size [nm] ² Polarizability [×10-25 cm³] ³
Quadrupole Moment [atomic units] 4
CO2 304.35 0.330 29.1 2.50
N2 126.00 0.364 17.4 1.52
Source: 4Liu et al. 2011;³Rallapalli et al. 2011; ²Pillai et al. 2008; ¹Tagliabue et al. 2009
moment (Lennard-Jones potential) that induces bonding between the gas molecule and material surface (YANG, 2003). In contrast, N2 is a weak-polar molecule, so there is no induced interaction with material surface apart from van der Waals forces. Lastly, the critical temperature decreases in the order TCO2 > TN2. The high values for CO2 critical temperature makes this gas behave like a condensable vapor at the temperature of the adsorption experiments, instead of a supercritical gas, which is the case of nitrogen.
All parameters obtained from the model fitting to mono-components isotherms and to be used for binary isotherms are summarized on Table 15 and Table 16.
Table 15. CO2 Langmuir and Sips Models Parameters
Sample Temperature
ACPX22
298 K 323 K 348 K Langmuir
Parameters
qmax [g g-1] 0.306 0.273 0.260 b [bar] 0.728 0.412 0.202 Sips
Parameters
nmax [g g-1] 0.404 0.404 0.398 k [bar] 0.294 0.294 0.057
C 0.777
ACPX41
298 K 323 K 348 K Langmuir
Parameters
qmax [g g-1] 0.433 0.388 0.333 b [bar] 0.536 0.268 0.196 Sips
Parameters
nmax [g g-1] 0.640 0.600 0.540 k [bar] 0.172 0.085 0.070
C 0.792
ACPX76
298 K 323 K 348 K Langmuir
Parameters
qmax [g g-1] 0.786 0.604 0.507 b [bar] 0.178 0.127 0.090 Sips
Parameters
nmax [g g-1] 1.350 1.000 0.973 k [bar] 0.050 0.040 0.028
C 0.838
Table 16. N2 Langmuir and Sips Models Parameters
Sample Temperature
ACPX22
298 K 323 K 348 K Langmuir
Parameters
qmax [g g-1] 0.100 0.092 0.075 b [bar] 0.125 0.085 0.072 Sips
Parameters
nmax [g g-1] 0.133 0.133 0.104 k [bar] 0.074 0.074 0.039
C 0.881
ACPX41
Langmuir Parameters
qmax [g g-1] 0.115 0.115 0.102 b [bar] 0.121 0.071 0.052 Sips
Parameters
nmax [g g-1] 0.153 0.143 0.140 k [bar] 0.074 0.043 0.017
C 0.907
ACPX76
298 K 323 K 348 K Langmuir
Parameters
qmax [g g-1] 0.164 0.144 0.129 b [bar] 0.088 0.069 0.050 Sips
Parameters
nmax [g g-1] 0.220 0.216 0.220 k [bar] 0.045 0.030 0.020
C 0.928
The deviations of Langmuir and Sips fittings for all the CO2 and N2 mono component isotherms are shown in Table 17 and Table 18. The Sips Model shows a better agreement with the experimental data, probably due to the third parameter (C), that is not in LM and leads to a better data mathematical fitting. Note that the parameters of the two models are coherent with their physical meaning. Parameters b (LM) and k (SM) are related to the adsorbent-adsorbate interaction. Their magnitude confirms that such interaction is stronger for the less activated sample, ACPX22, which also has the narrowest pore size distribution. Because all samples have nearly no functional groups, the different porous texture of the sample is the main feature affecting the uptake of gases and possibly the selectivity. The qmax parameters evidence that the maximum uptake of
the samples is closely related to their total pore volume.
Table 17. Relative Squared Deviation for CO2 Mono Components Isotherms
Sample Model/
Temperature [K]
298 K 323 K 348 K
ACPX-22 SM 0.085 0.028 4.325
LM 8.202 5.463 0.903
ACPX-41 SM 8.628 7.545 2.727
LM 12.553 4.959 4.352
ACPX-76 SM 7.064 3.614 3.754
LM 19.791 6.469 3.206
Table 18. Relative Squared Deviation for N2 Mono Components Isotherms
Sample Model/
Temperature [K]
298 K 323 K 348 K
ACPX-22 SM 0.061 0.001 0.010
LM 0.036 0.022 0.030
ACPX-41 SM 0.023 0.046 3.472
LM 0.153 0.173 0.012
ACPX-76 SM 0.009 0.079 0.029