Article
Printed in Brazil - ©2017 Sociedade Brasileira de Química 0103 - 5053 $6.00+0.00
*e-mail: [email protected]
Sorption of Sulfachloropyridazine in Brazilian Soils
Alessandra Paula Vieira, Susanne Rath and Anne Hélène Fostier*
Instituto de Química, Universidade Estadual de Campinas, 13083-970 Campinas-SP, Brazil
Sulfonamides are among the most widely employed antibacterial in veterinary medicine. Because a substantial proportion of sulfonamides are excreted unchanged as parent compounds after administration or are excreted as their metabolites through urine and feces, their presence in soils is a matter of concern. Adsorption and desorption are important processes that influence the transport, transformation and bioavailability of antimicrobials in soils, and data related to sorption capacity are therefore needed for environmental risk assessments. The sorption potential of sulfachloropyridazine (SCP) was assessed in four Brazilians soils using batch equilibrium experiments. The adsorption/desorption data fit well Freundlich isotherms. The sorption coefficients (KD)
ranged from 1.00 to 4.48 cm3 g-1, and the Freundlich adsorption coefficient (K
F) ranged from
1.89 to 5.63 µg1-1/n (cm3)1/n g-1 showing that SCP adsorption is generally low in the studied soils.
The results were compared with previously published data obtained for the sorption of other sulfonamides in the same four soils.
Keywords: veterinary drug, antimicrobial, sulfonamide, soil, sorption
Introduction
Antimicrobials are used as prophylactic and therapeutic agents to treat diseases in animals and humans.1-3 After administration to animals, a substantial proportion (30-90%) of antimicrobials is excreted unchanged as parent compounds or as their metabolites through urine and feces. Antimicrobials and/or metabolites can therefore enter the environment directly from manure or indirectly when manure is applied in soils as fertilizer and remain biologically active in the environment.4-6 Antimicrobial resistance has become a global concern because antimicrobials present in soil and natural water can facilitate the proliferation of antimicrobial-resistant microorganisms.7,8 The Brazilian production of beef, pork and chicken in 2010 was approximately 24.5 million tons. This production should increase 51% by 2018/2019, reaching 37 million t per year, and the exportation of chickens should increase 48.1% by 2020, placing Brazil as the world’s largest producer and exporter of chickens.9 This large production directly affects the domestic veterinary drug market, which reached approximately US$ 4 billion in 2014. Among the different therapeutic classes, antimicrobial agents account for 16% of this market.10
Sulfonamides are among the most widely employed antibacterial agents in veterinary medicine, primarily due to their low cost and relatively high efficacy in treating bacterial diseases.6 In New Zealand, both tylosin (a macrolide antibiotic) and the sulfonamides group account for approximately 17% of the total antimicrobials used in livestock operations,11 and in the USA, sulfonamides represent 2.3% of all the antibiotics used.12 In the UK and the Netherlands, sulfonamides are the second most widely used veterinary antimicrobials, accounting for approximately 82 and 75 t per year, respectively.13 In Brazil, almost 90 different formulations containing sulfonamides are commercially available for veterinary applications.10
In the environment, the transport of chemicals to surface water and groundwater is primarily governed by sorption processes, which also play a central role in the transformation reactions and soil microbial interactions.11 Data related to sorption capacity are therefore needed for environmental risk assessments.
interaction mechanisms, such as surface complexation, H-bonding, cation bridging, ion-exchange and hydrophobic partitioning.14 Consequently, their sorption varies greatly with the soil physicochemical properties, particularly soil pH, quantity and quality of organic matter and the types of minerals present.15 Notwithstanding the number of studies on the sorption of polyfunctional ionogenic compounds on soils, differences in experimental conditions and the absence of studies involving a large set of homologous compounds constitute obstacles in the development of predictive models of sorption.14
Among antimicrobials, sulfonamides have been largely studied,16,17 and sulfachloropyridazine (SCP) has occasionally been considered a model compound for this group.13,18
Sulfonamides are amphoteric compounds with two ionizable groups: the basic 4-amine aromatic (1.6 < pKa1 < 2.6) and acid sulfonamide (5.7 < pKa2 < 8.0) moieties.19 In the environment, they are expected to be present in neutral (uncharged) and anionic (deprotonated) forms, with the latter being more abundant at higher pH values.6,13 Hydrophobic partitioning and electrostatic interactions can therefore be involved in the sorption process, and the accumulation and persistence of residual sulfonamides in soil depend on environmental parameters, including the soil pH, the organic matter content of the soil, the cation exchange capacity (CEC) and the clay minerals.15
Overall, the sorption coefficients (KD) of sulfonamides in soils have been reported to fall in the range of 0.6 to 7.4 L kg-1.6 These relatively low K
D values indicate that sulfonamides would be mobile in soils, in accordance with their high water solubility and low log KOW. Nevertheless, Leal et al.20 reported highly variable K
D values for sulfonamides in Brazilian soils, ranging from 0.7 to 70.1 L kg-1, with the highest value found for SCP. Due to the rainfall pattern and intensity, Brazilian soils are generally highly weathered with a low organic content (< 10%) and pH < 5.5. They are also typically rich in 1:1 clay minerals and oxides and hydroxides of Fe and Al, and they have mostly pH-dependent net charges.20 Compared to soils from temperate regions, these differences in pseudo-climatic conditions can significantly influence the sorption potential. However, few studies have been reported regarding the sorption of sulfonamides in Brazilian soils,16,17,20 and the experimental conditions were not always the same for the studies.
Therefore, the objective of this work was to assess the sorption affinity of sulfachloropyridazine in four representative soils from the State of São Paulo (SP), Brazil, complementing previous studies conducted with some other sulfonamides in the same soils.16,17
Experimental
Soil samples
Sorption studies were conducted on four soils (N1, N2, S1 and S2) from São Paulo State. The soils were collected in 2005 from different locations and transferred to lysimeters (1 × 1 × 2 m) located in the experimental area of the Brazilian Agricultural Research Corporation (Embrapa), city of Jaguariúna, SP, Brazil, in which the soil profiles were reconstructed. The origins of the soils were as follows:
N1: sandy, city of Santa Rita do Passa Quatro, SP (21°42’18.12”S and 47°28’04.82”W, altitude 773 m) (pasture).
N2: clay, city of Sertãozinho, SP (21°05’20.44”S and 47°48’10.73”W, altitude 538 m) (sugar cane plantation).
S1: sandy-clay, city of Jaguariúna (22°43’14.92”S and 47°01’14.20”W, altitude 617 m) (citrus plantation).
S2: clay, city of Jaguariúna (21°42’59.50”S and 47°01’00.05”W, altitude 609 m) (covered with Brachiaria).
The soil samples used in this study were collected from each lysimeter in July 2010 at a depth of 0-20 cm, dried at room temperature, sieved to a particle size of
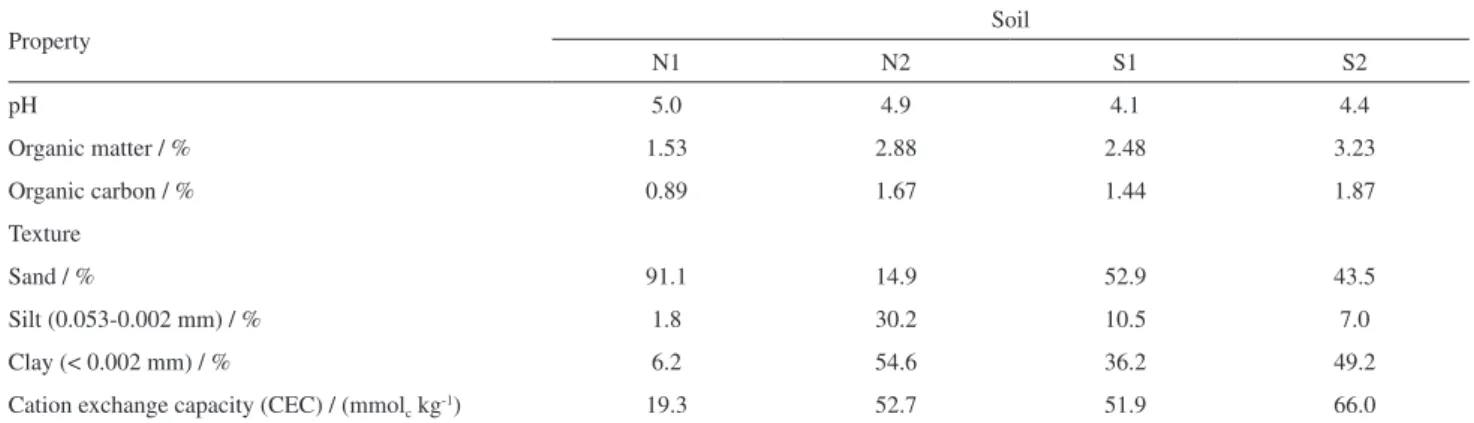
≤ 2 mm and stored in plastic bags maintained at room temperature until use. The physicochemical characteristics of each soil, provided by the Laboratory of Soil Fertility from the Agronomic Institute of Campinas, are presented in Table 1.
Reagents
All solvents were of HPLC grade, and all reagents were of at least analytical grade. Methanol was purchased from JT Baker, USA. Oxalic acid (purity ≥ 99%) was purchased from Sigma Aldrich, Belgium. Calcium chloride was supplied by Vetec, Brazil. Water was obtained from a Milli-Q purification system (Millipore, USA). Sulfachloropyridazine (CAS 80-32-0, 99.4%) was purchased from Fluka, USA. The molecular structure and some of the physicochemical properties of SCP are shown in Figure 1. The standard stock solution (1000 mg L-1) of SCP was prepared in methanol. Working solutions were prepared by the appropriate dilution of the standard stock solution in 0.01 mol L-1 CaCl
2.
HPLC analysis
Separations were performed on an ACE® C18 (250 × 4.6 mm, 5 µm particle size) column (ACT, Scotland). The elution was in isocratic mode at a flow rate of 1.0 mL min-1. The mobile phase was prepared with methanol with 0.1% (v/v) formic acid and water (30:70 v/v). The quantification was performed at 260 nm. A retention time of approximately 9 min was determined for SCP.
HPLC method validation
The HPLC method was validated in house by evaluating the following parameters: matrix effect, linear range, linearity, limit of quantification (LOQ), and intra- and inter-day precisions.
For each soil, the matrix effect was evaluated through fortification with SCP (15 mg L-1) of the supernatant obtained after the soil samples were equilibrated (48 h at room temperature) with 0.01 mol L-1 CaCl
2, centrifuged, and filtered with 0.22-µm membrane filters. The fortified extract was analyzed by HPLC, and the area obtained was compared with the area of the solution prepared at the same concentration level in 0.01 mol L-1 CaCl
2. All analyses were performed in duplicate.
The linearity and linear range were established through external calibration obtained by triplicate analyses of seven
concentrations ranging from 1.0 to 40.0 mg L-1 SCP in 0.01 mol L-1 CaCl
2.
The LOQ was determined as ten times the signal-to-noise ratio.
The intra-day and inter-day precisions were evaluated by analyzing the 0.01 mol L-1 CaCl
2 extracts (1/5, m/v) obtained from each soil sample fortified with 20 mg L-1 SCP (equivalent to 100.0 µg g-1 of soil) after an apparent equilibrium time of 48 h.
For intra-day precision, experiments were performed in sextuplicate, on the same day, by the same analyst and using the same method and equipment. The inter-day precision was determined using the same procedure described for the intra-day precision; however, the experiments were performed on three different days (sextuplicate tests during the first day and triplicate tests during the two other days). The intra- and inter-day precisions were expressed as the relative standard deviation (RSD).
Sorption/desorption experiments
The batch experiment method was used to determine the soil sorption and desorption constants of the four soils under study according to the OECD Test Guideline 106.23 All experiments were conducted in polypropylene vessels at room temperature (20-25 °C) in the dark while being stirred horizontally (120 rpm).
Preliminary experiments were performed to assess the stability of SCP and its possible adsorption on the surface of the test vessels. For stability, 25 mL solutions of 0.01 mol L-1 CaCl
2 were fortified with 25 mg L-1 SCP, and stirring of the samples in the dark was maintained for 1, 24, 48, 72, 96, 120 and 144 h; the SCP concentration was then determined by HPLC.
For each soil, batch kinetic experiments were conducted using the parallel method at the natural (unaltered) pH of the medium to determine the adsorption equilibrium
Table 1. Physical and chemical properties of the selected soils
Property Soil
N1 N2 S1 S2
pH 5.0 4.9 4.1 4.4
Organic matter / % 1.53 2.88 2.48 3.23
Organic carbon / % 0.89 1.67 1.44 1.87
Texture
Sand / % 91.1 14.9 52.9 43.5
Silt (0.053-0.002 mm) / % 1.8 30.2 10.5 7.0
Clay (< 0.002 mm) / % 6.2 54.6 36.2 49.2
Cation exchange capacity (CEC) / (mmolc kg-1) 19.3 52.7 51.9 66.0
time.21 For this purpose, 1 g of soil was mixed with 5 mL of 0.01 mol L-1 CaCl
2 in polypropylene tubes and shaken for 24 h for pre-equilibration. The mixture was then fortified with 25 mg L-1 SCP and shaken from 0 to 144 h. The analyses were performed after 0, 2, 4, 8, 24, 48, 72, 96, 120 and 144 h contact time. Prior to the analyses, the samples were centrifuged at 6000 × gfor 20 min; the supernatant was filtered through a 0.22-µm Millipore membrane filter, and the SCP was determined by HPLC. The percentage of SCP adsorbed onto soil was calculated and plotted as a function of time. To evaluate the kinetic sorption mechanism, the pseudo-second-order (equation 1) and Elovich (equation 2) models were tested.
The pseudo-second-order model (PSO) considers the sorption capacity to be proportional to the number of active soil sites occupied. In its linear form, this model can be expressed as follows:
(1)
In this model, qt (µg g-1) is the sorbed concentration at the time t, qe (µg g-1) is the maximum sorbed concentration at equilibrium, and k2 (g µg-1 min-1) is the pseudo-second-order rate constant for the kinetic model. The values of qe and k2 are then determined directly from the slope and intercept of the plot of t/qt versus t, respectively.22
The Elovich model (equation 2) assumes that the sorption kinetic occurs in a rapid initial process associated with the movement of the compound to the most accessible part of the sorbent, followed by a slower process due to particle diffusion into and out of the sorbent’s micropores.24,25
(2)
In this model, X and Y are constants. The intercept 1/Yln (X,Y) coincides with the sorbed quantity during the fast phase (qfast), whereas the slope (1/Y) represents the slow sorption in relation to the duration of the second phase.23
For the sorption isotherms, 5 mL of 0.01 mol L-1 CaCl2 was added to 1.0 g of soil (N1, N2, S1 or S2) in polypropylene tubes. After a 24 h pre-equilibration period, the samples were spiked with an appropriate volume of SCP solution to obtain five different concentrations in the range of 2 to 35 mg L-1,and the suspensions were shaken for 48 h. Prior to the analyses, the samples were centrifuged at 6000 × gfor 20 min; the supernatant was filtered through a 0.22-µm Millipore membrane filter, and the SCP was determined by HPLC. In each tube, the remaining soil was
immediately used for desorption studies. For this purpose, 5 mL of 0.01 mol L-1 CaCl
2 was added to each remaining soil sample and the tubes were shaken for another 96 h. The samples were centrifuged, and the supernatant was filtered through 0.22 µm membrane filters before being analyzed by HPLC. All experiments were performed in triplicate. Blank soil samples revealed that none of the soils were contaminated with SCP (LOD = 30.0 µg L-1). A control sample consisting solely of SCP in 0.01 mol L-1 CaCl
2 was subjected to the same test procedure.
Data analyses: sorption and desorption isotherms
The amount of SCP adsorbed onto the soil (Cs, µg g-1) after apparent equilibrium had been reached was calculated using equation 3:
(3)
where V0 (mL) is the initial volume of solution, msoil (g) is the mass of soil, C0 (µg mL-1) is the initial concentration of SCP, and Caq (µg mL-1) is the concentration of SCP remaining in solution after apparent equilibrium has been reached.
All results were modeled using both linear and nonlinear Freundlich isotherms (equation 4):
(4)
where KF (µg1-1/n (cm3)1/n g-1) is the Freundlich adsorption (KFads) or desorption (KFdes) coefficient and 1/n is the slope (Freundlich exponent or linearity factor, a constant depicting the sorption intensity).24 When 1/n = 1, K
F is equivalent to the distribution coefficient for sorption KD (cm3 g-1), which can be calculated using equation 5:
(5)
Because partitioning mechanisms can be complex for a number of organic compounds, primarily for nonionic compounds, the sorption coefficients can be normalized by the organic carbon content (OC%), as shown in equation 6.
(6)
calculated from the organic matter content (OM%) by considering OM% = 1.724 OC%.25
Results and Discussion
Method validation
The analysis of the chromatograms did not indicate any interference in the four different soil sample matrices under the established experimental conditions, conferring adequate selectivity to the method. As an example, Figure 2 shows the chromatogram obtained for 15 mg L-1 SCP in pre-equilibrated soil solution S1.
In addition, it was verified that the slopes of the calibration curves obtained for SCP in 0.01 mol L-1 CaCl
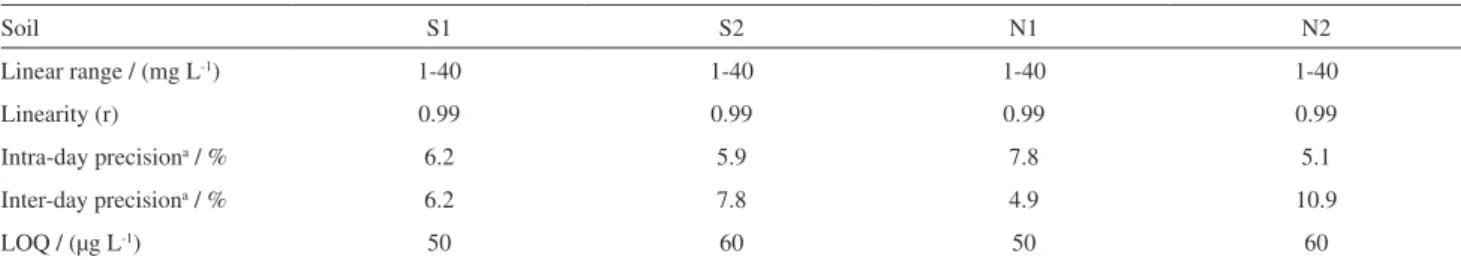
2 and SCP in the soil extracts do not significantly differ (Student’s t-test, 95% confidence level), confirming the absence of the matrix effect. The results of the other validation parameters are presented in Table 2.
Control samples (25 mg SCP L-1 in 0.01 mol L-1 CaCl 2) were analyzed to evaluate the possible degradation and/or adsorption of SCP to the surface of the polypropylene tubes. A recovery of 98.7% was measured after 144 h of experimentation, indicating that SCP is stable in the medium over time with no sorption onto the tubes.
Kinetic study
Any mass transfer process between two phases (e.g., liquid/solid) can be modeled from a kinetic perspective. The kinetic sorption process involves three mechanisms: (i) transport of the sorbate to the solid surface; (ii) transfer through the liquid film adhered at the solid surface; (iii) interaction of the compound with the solid surface through chemical or physical interactions.26 An appropriate kinetic model allows the determination of the time required to reach the sorption equilibrium and can also provide some information on the physical process involved in the sorption process. For each soil, the SCP equilibration time was established through a plot of sorption percentage versus
time (0 to 8640 min) (Figure 3).
The sorption profile shows a two-stage sorption process: sorption increased quickly during the first eight hours, and then it increased slowly until approximately 48 h (2880 min) (apparent equilibration time). Many previous studies also found slow sorption for sulfonamides, primarily ranging from 12 to 48 h.11,13,27-29 The kinetic results were modeled using a pseudo-second-order model and using the Elovich model (data not shown). The best fit for the experimental results was achieved with the pseudo-second-order model (r > 0.98), suggesting that sorption was primarily governed by the availability of
Figure 2. Chromatogram of 15 mg L-1 SCP in 0.01 mol L-1 CaCl 2 and in pre-equilibrated soil solution S1.
Table 2. Method validation parameters for the determination of SCP
Soil S1 S2 N1 N2
Linear range / (mg L-1) 1-40 1-40 1-40 1-40
Linearity (r) 0.99 0.99 0.99 0.99
Intra-day precisiona / % 6.2 5.9 7.8 5.1
Inter-day precisiona / % 6.2 7.8 4.9 10.9
LOQ / (µg L-1) 50 60 50 60
aFortification level: 100 µg g-1; LOQ: limit of quantification.
sorption sites on the soil surfaces rather than the SCP concentration in the solution.22
Adsorption/desorption isotherms
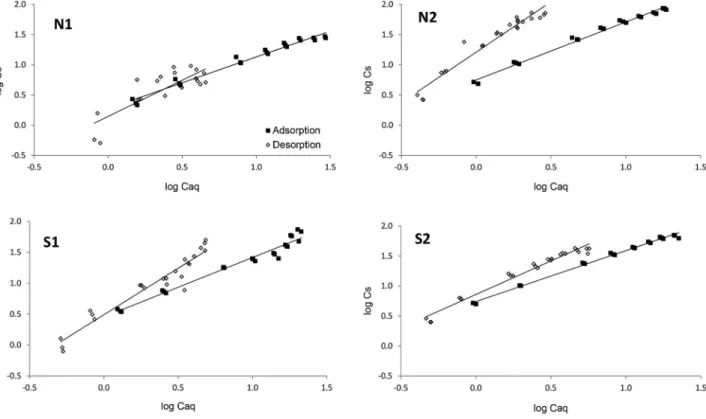
Isotherms for each of the four soils were constructed as the amount of adsorbed SCP per gram of soil (Csads) as a function of the apparent equilibrium concentration (Caq). The data were well fit using the Freundlich model in logarithmic form (Figure 4), with r ≥ 0.98 (Table 3).
For soils N2 and S1, the values of 1/n (Table 3) close to unity (0.96) suggest that the sorption is independent of the
concentration in the tested range and can be approximated with a linear sorption coefficient KD. For N1 and S2, a lower 1/n value (0.85) suggests that as the concentration of SCP in the aqueous phase increased, the sorption sites became increasingly saturated and thus less able to sorb additional molecules,30 i.e., there was a strong interaction between soil and SCP molecules and a decreasing sorption tendency with increasing equilibrium concentration.16,31,32 These values fell within the range reported in the literature for SCP (Table 4). In contrast, in a study on the sorption behavior of other sulfonamides (sulfadiazine (SDZ), sulfadimethoxine (SDM), sulfaquinoxaline (SQX) and sulfamethazine
Table 3. Values determined from the adsorption and desorption of SCP: distribution coefficient (KD), Freundlich coefficient (KF), Freundlich exponent (1/n) and adsorption coefficient normalized to organic carbon (Koc)
Soil Study Linear Freundlich KOC / (cm3 g-1)
KDa / (cm3 g-1) r KF / (µg1-1/n (cm3)1/n) 1/n R
N1 Adsb 1.0 (0.6) 0.96 1.9 (4.8) 0.9 (1.2) 0.99 112
Desc 1.7 (5.2) 0.77 1.0 (1.5) 1.2 (4.2) 0.83
N2 Adsb 4.5 (2.3) 0.99 5.6 (2.6) 0.9 (1.1) 0.99 268
Desc 29.0 (2.5) 0.97 16.3 (3.4) 1.7(1.5) 0.97
S1 Adsb 2.8 (1.0) 0.94 2.9 (2.1) 1.0 (0.8) 0.98 196
Desc 8.6 (0.1) 0.90 3.1 (3.9) 1.5 (1.8) 0.96
S2 Adsb 3.2 (2.1) 0.98 5.5 (0.8) 0.9 (0.4) 1.00 168
Desc 7.8 (2.1) 0.97 7.2 (2.0) 1.1 (0.7) 0.99
aValues in parentheses refer to the standard deviation (n = 3); bAds: adsorption; cDes:desorption.
(SMZ)) in the same soils (N1, N2, S1 and S2), Doretto and Rath16 and Doretto et al.17 identified nonlinear sorption isotherms, with 1/n ranging from 0.70 to 0.94. Thiele-Bruhn and Aust33 observed an increase in isotherm linearity for many sulfonamides after adding pig slurry to soils. The authors assumed that the decrease in nonlinearity indicates decreased site specificity of sulfonamide adsorption in the presence of manure.
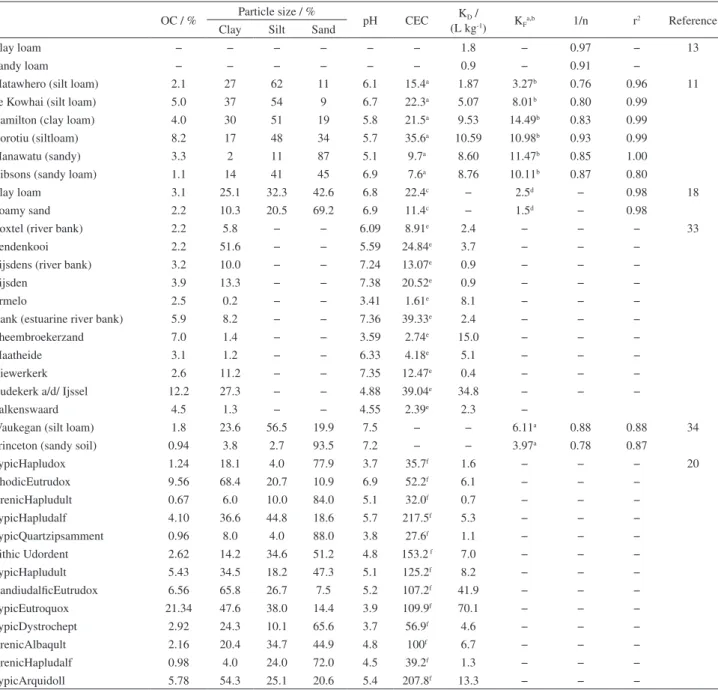
The sorption coefficients ranged from 1.0 to 4.5 cm3 g-1 for KD and from 1.9 to 5.6 µg1-1/n (cm3)1/n g-1 for KF. The KD values reported from various studies (Table 4) range from 0.4 to 70.1 cm3 g-1, with a mean of 8.8 cm3 g-1 and a median
value of 4.6 cm3 g-1, which indicates that SCP adsorption is generally low in most soils, although ter Laak et al.18 and Leal et al.20 showed that for SCP, K
D can vary by as much as 100 times depending on the soil, indicating variation in leaching potential.
The adsorption of SCP was higher in the clay soils (N2 > S2 > S1) than in the sandy soil (N1). The KF values were positively correlated with clay content (r = 0.92), OC content (r = 0.91) and CEC (r = 0.80) and negatively correlated with sand content (r = −0.88).
The sorption process of organic compounds in soil depends on the soil composition relative to its organic
Table 4. Comparison of the KD, KF, 1/n and r2 values reported in the literature for SCP sorption on soils
OC / % Particle size / % pH CEC KD /
(L kg-1) KFa,b 1/n r2 Reference Clay Silt Sand
Clay loam − − − − − − 1.8 − 0.97 − 13
Sandy loam − − − − − − 0.9 − 0.91 −
Matawhero (silt loam) 2.1 27 62 11 6.1 15.4a 1.87 3.27b 0.76 0.96 11
Te Kowhai (silt loam) 5.0 37 54 9 6.7 22.3a 5.07 8.01b 0.80 0.99
Hamilton (clay loam) 4.0 30 51 19 5.8 21.5a 9.53 14.49b 0.83 0.99
Horotiu (siltloam) 8.2 17 48 34 5.7 35.6a 10.59 10.98b 0.93 0.99
Manawatu (sandy) 3.3 2 11 87 5.1 9.7a 8.60 11.47b 0.85 1.00
Gibsons (sandy loam) 1.1 14 41 45 6.9 7.6a 8.76 10.11b 0.87 0.80
Clay loam 3.1 25.1 32.3 42.6 6.8 22.4c − 2.5d − 0.98 18
Loamy sand 2.2 10.3 20.5 69.2 6.9 11.4c − 1.5d − 0.98
Boxtel (river bank) 2.2 5.8 − − 6.09 8.91e 2.4 − − − 33
Eendenkooi 2.2 51.6 − − 5.59 24.84e 3.7 − − −
Eijsdens (river bank) 3.2 10.0 − − 7.24 13.07e 0.9 − − −
Eijsden 3.9 13.3 − − 7.38 20.52e 0.9 − − −
Ermelo 2.5 0.2 − − 3.41 1.61e 8.1 − − −
Hank (estuarine river bank) 5.9 8.2 − − 7.36 39.33e 2.4 − − −
Lheembroekerzand 7.0 1.4 − − 3.59 2.74e 15.0 − − −
Maatheide 3.1 1.2 − − 6.33 4.18e 5.1 − − −
Niewerkerk 2.6 11.2 − − 7.35 12.47e 0.4 − − −
Oudekerk a/d/ Ijssel 12.2 27.3 − − 4.88 39.04e 34.8 − − −
Valkenswaard 4.5 1.3 − − 4.55 2.39e 2.3 −
Waukegan (silt loam) 1.8 23.6 56.5 19.9 7.5 − − 6.11a 0.88 0.88 34
Princeton (sandy soil) 0.94 3.8 2.7 93.5 7.2 − − 3.97a 0.78 0.87
TypicHapludox 1.24 18.1 4.0 77.9 3.7 35.7f 1.6 − − − 20
RhodicEutrudox 9.56 68.4 20.7 10.9 6.9 52.2f 6.1 − − −
ArenicHapludult 0.67 6.0 10.0 84.0 5.1 32.0f 0.7 − − −
TypicHapludalf 4.10 36.6 44.8 18.6 5.7 217.5f 5.3 − − −
TypicQuartzipsamment 0.96 8.0 4.0 88.0 3.8 27.6f 1.1 − − −
Lithic Udordent 2.62 14.2 34.6 51.2 4.8 153.2 f 7.0 − − −
TypicHapludult 5.43 34.5 18.2 47.3 5.1 125.2f 8.2 − − −
KandiudalficEutrudox 6.56 65.8 26.7 7.5 5.2 107.2f 41.9 − − −
TypicEutroquox 21.34 47.6 38.0 14.4 3.9 109.9f 70.1 − − −
TypicDystrochept 2.92 24.3 10.1 65.6 3.7 56.9f 4.6 − − −
ArenicAlbaqult 2.16 20.4 34.7 44.9 4.8 100f 6.7 − − −
ArenicHapludalf 0.98 4.0 24.0 72.0 4.5 39.2f 1.3 − − −
TypicArquidoll 5.78 54.3 25.1 20.6 5.4 207.8f 13.3 − − −
acmol
matter content, the composition of the mineral fraction (sand, silt and clay) and soil properties, including porosity, specific surface area and cation exchange capacity. It is also related to the physicochemical properties of the organic molecules, particularly the pH-dependent fraction of cationic, neutral or anionic species that are present.17,35 It can therefore be expected that the pH of the soil suspension affects the sorption behavior of SCP in soil. ter Laak et al.,36 for example, showed that increasing pH (4 to 7) decreased the KD values of SCP (9 to < 1 L kg-1), likely because SCP−, which increases in concentration at higher pH levels (Figure 5), is more soluble than the neutral SCP species and also because of the electrostatic repulsion of SCP− from increasingly negatively charged soil surfaces.
Nevertheless, in our study, the pH of the soils ranged from 4.1 to 5.0 (Table 1). SCP can therefore be assumed to be primarily in its neutral form, and it can be expected that sorption is primarily governed by the hydrophobic partition with the soil organic matter (SOM). Nevertheless, when the partition coefficients (KD) were normalized to the OC content of the soil (equation 6), the resulting KOC varied from 112 to 268 cm3 g-1 (Table 3), and the highest K
OC value was observed for N2, which was the soil with the highest clay content. These results demonstrate that SCP sorption cannot be solely attributed to hydrophobic partitioning to soil organic matter and are in agreement with Tolls,37 who determined that sorption of sulfonamides is mostly driven by electrostatic forces in varying combination with hydrophobic partitioning, particularly for soils at pH > 5.5. Nevertheless, many studies have suggested that OC plays a major role in the sorption of sulfonamides to soils and sediments.38,39
Thiele-Bruhn and Aust33 reported a higher adsorption of sulfonamides in soils with higher OM content, although this relationship appears to be valid only when considering soil organomineral particles. Thiele-Bruhn1 also claimed that the effect of SOM on sulfonamide adsorption depends
not only on its quantity but also on its composition. Thiele-Bruhn and Aust33 showed that soil sorption coefficients decreased in the presence of pig slurry, which is rich in organic matter, and considered that the mobilizing effect was first related to competitive adsorption between dissolved organic matter that originated from the manure and the sulfonamides.
The low KD and KF values are in the same range as those generally reported for SCP in many other soils (Table 4) and confirm the high potential mobility of SCP in soils, particularly those with high sand (> 70%), low OC (< 1.5%), and low CEC (< 15 mmolc dm3) contents, as reported by Leal et al.20 Nevertheless, in soils with high OC (> 5.8%) and clay (> 47.6%) contents and relatively high CEC (> 96 mmolc dm3), these authors found KD values ranging from 14.3 to 70.1 L kg-1.
The KF values reported by Doretto et al.16,17 for other sulfonamides (SDZ, SDM, SQX and SMZ) in the same soils (N1, N2, S1 and S2) were also low, ranging from 1.4 to 19.0 µg1-1/n (cm3)1/n g-1. Doretto et al.17 showed a clear relationship between KF and sulfonamide KOW, which describes the propensity of the neutral molecules to dissolve in an apolar medium. The highest Freundlich coefficients (5.5 to 29.0 µg1-1/n (cm3)1/n g-1) were observed for SQX (KOW = 47.9), and SDZ (KOW = 0.813) presented the lowest Freundlich coefficients (0.45-2.6 µg1-1/n (cm3)1/n g-1). In the present study, an intermediate KF (1.9 to 5.6 µg1-1/n (cm3)1/n g-1) was determined for SCP with KOW = 2.0, supporting the conclusion that SCP partitioning in acidic soils is primarily governed by hydrophobic partitioning of the neutral species to the organic fraction of the soil. Notably, SCP and SDZ are the most similar compounds among the sulfonamides already studied in soils N1, N2, S1 and S2, differing only by the presence of one Cl on the pyridazine moiety. For both compounds, the sorption followed exactly the same sorption trend of N1 < S1 < S2 < N2, suggesting that the structure of the molecule is a mandatory parameter in sorption behavior.
The desorption isotherms (Figure 4) were determined according to the procedure used for the adsorption isotherms and represent the amount of SCP still adsorbed per gram of soil as a function of the equilibrium concentration after one desorption cycle. The data from the desorption experiment fit the logarithmic Freundlich isotherms well for all soils, as indicated by the linear regression coefficients (0.98 ≤ r ≤ 0.99) (Table 3). The desorption KF and KD values were consistently higher than those obtained for the adsorption coefficients, indicating that SCP is retained on soil after one desorption cycle. The highest Freundlich desorption coefficient value (36 µg1-1/n (cm3)1/n) was observed for soil N2, suggesting that this soil, which
contained large amounts of clay, had a lower desorption capacity.
The sorption study showed that, as generally observed for other sulfonamides, SCP has a low sorption potential at a natural acidic pH (4.1-5) of these soils, suggesting that this antimicrobial might reach surface water and groundwater. The presence of SCP in leachate samples from soil column amended with pig slurry enriched with SCP supports this hypothesis.40 Recent studies have shown that the dissipation in the environment of organic contaminants such as veterinary antibiotics can occurred via abiotic and biotic processes.41,42 Nevertheless, several studies also revealed the presence of numerous veterinary antibiotic residue classes in surface waters and ground waters close to agricultural areas.41,43,44 The analysis of 39 groundwater samples taken in seven different groundwater bodies of Catalonia under a relevant agricultural pressure revealed the presence of at least 15 different sulfonamides in concentration up to 274 ng L-1, but SCP was not determined.45
Conclusions
This study has assessed the sorption potential of sulfachloropyridazine in four soils of the textural classes (sandy, sandy-clay and clay) that cover approximately 80% of the state of São Paulo, which is located in a geographically southern sub-tropical zone.
The results show that adsorption was positively correlated with the organic carbon and clay contents. Nevertheless, at the natural pH of these soils, the SCP is mainly in its neutral form, and it was possible to confirm that as for other sulfonamides previously studied in the same soils, SCP partitioning should be primarily governed by hydrophobic partitioning of the neutral species to the organic fraction of the soil.
The SCP adsorption followed exactly the same sorption trend of N1 < S1 < S2 < N2 as sulfadiazine previously studied in the same soils. Because both compounds are very similar, differing only by the presence of one Cl on the pyridazine group, this suggests that the structure of the molecule is a mandatory parameter in the sorption behavior of sulfonamides.
Acknowledgments
The authors gratefully acknowledge financial support from Fundação de Amparo à Pesquisa do Estado de São Paulo (FAPESP), Brazil (process 2009/17470-4 and 2013/09543-7) and Conselho Nacional de Desenvolvimento Cientifico e Tecnológico (CNPq), Brazil, and also Embrapa (Jaguariúna, SP) for supplying the soil samples.
References
1. Thiele-Bruhn, S.; J. Plant Nutr. Soil Sci.2003, 166, 546. 2. Kolz, A. C.; Ong, S. K.; Moorman, T. B.; Chemosphere 2005,
60, 284.
3. Diaz-Cruz, S. M.; Garcia-Galan, J. M.; Barcelo, D.;
J. Chromatogr. 2008, 1193, 50.
4. Halling-Sorensen, B.; Nielsen, S. N.; Lanzky, P. F.; Ingerslev, F.; Lutzhoft, H. C. H.; Jorgensen, S. E.; Chemosphere 1998, 36, 357.
5. Tolls, J.; Environ. Sci. Technol. 2001, 35, 3397.
6. Sarmah, A. K.; Meyer, M. T.; Boxall, A. B. A.; Chemosphere
2006, 65, 725.
7. Boxall, A. B. A.; Fogg, L. A.; Blackwell, P. A.; Kay, P.; Pemberton, E. J.; Croxford, A.; Rev. Environ. Contam. Toxicol.
2004, 180, 1.
8. de la Torre, A.; Iglesias, I.; Carballo, M.; Ramirez, P.; Jesus Munoz, M.; Sci. Total Environ.2012, 414, 672.
9. Ministério da Agricultura, Pecuária e Abastecimento (MAPA);
Animal, Mercado Interno, available at http://www.agricultura.
gov.br/animal/mercado-interno/producao, accessed in May 2016. 10. Sindicato Nacional da Indústria de Produtos para Saúde Animal (SINDAM), available at http://www.sindan.org.br/sd/base. aspx?controle=8, accessed in May 2016.
11. Srinivasan, P.; Sarmah, A. K.; Manley-Harris, M.; Sci. Total Environ.2014, 472, 695.
12. Elsayed, E. M.; Prasher, S. O.; Environ. Sci. Pollut. Res. 2014,
21, 3339.
13. Boxall, A. B. A.; Blackwell, P.; Cavallo, R.; Kay, P.; Tolls, J.;
Toxicol. Lett. 2002, 131, 19.
14. MacKay, A. A.; Vasudevan, D.; Environ. Sci. Technol. 2012,
46, 9209.
15. Thiele-Bruhn, S.; J. Plant Nutr. Soil Sci. 2003, 166, 546. 16. Doretto, K. M.; Rath, S.; Chemosphere 2013, 90, 2027. 17. Doretto, K. M.; Peruchi, L. M.; Rath, S.; Sci. Total Environ.
2014, 476, 406.
18. ter Laak, T. L.; Gebbink, W. A.; Tolls, J.; Environ. Toxicol. Chem. 2006, 25, 904.
19. García-Galán, M. J.; Díaz-Cruz, M. S.; Barceló, D.; TrAC, Trends Anal. Chem. 2009, 28, 804.
20. Leal, R. M. P.; Alleoni, L. R. F.; Tornisielo, V. L.; Regitano, J. B.; Chemosphere2013, 92, 979.
21. Organization for Economic Co-operation and Development (OECD), Test No. 106: Adsorption-Desorption Using a Batch Equilibrium Method; OECD Publishing: Paris, 2000.
22. Plazinski, W.; Rudzinski, W.; Plazinska, A.; Adv. Colloid Interface Sci. 2009, 152, 2.
23. Fernandez-Bayo, J. D.; Nogales, R.; Romero, E.; J. Agric. Food Chem. 2008, 56, 5266.
24. Schwarzenbach, R. P.; Gschwend, P. M.; Imboden, D. M.;
New York, EUA, 1992.
25. Sabljic, A.; Environ. Health Perspect. 1989, 83, 179. 26. Grupta, S. S.; Bhattacharyya, K. G.; Adv. Colloid Interface Sci.
2011, 162, 39.
27. Kahle, M.; Stamm, C.; Chemosphere 2007, 68, 1224. 28. Sanders, S. M.; Srivastava, P.; Feng, Y.; Dane, J. H.; Basile, J.;
Barnett, M. O.; J. Environ. Qual. 2008, 37, 1510.
29. Figueroa-Diva, R. A.; Vasudevan, D.; MacKay, A. A.;
Chemosphere 2010, 79, 786.
30. Kurwadkar, S. T.; Adams, C. D.; Meyer, M. T.; Kolpin, D. W.;
J. Agric. Food Chem. 2007, 55, 1370.
31. Calvet, R.; Environ. Health Perspect. 1989, 83, 145. 32. Singh, N.; J. Agric. Food Chem. 2002, 50, 6434.
33. Thiele-Bruhn, S.; Aust, M. O.; Arch. Environ. Contam. Toxicol.
2004, 47, 31.
34. Accinelli, C.; Koskinen, W. C.; Becker, J. M.; J. Agric. Food Chem. 2007, 55, 2677.
35. MacKay, A. A.; Vasudevan, D.; Environ. Sci. Technol.2012,
46, 9209.
36. ter Laak, T. L.; Gebbink, W. A.; Tolls, J.; Environ. Toxicol. Chem. 2006, 25, 933.
37. Tolls, J.; Environ. Sci. Technol.2001, 35, 3397. 38. Kahle, M.; Stamm, C.; Chemosphere2007, 68, 1224.
39. Sukul, P.; Lamshoeft, M.; Zuehlke, S.; Spiteller, M.;
Chemosphere 2008, 73, 1344.
40. Blackwell, P. A.; Kay, P.; Ashauer, R.; Boxall, A. B. A.;
Chemosphere2009, 75, 13.
41. Kim, K.-R.; Owens, G.; Kwon, S.-I.; So, K.-H.; Lee, D.-B.; Ok, Y. S.; Water, Air, Soil Pollut.2011, 214, 163.
42. Pan, M.; Chu, L. M.; Sci. Total Environ.2016, 545, 48. 43. Solliec, M.; Roy-Lachapelle, A.; Gasser, M.-O.; Coté, C.;
Généreux, M.; Sauvé, S.; Sci. Total Environ. 2016, 543, 524. 44. Javid, A.; Mesdaghinia, A.; Nasseri, S.; Mahvi, A. H.;
Alimohammadi, M.; Gharibi, H.; J.Environ. Health Sci. Eng.
2016, 14, 4.
45. García-Galán, M. J.; Garrido, T.; Fraile, J.; Ginebreda, A.; Díaz-Cruz, M. S.; Barceló, D.; Anal. Bioanal. Chem.2011, 399, 795.
Submitted: November 5, 2015
Published online: May 19, 2016