Experimental High-Throughput
Adsorption Unit for Multi-Evaluation of
Adsorbents for Gas Capture, Storage
and Separation Applications
Abril, 2014
João Sérgio Correia Gomes
Licenciado em Ciências da Engenharia Química e Bioquímica
Dissertação para obtenção do grau de Mestre em Engenharia Química e Bioquímica
Orientadora: Dr.ª Isabel Esteves Esperança, Investigadora Auxiliar da Faculdade de
Ciências e Tecnologia da Universidade Nova de Lisboa
Co-orientadores: Dr. José Paulo Mota, Professor Catedrático da Faculdade de Ciências e
Tecnologia da Universidade Nova de Lisboa
Dr. Rui Ribeiro, Investigador Pós-Doutoramento na Faculdade de
Ciências e Tecnologia da Universidade Nova de Lisboa
Júri:
Presidente: Dr.ª Maria Madalena Andrade, Professora Auxiliar da Faculdade de
Ciências e Tecnologia da Universidade Nova de Lisboa
Arguente: Dr. Ricardo Silva, Investigador Pós-Doutoramento do Instituto de
Tecnologia Química e Biológica da Universidade Nova de Lisboa
Experimental High-Throughput Adsorption Unit for Multi-Evaluation of Adsorbents for Gas Capture, Storage and Separation Applications
Copyright © João Sérgio Correia Gomes, Faculdade de Ciências e Tecnologia, Universidade Nova de Lisboa.
I
A
CKNOWLEDGEMENTS
A realização deste trabalho só foi possível devido a contribuições pessoais e profissionais por parte de um grupo variado de pessoas. Entre elas gostaria de agradecer:
Aos meus orientadores, Dr.ª Isabel Esteves, Dr. Rui Ribeiro e Prof. Dr. José Paulo Mota, por todo o apoio, orientação e transmissão de conhecimentos prestados na concretização deste trabalho.
Às minhas colegas de laboratório e grupo, Inês Valente, Bárbara Camacho e Eliana Órfão, pelo apoio, amizade e momentos de descontracção.
Aos meus amigos Casquilho, Diogo, Filipa, Banza, Telma, Marilucia e Sofia pelos inúmeros momentos de boa disposição e pela amizade.
À minha família, um dos meus pilares. Aos meus pais, Sérgio e Teresa, pelo apoio incondicional ao longo de uma vida e a quem devo o que sou hoje. Ao meu irmão Francisco, pela boa disposição e por me mostrar que por vezes as coisas não precisam de ser tão sérias. Gostaria de dedicar este trabalho em especial à minha avó Salete por ser uma figura incondicional na minha vida e por ter sido e ser constante apoio nos momentos mais difíceis. Nada disto teria sido possível sem vocês!
Por último, quero agradecer a minha namorada e melhor amiga Cláudia. Obrigado por acreditares em mim e obrigado por estar sempre aqui. Obrigado por me entenderes, aturares e nunca teres desistido de mim. Este trabalho foi o culminar de um curso feito com vários obstáculos que foram ultrapassados graças à tua dedicação e amor. Obrigado por sermos uma equipa!
O meu mais sincero obrigado a todos.
III
R
ESUMO
Nesta tese, foi projectada e construída uma unidade experimental para a medição de dados de equilíbrio de adsorção através do método volumétrico. Esta unidade permite a realização de experiências simultâneas, de modo a obter equilíbrios de adsorção de uma forma rápida e eficiente.
Foi também criada a respectiva interface para aquisição e controlo. Esta interface foi desenvolvida em LabVIEW e visa monitorizar as variáveis do sistema, controlar as funções das válvulas solenóides presentes na unidade e registar para posterior análise os dados experimentais obtidos.
Em seguida, procedeu-se a uma calibração dos volumes da instalação, para posterior utilização nos cálculos do referido método.
Seguidamente procedeu-se à validação experimental da unidade. Para a validação foram seleccionados dois materiais porosos previamente estudados pelo método de adsorção gravimétrico: um carvão activado, ANGUARD 5 (Suttclife Speakman, Reino Unido) e um
metal-organic framework (MOF) MIL-53(Al) (Basolite A100®, BASF SE, Alemanha). Dois
gases com elevado potencial de separação e armazenamento foram escolhidos: Dióxido de Carbono (CO2) e Azoto (N2). A unidade é composta por duas linhas independentes pelo que os ensaios em ambos os materiais foram realizados em simultâneo.
Foram realizados ensaios a diferentes temperaturas e diferentes intervalos de pressão para ambos os materiais. Foram realizados ensaios de CO2 em ambos os materiais a 30ºC, 80ºC e 150ºC. Para o primeiro, o intervalo de pressão foi entre 0 e 10 bar e para os dois últimos foi entre 0 e 15 bar. Foi realizado um ensaio de N2 a 50ºC para ambos os materiais.
Por último, procedeu-se a uma comparação de resultados com outro método adsorptivo, o método gravimétrico. Os resultados obtidos estão em concordância com os dados obtidos por gravimetria o que mostra que a unidade construida está a funcionar correctamente. Os erros em cada medição seguiram um modelo de erro multivariável e cumulativo.
V
A
BSTRACT
In this thesis, an experimental unit based in the volumetric adsorption method was designed and constructed. This unit allows the realization of simultaneous experiments in order to obtain adsorption equilibria data of several adsorbents quickly and efficiently.
Following the construction of the unit, it was necessary to develop the respective interface for acquisition and control. This interface was developed using the LabVIEW software and aims to monitor the system variables, to control the functions of solenoid valves present in the unit, as well as to register the measured data for further analysis.
After the development of the interface, a volume calibration was performed.
Then the unit was ready to be experimentally validated. For this validation, two porous materials, already analysed by an adsorption gravimetric method, were selected: an activated carbon, ANGUARD 5 (Suttclife Speakman, UK) and a metal-organic framework (MOF) MIL-53 (Al) (Basolite A100 ®, BASF SE, Germany). Two gases with high potential for separation and storage were chosen for study: Carbon Dioxide (CO2) and Nitrogen (N2). The unit consists of two independent lines so both materials were studied simultaneously in every test.
Tests at different temperatures and for different pressure ranges for both materials were performed. CO2 tests were performed on both materials at 30°C, 80°C and 150°C. The pressure range for the first test was between 0 and 10 bar and for the last two was between 0 and 15 bar. A test with N2 at 50 ° C was also performed for both materials.
After, a comparison of the results obtained with other results obtained with the gravimetric method was accomplished. The results obtained are in accordance with the previously obtained gravimetric data which prove that the unit developed is working properly. The error for each measurement was obtained considering the possibility of a multivariate and cumulative error.
VII
T
ABLE OF CONTENTS
ACKNOWLEDGEMENTS ... I
RESUMO ... III
ABSTRACT ... V
TABLE OF CONTENTS ... VII
LIST OF FIGURES ... XI
LIST OF TABLES ... XIII
1. MOTIVATION AND OBJECTIVES ... 1
1.1 MOTIVATION ... 1
1.2 OBJECTIVES ... 2
2. BACKGROUND ... 3
2.1ADSORPTION PHENOMENA ... 3
2.1.1 Basic Concepts ... 3
2.1.2 Physisorption and Chemisorption ... 3
2.1.3 Adsorption Isotherms ... 4
2.2ADSORPTION MEASUREMENT TECHNIQUES ... 6
2.2.1 Calorimetric Method ... 6
2.2.2 Gravimetric method ... 7
2.2.3 Volumetric Method ... 8
2.3ADSORBATES CHOSEN ... 10
2.3.1 Carbon Dioxide ... 10
2.3.2 Nitrogen ... 10
VIII
2.4.1 Activated Carbon ... 11
2.4.2 Metal Organic Framework (MOF) ... 13
3. CONSTRUCTION AND ASSEMBLY OF THE VOLUMETRIC UNIT ...15
3.1.VOLUMETRIC UNIT DESIGN ... 15
3.1.1 Material ... 18
3.1.2 Main Section... 20
3.1.3 Electrical and Data Acquisition/Control Section ... 22
3.1.4 Complementary Sections ... 23
3.2.CONTROL AND ACQUISITION SOFTWARE ... 23
3.2.1 The front panel ... 24
3.2.2 The block diagram ... 24
3.3INITIAL MEASUREMENTS ... 27
3.3.1. Reference Volume Calibration ... 27
3.3.2 Cell Volume Calibration ... 32
3.3.3 Final Considerations ... 33
4. VOLUMETRIC UNIT VALIDATION ...35
4.1ADSORBENT ACTIVATION... 35
4.2ADSORPTION EQUILIBRIUM MEASUREMENTS ... 36
4.2.1 Error determination ... 37
4.2.2 Carbon Dioxide Isotherms ... 38
4.2.3 Nitrogen Isotherms ... 39
4.3VOLUMETRIC DATA VERSUSGRAVIMETRIC DATA ... 40
4.3.1 Carbon Dioxide Isotherms ... 42
4.3.2 Nitrogen Isotherm ... 43
5. CONCLUSIONS AND SUGGESTIONS FOR FUTURE WORK ...45
5.1CONCLUSIONS ... 45
IX
6. BIBLIOGRAPHY...47
7. ANNEXES ...51
ANNEX A ... 51
Cell Volume Determination ... 51
ANNEX B ... 52
Mass balance for determination of the gas amount adsorbed ... 52
ANNEX C ... 53
XI
L
IST OF FIGURES
FIGURE 2.1–ADSORPTION ISOTHERMS TYPES ACCORDING TO IUPAC(INTERNATIONAL UNION
OF PURE AND APPLIED CHEMISTRY) ... 5
FIGURE 2.2–GRAVIMETRIC METHOD APPARATUS ... 7
FIGURE 2.3–VOLUMETRIC METHOD SCHEME... 8
FIGURE 2.4-REPRESENTATION OF AN ACTIVATED CARBON POROUS MATRIX ... 12
FIGURE 2.5-REPRESENTATION OF THE METASTABLE LP AND NP STRUCTURES OF THE MIL-53(AL) MATERIAL, AS A 2×2×2 SUPERCELL VIEWED ALONG THE AXIS OF THE UNIDIMENSIONAL CHANNELS ... 14
FIGURE 3.1–SCHEMATIC REPRESENTATION OF THE VOLUMETRIC UNIT APPARATUS BUILT .... 16
FIGURE 3.2–GENERAL VIEW OF THE VOLUMETRIC UNIT ... 20
FIGURE 3.3-DETAIL OF THE VOLUMETRIC UNIT MAIN SECTION ... 21
FIGURE 3.4-DETAIL OF THE TWO ADSORPTION CELLS INSIDE THE OVEN ... 22
FIGURE 3.5–ELECTRICAL AND DATA ACQUISITION/CONTROL SECTION ... 22
FIGURE 3.6–VOLUMETRIC UNIT INTERFACE ... 25
FIGURE 3.7– LABVIEW DAQ ASSISTANT ... 26
FIGURE 3.8–VOLUMETRIC UNIT APPARATUS WITH THE AUXILIARY VESSEL ... 28
FIGURE 3.9-FIRST STEP FOR VOLUME CALIBRATION PROCEDURE ... 29
FIGURE 3.10-SECOND STEP FOR VOLUME CALIBRATION PROCEDURE ... 30
FIGURE 3.11-FINAL STEP FOR VOLUME CALIBRATION PROCEDURE ... 31
FIGURE 4.1-VOLUME EXPANSION ILLUSTRATION ... 36
FIGURE 4.2-TOTAL AMOUNT ADSORBED OF CARBON DIOXIDE ON ANGUARD5 AT 30ºC,80ºC AND 150ºC ... 38
FIGURE 4.3-TOTAL AMOUNT ADSORBED OF CARBON DIOXIDE ON MIL-53(AL) AT 30ºC,80ºC AND 150ºC ... 38
XII FIGURE 4.5-TOTAL AMOUNT ADSORBED OF NITROGEN ON MIL-53(AL) AT 50ºC ... 40 FIGURE 4.6-COMPARISON BETWEEN TOTAL AMOUNT ADSORBED OF CARBON DIOXIDE ON
ANGUARD5 AT 30ºC,80ºC AND 150ºC WITH DATA OBTAINED WITH THE SIPS MODEL .... 42 FIGURE 4.7-COMPARISON BETWEEN TOTAL AMOUNT ADSORBED OF CARBON DIOXIDE ON
MIL-53(AL) AT 30ºC AND 150ºC OBTAINED EXPERIMENTALLY WITH SIPS MODEL ... 42 FIGURE 4.8-COMPARISON BETWEEN TOTAL AMOUNT ADSORBED OF CARBON DIOXIDE ON
MIL-53(AL) AT 80ºC OBTAINED EXPERIMENTALLY WITH DATA OBTAINED FROM THE
GRAVIMETRIC APPARATUS... 43 FIGURE 4.9-COMPARISON BETWEEN TOTAL AMOUNT ADSORBED OF NITROGEN ON ANGUARD
5 AT 50ºC OBTAINED EXPERIMENTALLY WITH DATA OBTAINED FROM THE GRAVIMETRIC APPARATUS ... 44 FIGURE 4.10-COMPARISON BETWEEN TOTAL AMOUNT ADSORBED OF NITROGEN ON
MIL-53(AL) AT 50ºC OBTAINED EXPERIMENTALLY WITH DATA OBTAINED FROM THE
XIII
L
IST OF TABLES
TABLE 3.1–EQUIPMENT OF THE VOLUMETRIC UNIT ... 17
TABLE 3.2-MATERIAL USED FOR THE BUILD-UP OF THE VOLUMETRIC UNIT ... 19
TABLE 3.3–REFERENCE AND CELL VOLUME DETERMINED ... 33
TABLE 4.1-PROPERTIES OF THE ADSORBENTS EMPLOYED ... 36
1
1.
M
OTIVATION AND OBJECTIVES
1.1
Motivation
Adsorption processes have been studied in order to present themselves as an alternative for capture, storage and separations processes. The primary objective is to find a process that can be less expensive, faster and more efficient.
Adsorption separation processes have been widely applied to many important separations in the chemical industry [1] [2]. It is currently a growing area with the development of new adsorbent materials and processes. Adsorption separation processes can be performed for raw materials purification, recovery of primary products and removal of polluting gaseous effluents, using the proper adsorbent.
The flue gas emissions from fossil fuelled power plants and also impurities in wastewater streams may contribute to a poor environmental quality being a threat to human health. Thus, as the regulatory limits on environmental emissions become more stringent, industries have developed separation technologies that could remove contaminants and pollutants from process waste streams.
2 strategies, such as switching to low carbon-content fuels, improving energy efficiency, and phasing in the use of renewable energy resources. The two general approaches to reduce carbon emissions from existing plants are post-combustion capture and oxy-combustion. Commercial CO2 capture technologies that exist today, such as monoethanolamine (MEA) chemical absorption, are energy intensive and, therefore expensive. Also, amine scrubbing presents corrosion problems and may cause emission of carcinogenic compounds. Adsorption becomes a viable alternative to amine scrubbing. [6] [3]. Over the years, several materials have been widely used (activated carbon, zeolites) in adsorption based separation processes. Other materials such as metal-organic frameworks have recently been studied in order to evaluate its success. Development of regenerable adsorbents that have high capacity, high selectivity and reversible adsorption of CO2 adsorption/desorption is critical for the success of CO2 capture adsorption processes. In recent literature, it is possible to find extensive assessments in this area [7].
When it becomes necessary to study the characteristics of an adsorbent, the first measurements to be considered is the adsorption equilibrium of pure components. Therefore, it is necessary to have efficient and rapid methods to acquire data quickly and accurately. The research group, where this thesis was performed, already had an adsorption method well established (gravimetric method). The gravimetric apparatus available in the laboratory, although extremely accurate can be slow to obtain data. For that reason it was decided to develop a new apparatus (employing the volumetric method). The volumetric method is a quick and efficient method to obtain adsorption equilibrium data. Moreover, the integration of this method enables the simultaneous use of both units which can be a huge improvement for the research group efficiency in the evaluation of several adsorbents.
1.2
Objectives
The main objective of this thesis was to design and build a volumetric adsorption unit, in order to perform quick and efficient adsorption equilibrium measurements. The adsorption equilibrium of the two major components of fossil fueled power stations flue gases, CO2 and N2, was studied on two different adsorbents. The selected adsorbents were an activated carbon, ANGUARD 5 (Suttclife Speakman, UK) and MIL-53(Al) (Basolite A100® from BASF SE, Germany). Both adsorbents were previously tested in the gravimetric unit available in the
3
2.
B
ACKGROUND
2.1 Adsorption Phenomena
2.1.1 Basic Concepts
The term adsorption was introduced to the literature by Kayser [8] [9] in 1881 to refer to the condensation of gases on bare surfaces. Kayser also introduced the terms isotherm and isotherm curve to represent the results of adsorption experiments. In 1909, McBain [10] proposed the term sorption for adsorption and absorption in the case of phenomena which cannot be distinguished precisely.
The term adsorption is used to denote the enrichment, or accumulation, of one or more components, whether molecules, atoms or ions, in an interfacial layer between two bulk phases. In adsorption of gas-vapour/porous solid interfaces, it is customary to call the components in the adsorbed state the adsorbate, and to refer to the same species in the bulk gas phase as the adsorptive. Additionally, the adsorbing solid is called adsorbent. Adsorption is distinguished from absorption, which involves bulk penetration of the gas/vapour into a mass of the adsorbing solid or liquid. [11] [12]
2.1.2 Physisorption and Chemisorption
4 which ranges between 60 and 4000 kJ/mole [13]. The surface coverage in chemisorption is monolayer. In physisorption, adsorption occurs mainly by van der Waals and electrostatic forces between adsorbate molecules and the adsorbent surface. Because there is no chemical bond between adsorbate molecules and the solid surface, physical adsorption is a reversible process. Physisorption is exothermic and the energy involved is not much larger than the energy of condensation of the adsorbate ranging from 8 to 40 kJ/mole. [13]. It is most likely that adsorption occurs as a monolayer at low pressures and as multilayers at relatively higher pressures, depending on the type of adsorbent and adsorbate used.
2.1.3 Adsorption Isotherms
The quantity of gas taken up by a sample of solid is proportional to the mass m of the
sample, the temperature T, the pressure p of the gas and the nature of both the solid and the gas.
This can be expressed as q, the quantity of gas adsorbed in moles of adsorbate per gram of solid
(or grams of adsorbate per gram of adsorbent). A graph reflecting the amount of adsorbed against pressure, or relative pressure, at constant temperature is called the adsorption isotherm.
On an adsorption study, the adsorption equilibrium data is more commonly expressed through adsorption isotherms. For the design of any adsorption process the equilibrium isotherms are one of the more important parameters. The amount of adsorbent needed in the adsorber is determined by the equilibrium data, which in turn determines the key dimension and operation time for the process. [14]
5
Figure 2.1 – Adsorption isotherms types according to IUPAC (International Union of Pure and
Applied Chemistry) [15]
Type I isotherm shows a rapid increase in the amount of gas adsorbed over the low relative pressure range and then reaches a plateau in the high pressure range. Type I isotherms are sometimes referred to as Langmuir isotherms and are often obtained when adsorption is restricted to a monolayer. Type I isotherms have been found for physical adsorption on solids containing very narrow or slit pore structures like activated carbons or metal organic frameworks.
The Type II isotherms are typically produced by solids which are non-porous or macroporous and the isotherms represent unrestricted monolayer-multilayer adsorption on a heterogeneous adsorbent. These are often referred to as the sigmoid isotherm.
6 The Type IV isotherms are found in many mesoporous solids. A characteristic feature is that the adsorption branch of the isotherm is not the same as the desorption branch of the isotherm and hysteresis is observed. Generally, the hysteresis loop occurs due to the capillary condensation taking place in mesopores.
Type V isotherms, unlike Type III, exhibits a point of inflection at a higher relative pressure. Subsequently, the Type V isotherms reach a plateau in the multilayer region of the isotherm where the capillary condensation occurs. Type V isotherms occur most often with mesoporous adsorbents.
The Type VI isotherm represents the step-like nature of the adsorption process. The steps result from sequential multilayer adsorption on a uniform non-porous surface. Each step-height represents the monolayer capacity for each adsorbed layer. [16]
2.2 Adsorption Measurement Techniques
Several adsorption measurements techniques can be used to determine the adsorption properties of an adsorbent-adsorbate system. This includes adsorption equilibrium, kinetics and heat of adsorption data. All these parameters are key variables for modelling and simulation of any adsorption-based separation process. The most commonly available techniques for the measurement of adsorption equilibrium are classified into three types: calorimetric, gravimetric and volumetric methods [17].
Gravimetric and volumetric methods are widely used for the measurement of adsorption isotherms. Both require an accurate estimate of the volume of the solid adsorbent, in the former method, to make a buoyancy correction and, in the later one, to calculate the volume occupied by the gas phase in the sample cell. [17] The calorimetric method is another important technique employed in adsorption studies and can complement gravimetric and volumetric studies.
2.2.1 Calorimetric Method
7 The calorimetric method measures the temperature variation during the occurrence of adsorption. These measurements are not much less accurate than gravimetric or volumetric methods. Although this method can be useful to study the heat of adsorption, this method is rarely used to determine experimental isotherms [18]. In order to be more effective, this method may be combined with volumetric and/or gravimetric methods.
2.2.2 Gravimetric method
The gravimetric method consists of exposing a clean adsorbent sample to an adsorbate at constant temperature. The change in the weight of the adsorbent sample, pressure and temperature are measured. When those measured quantities no longer vary, the equilibrium is assumed to be reached.
This method allows the direct measurement of the amount adsorbed. The gravimetric method is considered a well-established and accurate technique. With the current equipment
available in the group’s laboratory, a Rubotherm magnetic suspension balance [19], this method can be much more accurate than the volumetric method, although more time consuming. A gravimetric method apparatus is shown on Figure 2.2.
Figure 2.2 – Gravimetric Method Apparatus [20]
8
2.2.3 Volumetric Method
The oldest method still in use for the measurement of adsorption equilibria is the volumetric method, also known as manometric method. The best term to use is still in debate, since the amount adsorbed is measured by the change in gas pressure while the volume is kept constant [21] [22]. However, during this thesis the term volumetric will the primordial choice.
The measurement of gas adsorption isotherms through the volumetric method, gives an indirect measurement of the amount adsorbed. It consists of feeding gas to a reference cell and, subsequently, expanding it into an evacuated adsorption cell containing a clean adsorbent. This procedure should be ideally performed at constant temperature but, with the heat release due to adsorption,is necessary to wait some time for temperature equilibration [21] [23].
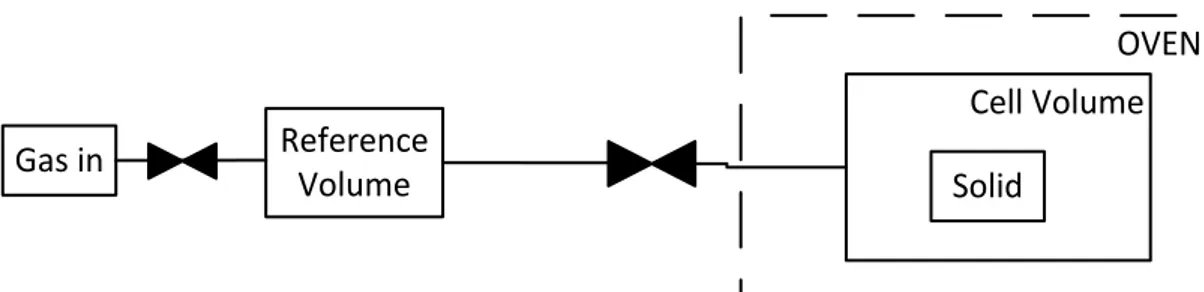
Upon expansion, the sorptive gas is partly adsorbed on the surface of the sorbent material, partly remaining in the gas phase. The amount of gas being adsorbed can be calculated, through a mass balance, if the volume which cannot be penetrated by the sorptive gas molecules is known [14]. An example of the block diagram of a simple volumetric unit setup is shown in Figure 2.3.
OVEN
Gas in
Reference
Volume
Cell Volume
Solid
Figure 2.3– Volumetric Method scheme
In order to obtain an isotherm, the method mentioned above needs to be performed for the same number of times as the amount of experimental points desired. After the first expansion and following pressure equilibrium, the data obtained only origins one single point in the isotherm measured.
9 the previous point. Successive measurements lead to the final data necessary to determine an isotherm.
2.2.3.1 Pros and Cons of Volumetric Method
Advantages
The volumetric gas adsorption instruments are simple and do not require any sophisticated high-tech equipment. Furthermore, the experimental procedure is also simple. For that reason volumetric instruments can be automated and run without permanent supervision.
Volumetric measurements of gas adsorption equilibria are reduced to the measurement of the gas phase pressure and temperature. A great variety of high sensitivity instruments for pressure and temperature measurement are nowadays available, allowing operating in diverse ranges and even in corrosive environments [21].
In the volumetric method, the adsorption cell can be easily inside an oven, which allows the activation of the adsorbent in-situ. In contrast, the gravimetric balance usually does not support higher activation temperatures, thus limiting the solid activation or regeneration inside the adsorption gravimetric cell.
Disadvantages
The amount of sorbent material necessary for volumetric experiments is higher than the sample needed for the gravimetric method. For volumetric measurements usually several grams of adsorbent material are needed.
10
2.3 Adsorbates chosen
2.3.1 Carbon Dioxide
Carbon dioxide (CO2) is a naturally occurring chemical compound composed of 2 oxygen atoms each covalently double bonded to a single carbon atom.
The environmental effects of carbon dioxide are of significant interest. A great amount of the CO2 released into the atmosphere results from the burning of fossil fuels, mainly by the energy production, industry and transportation sectors [24]. The amounts released since the industrial revolution led to global warming due to the CO2 greenhouse gas properties [24].
2.3.2 Nitrogen
Nitrogen (N2) is a colourless and odourless gas of diatomic molecules and it forms about 78% of Earth's atmosphere.
It is also important to study the adsorption equilibrium of N2 in order to better understand and allow the modelling and design of adsorption-based processes for the separation of CO2/N2 which are the main components present in flue gases from fossil fuelled power stations [25].
2.4 Adsorbents
The International Union of Pure and Applied Chemistry (IUPAC) has defined a porous material (or porous solid) as a solid with pores i.e. cavities, channels or interstices, which are deeper than they are wide [12] [26].
According to IUPAC, pores are generally classified into three categories, namely:
11
Mesopores, which have diameters between 2 and 50 nm(20-500 Å);
Macropores, which have diameters larger than 50 nm (>500 Å);
Porous materials demonstrate scientific and technological interest because of their ability to interact with atoms, ions and molecules not only at their surfaces, but also in bulk. The pore sizes, shapes and volumes govern the adsorbent ability for performing the desired function in any particular application. The most important attributes of an adsorbent for any applications are its capacity, selectivity, regenerability, kinetics, compatibility and cost. [27]
Adsorption capacity is the most important characteristic of an adsorbent. Adsorption capacity is of paramount importance to the capital cost a separation process, because it dictates the amount of adsorbent required, which also fixes the volume of the adsorber vessels. Selectivity is related to capacity, and is the ratio of the capacity of one component to that of another at a given fluid concentration. That ratio generally approaches a constant value as concentration decreases towards zero.
All cyclic adsorption applications rely on regenerability, so that the adsorbent can operate in sequential cycles with uniform performance. This mean each adsorbable component must be relatively weakly adsorbed to allow a regeneration step with moderate energy consumption.
The most common commercial adsorbents include silica gel, activated alumina, activated carbon, carbon molecular sieves and zeolites. Lately, metal-organic frameworks (MOFs) have arisen as an interesting adsorbent material and, therefore, a huge amount of studies have been recently published about MOFs. [28] [29] [24]
2.4.1 Activated Carbon
European Council of Chemical Manufacturers' Federation defined activated carbon as non-hazardous, processed, carbonaceous products which have a porous structure and large internal surface [30].
12 Activated carbon is a generic name for a group of porous carbon materials produced by carbonization of carbon-rich organic precursors, followed by physical or chemical activation. These activation processes produce a high porosity and surface area which is suitable for removal of impurities from gases and liquid, gas storage and separation processes [32] [33].
Activated carbons adsorb species from both gaseous and liquid phases and the adsorption process is influenced by the pore size distribution of the activated carbon and size, structure and properties of adsorbate. The usage of carbon adsorbents depends on their surface area, pore size distribution and surface chemical characteristics.
Activated carbons are the most widely used adsorbents. Activated carbons are microporous adsorbents that can be obtained from several raw materials. Basically, the materials that show a high fixed carbon content are potentially able to be activated. The properties of activated carbons are directly related to the nature of the starting material, the type of production method and the temperature of production. In Figure 2.4 a representation of an activated carbon porous matrix is showed.
Figure 2.4- Representation of an activated carbon porous matrix [34]
The materials are converted to activated carbon by a process of manufacture involving the following steps: preparation of the material, pelletization (if that is the case), carbonization at low temperature (400-500°C) to remove volatile materials, and activation that consists on a partial oxidation (800-1000°C). The activation process creates a porous structure in the carbon, whose surface area can range from a few square meters per unit mass or exceed 2000 m2 / g. If the preparation conditions are carefully controlled, one can achieve the desired pore structure with good mechanical strength and resistance to attrition.
13 These unique pore structures play an important role in many liquid and gas phase applications because of their adsorptive capacity. Activated carbon can be used as a catalyst, decolourant or filter, on environmental or medical field and also for gas storage [1]. One of the main applications, gas storage is characterized by storage at low pressure and low volume. This improves the safety criteria and reduces the costs when compared with the traditional storage methods.
2.4.2
Metal Organic Framework (MOF)
A metal-organic framework (MOF) is composed of two major components: a metal ion, or cluster of metal ions, and an organic molecule called linker. The organic units are typically mono, di-, tri-, or tetravalent ligands. The combination of the metal ion or cluster and the organic linker provides endless possibilities for the development of MOF structures [35]. Furthermore, pore size of these frameworks can be expanded or collapsed [36] [37] [38].
The MOFs have been explored due to their interesting optical, magnetic, and electronic properties, as well as their potential applications such as in catalysis, ion-exchange, gas storage and separation, sensing, polymerization and drug-delivery [35].
MOFs attracted attention as materials for adsorptive gas separation and storage because of their exceptionally high specific surface areas and chemically tunable structures. MOFs can be considered as a three-dimensional grid. Gas molecules are stored in a MOF by adsorbing to its surface without space-blocking by non-accessible volume. Also, MOFs have a fully reversible uptake-and-release behaviour: since the storage mechanism is based primarily on physisorption, there are no large activation barriers to be overcome when liberating the adsorbed gases [39].
The MIL-n (Materials of the Institute of Lavoisier) MOF series, were synthesized by Férey and co-workers. MIL materials are accepted as promising candidates for the adsorption of some important gases, such as CO2 [40] [41].
14 form. However, during gas adsorption, the lp phase becomes np at low pressures and inverse transformation occurs at higher pressures [29] [28] [41]. Figure 2.5 shows a representation of MIL-53(Al).
Figure 2.5- Representation of the metastable lp and np structures of the MIL-53(Al) material,
15
3.
C
ONSTRUCTION AND ASSEMBLY OF THE
VOLUMETRIC UNIT
The main objective of this thesis was the design, construction, assembly and validation of a volumetric adsorption unit for measurement of equilibrium data.
This chapter covers the description of the volumetric adsorption unit and the software developed for unit control and data acquisition. The volumetric unit can be divided in two parts: the main section and section which includes the electrical supply, data acquisition and control. The unit development comprised the design, and then the selection of the necessary material in order to do a proper assembly. After this, the unit was build-up and then proper software was developed to control the volumetric unit and acquire the data obtained.
3.1. Volumetric Unit Design
16
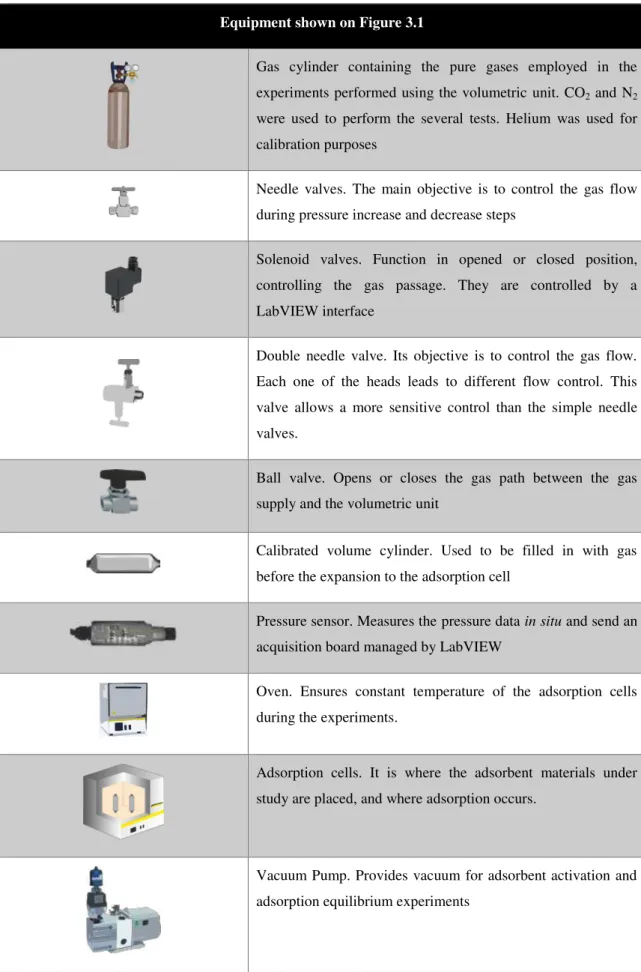
17 Equipment shown on Figure 3.1
Gas cylinder containing the pure gases employed in the experiments performed using the volumetric unit. CO2 and N2 were used to perform the several tests. Helium was used for calibration purposes
Needle valves. The main objective is to control the gas flow during pressure increase and decrease steps
Solenoid valves. Function in opened or closed position, controlling the gas passage. They are controlled by a LabVIEW interface
Double needle valve. Its objective is to control the gas flow. Each one of the heads leads to different flow control. This valve allows a more sensitive control than the simple needle valves.
Ball valve. Opens or closes the gas path between the gas supply and the volumetric unit
Calibrated volume cylinder. Used to be filled in with gas before the expansion to the adsorption cell
Pressure sensor. Measures the pressure data in situ and send an
acquisition board managed by LabVIEW
Oven. Ensures constant temperature of the adsorption cells during the experiments.
Adsorption cells. It is where the adsorbent materials under study are placed, and where adsorption occurs.
Vacuum Pump. Provides vacuum for adsorbent activation and adsorption equilibrium experiments
18
3.1.1 Material
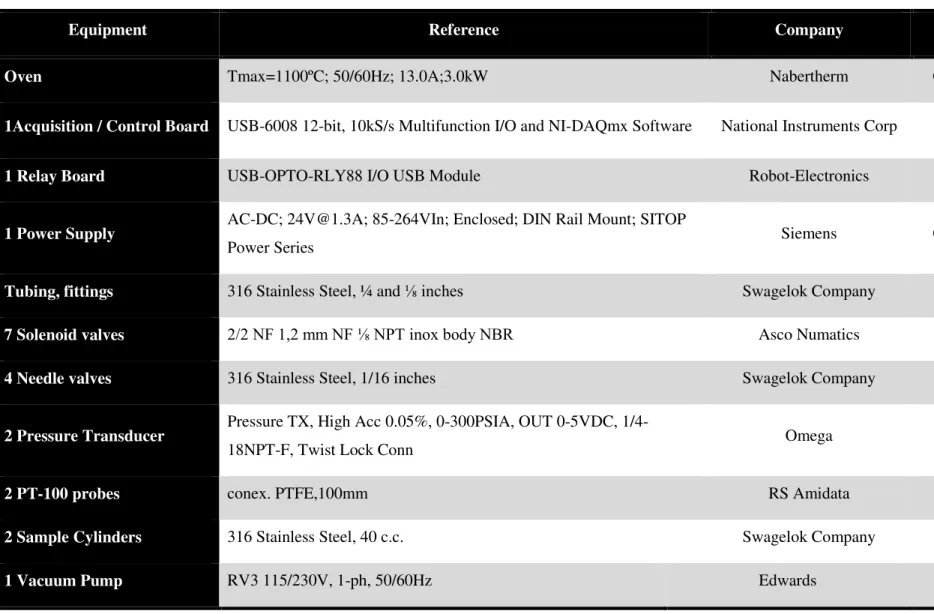
After the unit design, it was required to select the necessary material and equipment in order to build-up the volumetric unit. On table 3.2, the materials used are described in more detail and
19
Equipment Reference Company Country Price/€
Oven Tmax=1100ºC; 50/60Hz; 13.0A;3.0kW Nabertherm Germany 3249,95
1Acquisition / Control Board USB-6008 12-bit, 10kS/s Multifunction I/O and NI-DAQmx Software National Instruments Corp USA 204,98
1 Relay Board USB-OPTO-RLY88 I/O USB Module Robot-Electronics UK 75,50
1 Power Supply AC-DC; [email protected]; 85-264VIn; Enclosed; DIN Rail Mount; SITOP
Power Series Siemens Germany 41,65
Tubing, fittings 316 Stainless Steel, ¼ and ⅛ inches Swagelok Company USA 1000,00
7 Solenoid valves 2/2 NF 1,2 mm NF ⅛ NPT inox body NBR Asco Numatics USA 815,74
4 Needle valves 316 Stainless Steel, 1/16 inches Swagelok Company USA 568,00
2 Pressure Transducer Pressure TX, High Acc 0.05%, 0-300PSIA, OUT 0-5VDC,
1/4-18NPT-F, Twist Lock Conn Omega UK 1423,08
2 PT-100 probes conex. PTFE,100mm RS Amidata Portugal 86,80
2 Sample Cylinders 316 Stainless Steel, 40 c.c. Swagelok Company USA 153,00
1 Vacuum Pump RV3 115/230V, 1-ph, 50/60Hz Edwards UK 1548,00
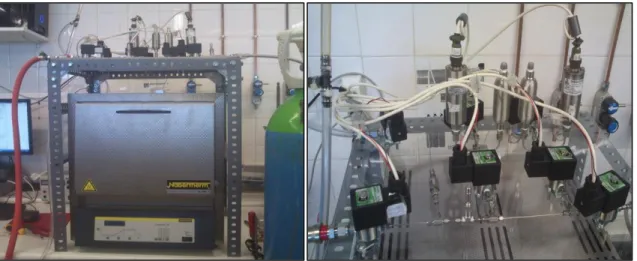
20 Following the selection of the equipment and its acquisition, the unit was built. In Figure 3.2 the volumetric unit developed is displayed.
Figure 3.2– General View of the Volumetric Unit
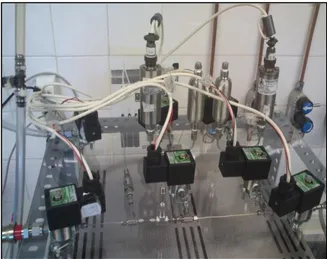
3.1.2 Main Section
The main section comprises the area where the adsorption process will take place. Excluding the gas supply, the electrical section and the vacuum pump, all the remaining material is included in this section.
3.1.2.1 Section above the oven
21 line). Their position is shown on Figure 3.1. The needle valves (Swagelok, USA) are used to control the gas flow. There were used four needle valves, one before the first solenoid valve, V1, and after the gas entry, one on each line after the correspondent solenoid valve that ends the reference volume and one before the vacuum and atmospheric lines. The sample volumes (50, cm3, Swagelok, USA) are used to obtain a certain reference volume. The PT-100 (RS Amidata, Spain) probes are used to acquire temperature data. The tubing used is stainless steel with
⁄
inches of diameter on the reference volume, and the rest of the unit uses tube with⁄
inches of diameter. Both tubes were supplied by Swagelok, USA. Figure 3.3 shows a detail of the main section.Figure 3.3 - Detail of the Volumetric Unit Main Section
3.1.2.2 The oven
22
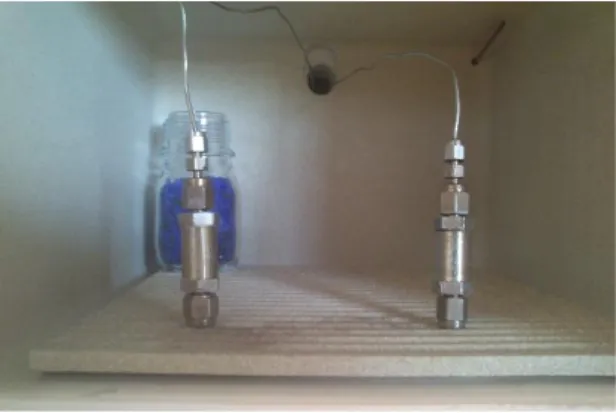
Figure 3.4 - Detail of the two adsorption cells inside the Oven
3.1.3 Electrical and Data Acquisition/Control Section
On the side of the unit was built the section of electrical supply and data acquisition and control. It consists of a 24V DC power supply (Siemens, Germany), a relay board with USB connection (Robot Electronics, UK) and a USB data acquisition board (National Instruments, USA). The relay board has 8 relay output, but in this case, only seven are used (one for each valve). Each one of these signals is connected to a specific valve and is LabVIEW commanded by communication through an USB port. The data acquisition board (National Instruments, USA) is connected to the PC by a USB port, which serves for communication and also power supply. The 24V DC power supply (Siemens, Germany) provides power for the pressure transducers. This section is shown in Figure 3.5.
23
3.1.4 Complementary Sections
The Complementary section comprises the remaining material used that does not belong in the previous sections. The gas supply is given to the unit using a cylinders acquired from Air Liquide. The purities of the gases employed are: CO2 > 99.998%, N2 > 99.995%, and He > 99.999%. The vacuum pump was acquired from Edwards, United Kingdom and provides vacuum for adsorbent activation and adsorption equilibrium experiments.
3.2. Control and Acquisition Software
For the control and data acquisition of the volumetric unit the software LabView was used.
LabVIEW (Laboratory Virtual Instrument Engineering Workbench) is a graphical programming language first released by National Instruments in 1986. This software uses icons instead of lines of text to create applications. In contrast to text-based programming languages, where instructions determine program execution, LabVIEW uses dataflow programming, where the flow of data determines execution. Its graphical nature makes it ideal for test and measurement, automation, instrument control, data acquisition, and data analysis applications. This results in significant productivity improvements over conventional programming languages.
The LabVIEW programming element is called a Virtual Instrument (VI). A VI consists of a front panel, block diagram, and an icon that represents the program. The front panel is used to display controls and indicators for the user, while the block diagram contains the code for the VI. The icon, which is a visual representation of the VI, has connectors for program inputs and outputs.
24
3.2.1 The front panel
When a blank VI is opened, an untitled front panel window appears. This window displays the front panel and is one of the two LabVIEW windows used to build a VI. The front panel is the window through which the user interacts with the program. The input data to the executing program is fed through the front panel and the output can also be viewed on the front panel, thus making it indispensable. [42]
3.2.2 The block diagram
The block diagram window holds the graphical source code of a LabVIEW's block diagram and corresponds to the lines of text found in a more conventional language like C or BASIC –it is the actual executable code. The block diagram can be constructed with the basic blocks such as: terminals, nodes, and wires. After the front panel is built, the user can add code using graphical representations of functions to control the front panel objects. The block diagram contains this graphical source code. Front panel objects appear as terminals, on the block diagram. Block diagram objects include terminals, subVIs, functions, constants, structures, and wires, which transfer data among other block diagram objects. [42] [43]
25
26 The interface shows a scheme of the unit designed with two graphics showing the data read by the each pressure sensor in real time. The valves V1 to V7 represent the solenoid valves and control the valve position (opened/closed) by clicking with the mouse above the represented controller. This is the only controller in the interface. All the other pieces are only representations or indicator (in the case of the pressure sensor, which provides the reading of the pressure at each second. The oven, the gas bottle and the needle valves are manually controlled. The file path represented on the interface is used to choose the PC location to store the data read from the pressure sensors.
This interface was constructed by manipulating the block diagram on LabView.
The first step is to create the valve control. The valves shown on the interface are controllers that send the information to the relays board which then send the same information the solenoid valves. The open/close function is observed by the green/red colour change on the valves shown in the interface.
After the valve control, acquisition of the data obtained by the pressure sensors was programmed. It was used the DAQ assistant on the block diagram, which allows the data collection by configuring and calibrating each sensor. Figure 3.8 shows the LabVIEW DAQ assistant on the block diagram.
Figure 3.7 – LabVIEW DAQ assistant
Finally, it was used the “write to file” function in order to secure the data (time and pressure) in an
27
3.3 Initial Measurements
After the assembly of the unit and the conclusion of the LabView interface the apparatus was ready to be tested. At this stage, the first task to perform was the calibration of the reference and cell volumes. The rigorous knowledge of these values is fundamental to solve the mass balances that will allow the determination of the adsorbed amounts.
3.3.1. Reference Volume Calibration
The determination of the exact values (calibration) of the reference and cell volumes was performed using a vessel (or cylinder) with known volume. The calibration procedure was the same for both lines so only one of them is described.
28
29 Initially all parts of the unit must remain under vacuum. Then the valve closing the auxiliary cylinder is opened along with valves V1 and V4 and a certain amount of pressure is fed to the opened parts of the unit. This is represented in Figure 3.10. The pressure is measured with the sensor on the green line.
Figure 3.9 - First step for volume calibration procedure
30
Figure 3.10 - Second step for volume calibration procedure
31
Figure 3.11 - Final step for volume calibration procedure
The volume calculations on the second step, the residual volume, were performed employing the ideal gas law (equation 1).
Equation 1
Since the amount of gas present in the system is maintained, the mass balance of equation 2 can be used.
32 Regarding that the apparatus is all at the same temperature, equation 2 can be simplified to
⇔
Equation 3
Where is the volume for the first step on the calibration process. In order to obtain the reference volume similar equations can be used. Assuming that the temperature is the same,
⇔
Equation 4
Since the objective of this procedure was the determination of the reference volume, a final calculation must be done. The total volume obtained in the previous equation comprehends all the volume show in Figure 3.11. The reference volume is obtained by the difference between this total volume and the volume obtained in the previous step.
Equation 5
The same method is used to determine the volumes on the other line.
3.3.2 Cell Volume Calibration
33 determination of the cell volume. For the calculation of the cell volume, the ideal gas law was used and the following equation was obtained. The remaining calculations are on Annex A.
(
) (
)
Equation 6
Where is the cell Volume (Line 1 or 2), the pressure after gas expansion, is the pressure of the reference volume before expansion, is the pressure of the cell volume before expansion, the temperature of the system after expansion, is the temperature of reference volume before expansion and is the temperature of cell volume before expansion.
3.3.3 Final Considerations
After successfully performing the volumes determination, the obtained values for the reference and cell volumes of both lines are represented in Table 3.3.
The obtained volumes characterize the volumetric unit built and will be important to solve the mass balances needed for determination of the amount adsorbed.
Variable Value
Line 1 Line 2
Reference Volume (Vref) 43,433±0,18 cm3 43,371±0,19 cm3 Cell Volume (Vc) 2,226±0,48 cm3 2,551±0,51 cm3
35
4.
V
OLUMETRIC UNIT VALIDATION
In this chapter adsorption studies using both adsorption cells in parallel are presented. For this purpose, an activated carbon, and a MOF were packed inside each cell. Measurement of CO2 and N2 adsorption isotherms at different temperatures (30ºC. 80ºC and 150ºC) for carbon dioxide and 50ºC for nitrogen) were performed. The carbon dioxide isotherms data was acquired for a pressure range between 0 and 10 bar for 30ºC and between 0 and 15 bar for 80ºC and 150ºC. The nitrogen isotherms data was acquired for a pressure range between 0 and 20 bar. Later, the results obtained were compared with data obtained by the group in a gravimetric apparatus.
4.1 Adsorbent Activation
The adsorbents selected to perform the volumetric unit tests were materials previously studied by the group. This ensures that the behaviour of the adsorbents to test is already known which facilitates the validation of the unit built. For this purpose an activated carbon (ANGUARD 5 from Sutcliffe Speakman Ltd., UK) in the form of extrudates and a MOF (MIL-53(Al) from BASF SE) in the form of powder were employed. Samples of 0,29 grams of ANG5 and 0,33 grams of MIL-53(Al) were packed in each adsorption cell. Table 4.1 summarizes the properties of the adsorbents employed.
Prior to the measurement of the adsorption equilibrium data, the adsorbents were degassed (or activated). This procedure was performed to remove any impurities and moisture adsorbed in the solids. The activation was performed in situ, which is one of the advantages of this newly built
36
ANGUARD 5 [19] MIL-53(Al) [29]
BET surface area (m2/g) 1342 831 Total pore volume (cm3/g) 0,881 0,597 Micropore volume (cm3/g) 0,777 0,332
Table 4.1 - Properties of the adsorbents employed
4.2 Adsorption Equilibrium Measurements
First it is imperative to determine the equations that will be used for the determination of each isotherm.
The primordial equation to be used in every calculation is the real gas law. The following image illustrates what happens during the volume expansion.
Vref
OVEN
Vcell Vs Tamb
Pref
Toven
Pexp
Figure 4.1 - Volume Expansion illustration
In the first step, the gas is at room temperature with initial pressure of Pref (pressure at reference
volume). When the valve opens, the gas expands to the cell containing the solid adsorbent. After some time the equilibrium will be reached with the adsorbent at Toven (temperature of the oven) and at Pexp
(pressure after the expansion). From the mass balance (Annex B) the following expression is obtained
( ) ( )
37 The mass balance also considers the previous step as in each measurement an amount of gas remains in the cell.
Now, it is only necessary to choose the reference state to represent each isotherm. To determine the absolute amount adsorbed (qt), a few more steps into the equation must be done.
The absolute state can be determined from the excess state (qex). They are related by
Equation 8
Where is the porous volume of the solid and is the density of the gas under study in each experiment.
4.2.1 Error determination
The volumetric method is a standard method for measuring gas adsorption and is very simple to implement. However, if adsorption measurements are collected in a cumulative fashion without desorbing between each point, errors in the data can accumulate linearly. Therefore, it is important to identify all the major sources of error in a volumetric adsorption measurement.
The error estimation was performed using an equation accounting for multivariable and cumulative error
| |
Equation 9
38
4.2.2 Carbon Dioxide Isotherms
There were performed three carbon dioxide isotherms at three different temperatures, 30ºC, 80ºC and 150ºC both on activated carbon, ANGUARD 5, and on MIL-53(Al) metal-organic framework,. The isotherms measured at 80ºC and 150ºC covered a pressure range from 0 to 15 bar while the 30ºC isotherm was measured in a pressure range from 0 to 10 bar. The results are shown below.
Figure 4.2 - Total amount adsorbed of carbon dioxide on ANGUARD 5 at 30ºC, 80ºC and 150ºC
Figure 4.3 - Total amount adsorbed of carbon dioxide on MIL-53(Al) at 30ºC, 80ºC and 150ºC
0 0,05 0,1 0,15 0,2 0,25 0,3
0 2 4 6 8 10 12 14 16
q
t
(g/g
)
P (bar)
30ºC 80ºC 150ºC
0 0,02 0,04 0,06 0,08 0,1 0,12 0,14 0,16 0,18 0,2
0 2 4 6 8 10 12 14 16
q
t
(g/g
)
P (bar)
39 It is possible to see that all isotherms, despite the temperature change, show a Type I behaviour, as it would be expected. Both materials used, ANGUARD 5 and MIL-53 (Al), are microporous materials that will provide type I isotherms. The isotherms also display a proper behaviour regarding the temperature since the isotherms are shown from top to bottom when the temperature increases. However the isotherms also show some deviation between adsorption and desorption points. This could be related to the unidirectional behaviour of the solenoid valves.
4.2.3 Nitrogen Isotherms
There was measured one nitrogen isotherm, at 50ºC on an activated carbon, ANGUARD 5, and on a metal-organic framework, MIL-53. The pressure range studied was 0 to 20 bar. The adsorption isotherms of N2 at 50ºC obtained is showed in Figure 4.3 for ANGUARD 5 and Figure 4.4 for MIL-53(Al)
Figure 4.4 - Total amount adsorbed of nitrogen on ANGUARD 5 at 50ºC
0 0,01 0,02 0,03 0,04 0,05 0,06 0,07 0,08 0,09 0,1
0 5 10 15 20
q
t
(g/g
)
P (bar)
40
Figure 4.5 - Total amount adsorbed of nitrogen on MIL-53(Al) at 50ºC
It is possible to see that all isotherms, despite the temperature change, show a Type I behaviour, as it would be expected. Both materials used, ANGUARD 5 and MIL-53 (Al), are microporous materials that will provide type I isotherms.
4.3 Volumetric Data versus Gravimetric Data
After the measurement of the CO2 and N2 isotherms the obtained data was compared with the data previously obtained by the group in the gravimetric apparatus. The data obtained in the gravimetric apparatus for CO2 isotherms does not correspond to the temperatures studied in this thesis apart from the CO2 isotherm on MIL-53-Al at 80ºC. A model, the Sips model, whose parameters have been determined in said gravimetric equipment, was used. The N2 isotherms were compared with experimental data from the gravimetric apparatus. The Sips model, as shown on equation 11, is a combination between Freundlich and Langmuir equations to allow the achievement of an improved fit at higher pressures. [44]
⁄ ⁄ Equation 10 0 0,01 0,02 0,03 0,04 0,05 0,06
0 5 10 15 20
q
t
(g/g
)
P (bar)
41 Where is the amount adsorbed in mole per unit mass or volume, is the maximum amount adsorbed, is the affinity constant and measure how strong the adsorbate molecule is attracted to a surface, is the pressure and the parameter characterizes the interaction between adsorbate/adsorbent and its magnitude increases with the heterogeneity of the system.
To perform the comparison between the experimental data obtained with the volumetric method and the gravimetric method the following parameters were used to determine the Sips model.
ANGUARD 5 MIL-53 (Al) qs (g/g) 0,907 0,398
b0(bar-1) 0,036 0,113
α 0,126 0,142
n0 1,252 1,437
Q (J/mol) 19580 24998,09 T0 (K) 299,1 303,163
Rg J/(mol.K) 8,314 8,314 Table 4.2 - Parameters used on Sips model
The affinity constant and the parameter can be written in function of the temperature as:
[ ( )]
Equation 11
( )
42
4.3.1 Carbon Dioxide Isotherms
ANGUARD 5
Figure 4.6 - Comparison between total amount adsorbed of carbon dioxide on ANGUARD 5 at 30ºC,
80ºC and 150ºC with data obtained with the Sips model
MIL-53(Al)
Figure 4.7 - Comparison between total amount adsorbed of carbon dioxide on MIL-53(Al) at 30ºC and
150ºC obtained experimentally with Sips model
0 0,05 0,1 0,15 0,2 0,25 0,3
0 2 4 6 8 10 12 14 16
q
t
(g/g
)
P (bar)
30ºC experimental 80ºC experimental 150ºC experimental 30ºC, Sips model 80ºC, Sips model 150ºC, Sips model
0 0,05 0,1 0,15 0,2 0,25
0 5 10 15
43 The isotherm with MIL-53(Al) at 80ºC was compared with results taken simultaneously with this study.
Figure 4.8 - Comparison between total amount adsorbed of carbon dioxide on MIL-53(Al) at 80ºC
obtained experimentally with data obtained from the gravimetric apparatus
As can be observed from the previous figures, the experimental data obtained with the volumetric method tend to fit with the data obtained with the gravimetric method. At 30ºC and 80ºC the comparison shows great results, as the deviation between the volumetric and gravimetric data is minimal. However, as the temperature rises, the difference between the experimental results and the results of the model used increases. This is due to the fact that, as the temperature rises, the difference between the temperature inside and outside of the oven also increases. Also, this data was extrapolated from the parameters obtained from the fitting of the Sips isotherms from gravimetric method which can lead to some errors.
4.3.2 Nitrogen Isotherm
The nitrogen isotherms with ANGUARD 5 were compared with results already published. [19]. The isotherms with MIL-53(Al) were compared with results taken simultaneously with this study.
0 0,05 0,1 0,15 0,2 0,25
0 2 4 6 8 10 12 14 16
q
t
(g/g
)
P (bar)
44
Figure 4.9 - Comparison between total amount adsorbed of nitrogen on ANGUARD 5 at 50ºC
obtained experimentally with data obtained from the gravimetric apparatus
Figure 4.10 - Comparison between total amount adsorbed of nitrogen on MIL-53(Al) at 50ºC obtained
experimentally with data obtained from the gravimetric apparatus
The volumetric data tend to fit with the gravimetric data. The comparison shows great results, as the deviation between the volumetric and gravimetric data is minimal.
0 0,01 0,02 0,03 0,04 0,05 0,06 0,07 0,08 0,09 0,1
0 5 10 15 20
q t( g /g ) P (bar)
Volumetric Method Gravimetric Method
0 0,01 0,02 0,03 0,04 0,05 0,06 0,07
0 5 10 15 20
q t( g /g ) P (bar)
45
5.
C
ONCLUSIONS AND SUGGESTIONS FOR
FUTURE WORK
5.1 Conclusions
The main objective of this thesis was to design and build a lab-scale volumetric adsorption unit.
The unit was fully mounted at the group’s lab, including the development of appropriate software for
unit operation and monitorization. The unit allows the measurement of adsorption equilibrium data on two different adsorbent samples simultaneously.
After concluding the assembly of the volumetric unit, several adsorption equilibrium data was obtained, on previously studied adsorbent materials, in order perform the unit validation. For this purpose two different microporous materials were chosen, an activated carbon in the form of extrudates (ANGUARD 5 from Sutcliffe Speakman Ltd., UK ) and a powdered MOF (MIL-53(Al) synthesized by BASF SE (Germany)). Carbon Dioxide and Nitrogen isotherms were measured on both adsorbents at different temperatures (30ºC, 80ºC and 150ºC for CO2 and 50ºC for N2) and pressure (0-15 bar for CO2 and 0-20 bar for N2). The isotherms obtained showed type I behaviour as expected.
46
5.2 Suggestions for Future Work
The development of the proposed ideas in this dissertation, together with the fruitful analysis of other studies, helped to identify potential areas for improvement and a number of issues that need to be investigated.
Regarding the volumetric unit itself, it would be interesting to add more lines in order allow measuring adsorption equilibrium data on more adsorbents samples in parallel. Among the most interesting features of the designed unit is the possibility of measuring adsorption isotherms at high temperatures. Therefore, measurement of adsorption equilibrium at high temperatures can be of great interest for, especially for modelling of adsorption based separation processes as Temperature Swing Adsorption.
Since in the designed unit the reference volume is outside the oven, there is a difference between its temperature and the adsorption cell temperature. Despite the fact that both temperatures are being measured, in the interface oven/environment a temperature gradient occurs. The influence of this gradient in the adsorption equilibrium measurements for high temperatures should be investigated. If this effect proves to be significant, the implementation of a temperature control apparatus for the reference volume (a thermal bath, for example) must be envisioned.
47
6.
B
IBLIOGRAPHY
[1] D. M. Ruthven, Principles of Adsorption and Adsorption Processes, John Wiley and Sons, Inc, 1984.
[2] R. T. Yang, Adsorbents: Fundamentals and Applications, John Wiley and Sons, Inc., 2003.
[3] S. Xiang, Y. He, Z. Zhang, H. Wiu, W. Zhou, R. Krishna and B. Chen, “Microporous metal -organic framework with potential for carbon dioxide capture at ambient conditions,” Nature Communications, pp. 1-9, 2012.
[4] A. J. S.A. Roosa, Carbon Reduction: Policies. Strategies and Technologies, The Fairmont Press, 2009.
[5] IPCC, “IPCC Special Report on Carbon Dioxide Capture and Storage,” Cambridge University Press, 2005.
[6] J. P. Ciferno, T. E. Fout, A. P. Jones and J. T. Murphy, “Capturing carbon from existing coal
-fired power plants,” Chem. Eng. Prog., pp. 33-41, 2009.
[7] D. M. D'Alessandro, B. Smit and J. R. Long, “Carbon Dioxide Capture: Prospects for New Materials,” Angew. Chem. Int., vol. 49, pp. 6058-6082, 2010.
[8] H. Kayser, Wied. Ann, 1881.
[9] J. Sameshima, “The sorption of gas by charcoal as a dissolution phenomenon,” Chem. Soc. Jpn, pp. 1-10, 1927.
[10] J. W. McBain, Phil. Mag., vol. 18, p. 916, 1909.
[11] A. Dabrowski, “Adsorption - from theory to practice,” Adv. Colloid Interface Sci., pp.
48 [12] K. S. W. Sing, D. H. Everett, R. A. W. Haul, L. Moscou and J. Rouquerol, “Reporting
physisorption data for gas/solid systems with special reference to the determination of surface
area and porosity,” Pure Appl. Chem, pp. 603-19, 1985.
[13] J. D. D. D. a. D. H. D. Choi, “Surface diffusion of adsorbed molecules in porous media: Monolayer, multilayer, and capillary condensation regimes,” Ind.Eng.Chem.Res., vol. 40, pp.
4005-4031, 2001.
[14] A. Kumar, “Adsorption of Methane on Activated Carbon by Volumetric Method,” National
Institute of Technology, Rourkela, 2011.
[15] D. D. Do, Adsorption Analysis: Equilibria and Kinetics, London: Imperial College Press, 1998.
[16] S. J. a. S. K. S. W. Gregg, Adsorption, surface area and porosity, N.Y.: Academic Press, 1982.
[17] E. Ozdemir, “Chemistry of the Adsorption of Carbon Dioxide by Argonne Premium Coals and a Model to Simulate CO2 Sequestration in coal Seams,” University of Pittsburgh, 2004.
[18] J. B. Condon, Surface Area and Porosity Determinations by Physisorption. Measurements and Theory, Elsevier, 2006.
[19] M. S. L. P. M. N. J. P. M. Isabel A.A.C. Esteves, “Adsorption of natural gas and biogas components on activated carbon,” Separation and Purification Technology, vol. 62, p. 281–296,
2008.
[20] T. O. Gumma S., “ Net Adsorption: A thermodynamic Framework for Supercritical Gas Adsorption and Storage in Porous Solids,” American Chemical Society, 2010.
[21] J. K. a. R. Staudt, Gas Adsorption Equilibria: Experimental Methods and Adsorptive Isotherms, Boston: Springer Science and Business Media, Inc., 2005.
49 [23] M. Belmabkhout, M. Frère and G. De Weireld, “High-pressure adsorption measurements. A
comparative study of the volumetric and gravimetric methods,” Measurement Sience and Technology, vol. 15, p. 848–858, 2004.
[24] J.-R. Li, Y. Ma, M. C. McCarthy, J. Sculley, J. Yu, H.-K. Jeong, P. B. Balbuena and H.-C.
Zhou, “Carbon Dioxide Capture-Related Gas Adsorption and Separation in Metal-Organic
Frameworks,” Coordination Chemistry Reviews, vol. 255, pp. 1791-1823, 2011.
[25] R. P. P. L. Ribeiro, “Electric Swing Adsorption for Gas Separation and Purification,” Porto,
2013.
[26] J. Rouquerol, D. Avnir, C. W. Fairbridge, D. H. Everett, J. M. Haynes, N. Pernicone, J. D. F.
Ramsay, K. S. W. Sing and K. K. Unger, “Recommendations for the characterization of porous solids (Technical Report),” Pure Appl. Chem, pp. 1739-58, 1994.
[27] K. S. Knaebel, Adsorbent Selection, Adsorption Research, Inc.
[28] F.-X. C. M.-A. S.-H. A. V. N. G. F. a. A. H. F. A. Boutin, “The Behavior of Flexible MIL
-53(Al) upon CH4 and CO2 Adsorption,” The Journal of Physical Chemistry, vol. 114, pp.
22237-22244, 2010.
[29] I. A. E. F. J. C. a. J. P. M. A. Lyubchyk, “Experimental and Theoretical Studies of
Supercritical Methane Adsorption in the MIL-53(Al) Metal Organic Framework,” The Journal of Physical Chemistry, vol. 115, pp. 20628-20638, 2011.
[30] E. C. o. C. M. Federations/CEFIC, “Test Methods for Activated Carbon,” Brussels, 1986.
[31] R. J. F. Coulson J. M., Tecnologia Química, Fundação Calouste Gulbenkian, 1982.
[32] H. Marsh, Introduction to Carbon Science, 1989.
[33] G. J. McDougall, “The physical nature and manufacture of activated carbon,” Journal of The Southern African Institute of Miningand Metallurgy, pp. 109-20, 1991.
[34] Sushrut Chemicals, “Activated Carbon,” [Online]. [Accessed 10 February 2014].
![Figure 2.2 – Gravimetric Method Apparatus [20]](https://thumb-eu.123doks.com/thumbv2/123dok_br/16490682.733144/27.892.360.541.745.945/figure-gravimetric-method-apparatus.webp)
![Figure 2.4- Representation of an activated carbon porous matrix [34]](https://thumb-eu.123doks.com/thumbv2/123dok_br/16490682.733144/32.892.341.580.573.749/figure-representation-activated-carbon-porous-matrix.webp)
![Figure 2.5- Representation of the metastable lp and np structures of the MIL-53(Al) material, as a 2 ×2×2 supercell viewed along the axis of the unidimensional channels [28]](https://thumb-eu.123doks.com/thumbv2/123dok_br/16490682.733144/34.892.320.596.233.544/figure-representation-metastable-structures-material-supercell-unidimensional-channels.webp)