Volume 2012, Article ID 692593,19pages doi:10.1155/2012/692593
Research Article
Throughput Maximization of Queueing
Networks with Simultaneous Minimization of
Service Rates and Buffers
F. R. B. Cruz,
1G. Kendall,
2L. While,
3A. R. Duarte,
4and N. L. C. Brito
51Departamento de Estat´ıstica, Universidade Federal de Minas Gerais, 31270-901 Belo Horizonte, MG, Brazil
2School of Computer Science, University of Nottingham, Jubilee Campus, Wollaton Road, Nottingham NG8 1BB, UK
3School of Computer Science & Software Engineering, The University of Western Australia, 35 Stirling Highway, Crawley, WA 6009, Australia
4Departamento de Matem´atica, Universidade Federal de Ouro Preto, 35400-000 Ouro Preto, MG, Brazil 5Departamento de Ciˆencias Exatas, Universidade Estadual de Montes Claros,
39401-089 Montes Claros, MG, Brazil
Correspondence should be addressed to F. R. B. Cruz,fcruz@est.ufmg.br
Received 27 August 2011; Revised 11 November 2011; Accepted 12 November 2011
Academic Editor: Hung Nguyen-Xuan
Copyrightq2012 F. R. B. Cruz et al. This is an open access article distributed under the Creative Commons Attribution License, which permits unrestricted use, distribution, and reproduction in any medium, provided the original work is properly cited.
The throughput of an acyclic, general-service time queueing network was optimized, and the total number of buffers and the overall service rate was reduced. To satisfy these conflicting objectives, a multiobjective genetic algorithm was developed and employed. Thus, our method produced a set of efficient solutions for more than one objective in the objective function. A comprehensive set of computational experiments was conducted to determine the efficacy and efficiency of the proposed approach. Interesting insights obtained from the analysis of a complex network may assist practitioners in planning general-service queueing networks.
1. Introduction
In this study, the maximization of throughput Θ the number of jobs, parts, clients, etc., served per unit of timein an acyclic, general-service time queueing networkfor an example, seeFigure 1was evaluated. To obtain the maximumΘ, the minimum number of buffersK
{K1, K2, . . . , Kn}and service ratesµ{µ1, µ2, . . . , µn}that must be allocated to a queueing
network in a given topology and external arrival rateΛ{Λ1,Λ2, . . . ,Λn}was determined.
Λ1 M/G/1/K1 M/G/1/K2 M/G/1/K3 M/G/1/K4 M/G/1/K5 M/G/1/K6 M/G/1/K7 M/G/1/K8 M/G/1/K9 M/G/1/K10 M/G/1/K11 M/G/1/K12 M/G/1/K13 M/G/1/K14 M/G/1/K15 M/G/1/K16 Λ7 Λ8 Λ9 Λ10 Λ11 Λ12 Λ13 2 3 4 5 6 7 8 9 10 11 12 13 14 15 16 Λ2 Λ3 Λ4 Λ5 Λ14 Λ15 Λ16 Λ6 μ1 μ2 μ3 μ4 μ5 μ6 μ7 μ8 μ9 μ10 μ11 μ12 μ13 μ14 μ15 μ16 1 Θ
Figure 1:A complex networkadapted from Smith and Cruz 20.
to understand and improve various real-life systems, including manufacturing 1–5, production 6–8, and health 9–11systems, urban or pedestrian traffic 12,13, computer and communication systems 14–17, web-based applications with tiered configurations 18, and quality-of-serviceQoSrequirements measured in terms of response times, throughput, server availability, and security 19.
This study focused on single-server queueing networks with exponentially distributed interarrival times and generally distributed service times, configured in an arbitrary acyclic, series-parallel topology. An example of the type of network under consideration is shown inFigure 1. In particular, buffer allocation, server allocation, and throughput tradeoffwere optimized in networks ofM/G/1/Kqueues. Thus, in Kendall 21notation, we focused on Markovian arrivals, generally distributed service times, a single server, and the total capacity ofKitems,includingthe item of service.
Indeed, there is a critical tradeoffbetween the overall number of buffers and service rates and the resulting throughput. Buffers and service capacities can be very expensive; thus, the total number of buffers and the overall service capacity should be reduced as much as possible. On the other hand, the highest possible network throughput is also desired. Unfortunately, throughput is directly affected by the number of buffers allocated, where an increase in buffers generally leads to a higher throughput. Likewise, the service capacity also directly affects the throughput.
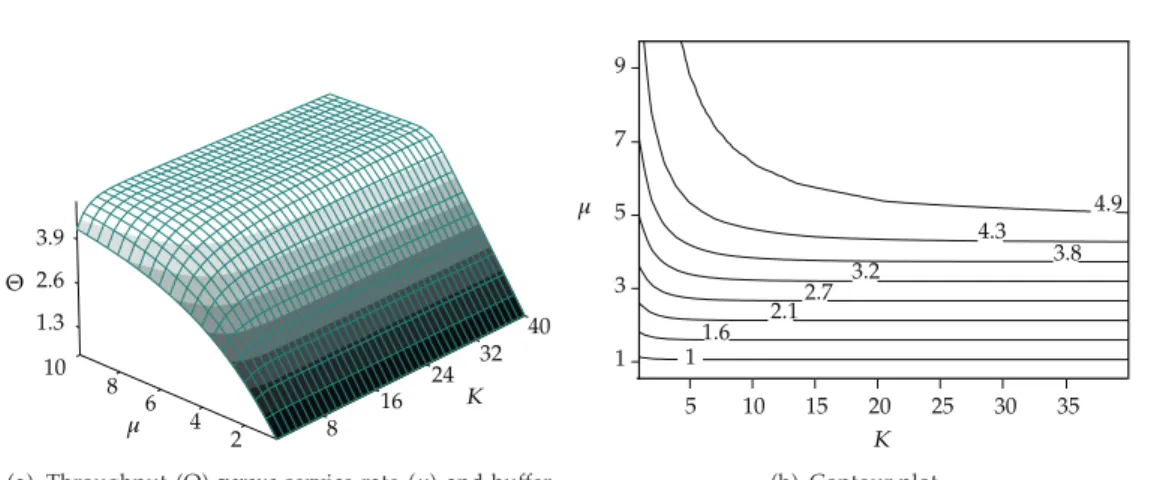
Figure 2 shows the throughput, Θ, for a single M/G/1/K queue with s2 1.5 squared coefficient of variation of the service timeandΛ 5 users per time unitexternal arrival rate, as a function of several values for buffer size,K, and service rate,µsee2.1and
2.2, as well as the respective contour plot. Similar throughput behavior is also observed in a network of queues. The surface of the plot shown in Figure 2is smooth, and convexity is apparent, which is similar to the results of simple queueing networks 22,23. However, the top of the surface plot near the maximum throughput is flat, which creates difficulties for traditional optimization methods. For instance, Smith and Cruz 20 used the Powell method and multiple starts to avoid premature convergence to a local optimum and to derive a successful optimization algorithm.
Θ
1.3 2.6 3.9
10 8
6 4
2 8 16
24 32 40
μ
K
a ThroughputΘversusservice rateµand buffer sizeK
μ
1 3 5 7 9
5 10 15 20 25 30 35 1
1.6 2.1 2.7 3.2
3.8 4.3
4.9
K
b Contour plot
Figure 2:Results of a singleM/G/1/Kqueue forΛ 5.0.
rates, is maximized. By defining a queueing network as a digraph ofGN, A, whereNis a finite set of nodes, andAis a finite set of arcs, the mixed-integer mathematical programming formula was obtained 24
minimizeFK,µ 1.1
subject to
Ki∈ {1,2, . . .}, ∀i∈N,
µi≥0, ∀i∈N,
1.2
where the decision variables Ki and µi indicate the total capacity of the service and the
service rate for theithM/G/1/K queue, respectively. The objective functions, FK,µ ≡
f1K, f2µ,−f3K,µ, are the total buffer allocation,f1K ∀i∈NKi, the overall service
allocation,f2µ ∀i∈Nµi, and the overall throughput,f3K,µ ΘK,µ.
Throughput is often modeled as a constraint that must be greater than a target minimum, rather than as an objective that must be maximized 20, 25. However, to suc-cessfully solve the problem, throughput constraints must be relaxed. Thus, parameters such as the threshold throughput Θτ must be determined beforehand. However, establishing an appropriate threshold is not a trivial task. Moreover, it is possible that a small decrease in throughput can result in a significant reduction in buffer allocation and costs. The tradeoffbetween throughput and the number of buffers is not apparent in a single-objective formula. Indeed, the weightsωof a single-objective function have a significant effect on both the objectives and parameters, including errorsεon performance measure estimates and threshold throughput Θτ. Thus, weight determination is difficult, and the results of single objective optimization techniques can be arbitrary.
also allows the user to increase one objectivee.g., throughputwhile simultaneously reduc-ing another objectivee.g., buffer and service rate allocation. A multiobjective evolutionary algorithmMOEAwas used in combination with a generalized expansion methodGEM, which is a well-known method for obtaining accurate approximations of queueing network performance 27–29. MOEAs are particularly suitable for multiobjective problems and have been shown to perform well in similar multiobjective problems of networkse.g., see Carrano et al. 30and references therein.
In this paper, a MOEA, specifically developed to multiobjective optimization, is presented see Section 2. Additionally, the GEM, a performance evaluation tool used to approximate throughput, is also presented. InSection 3, the results of a comprehensive set of computational experiments are presented to show the efficiency of the approach. Finally, the article is concluded inSection 4, where final remarks and suggestions for future research are discussed.
2. Proposed Algorithms
The exposition of proposed algorithms was conducted in two parts. First, the performance evaluation algorithm was presented, which allowed the overall performance of the system to be estimated in terms of overall throughput,ΘK,µ, for a given configuration of the buffer and service allocation. Then the proposed optimization algorithm was developed, which was applied to obtain the optimal buffer and service allocation.
2.1. Performance Evaluation Algorithm
2.1.1. Single Queues
To maximize the throughput,ΘK,µmust be estimated. In a singleM/G/1/Kqueue, the estimation ofΘK,µcan be achieved with a computationally efficient and accurate closed-form approximate expression of the blocking probability,pK. The method proposed by Smith
31, which is based on a two-moment approximation from Kimura 32, was employed
pK
ρ2√ρs2−√ρ2K−1/2√ρs2−√ρ
ρ−1 ρ22√ρs2−√ρK−1/2√ρs2−√ρ
−1 , 2.1
whereρ <1 is the system utilization, which is the ratio between the total arrival rate and the service rate,ρ λ/µ.s2 is the squared coefficient of variation of the service time,T
s; thus,
s2 VarT
s/ETs2. The results indicated that the approximation ofpKwas accurate for a
wide range of values 20,25,33.
In order to obtain the throughput in a finiteM/G/1/Ksingle queue, we need to adjust the arrival rate. In fact a fractionpKof the arrivals cannot join the system because they have
come when there is no waiting space left. Thus the actual rate of arrivals to join the system must be adjusted accordingly. Since Poisson arrivals see time averagesthe PASTA property, it follows that the effective arrival rate seen by the servers isλeff λ1−pK 34. Thus, the
throughput may be given by
θλeff λ1−pK
2.1.2. Network of Queues
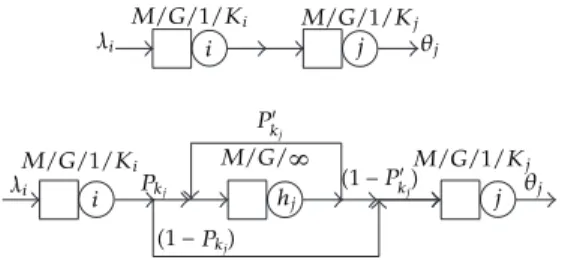
For a network of queues, the estimation of throughput is considerably more complicated. The generalized expansion methodGEMis an algorithm that has been successfully used to estimate the performance of arbitrarily configured, finite queueing, and acyclic networks 29. The GEM is a combination of node-by-node decomposition and repeated trials, where each queue is analyzed separately, and corrections are made to account for interrelated effects between network queues. The GEM uses type I blocking, where the upstream node becomes blocked if the service for an individual customer is complete and the queue at the downstream node is full. This is often referred to as “blocking after service,” which is prevalent in most production, manufacturing, and transportation systems.
With the help of Figure 3, we now describe the GEM. Firstly, we remark that the exponential distribution is a good approximation for the interdeparture times of entities leaving anM/G/1/Knode. In fact, it is possible to show the quasireversibility of a broader class of finite queues, which are the state-dependentM/G/C/Cqueues 35. When those entities that are lost are included, the output stream is Poisson. This assumption is supported by several empirical results 7,8,13,20,25,36. The following three stages are involved in the GEM:network reconfiguration,parameter estimation, andfeedback elimination.
Network Reconfiguration
This stage involves reconfiguring the network. An auxiliary vertex hj is created, which is
modeled as anM/G/∞queue with service rateµh and precedes each finite queuej. When
an entity leavesi, vertexjmay be blocked with probabilitypKjor unblocked with probability
1−pKj. Under blocking, the entities are rerouted to vertex hj for a delay while node j is
busy. After this delay, the entity may be blocked again with probability p′
Kj, for a second
delay period. Vertexhj accumulates the time an entity has to wait before entering vertex j
and the effective arrival rate to vertexj.
Parameter Estimation
In this stage, the parameters pK, p′K, and µh are estimated for clarity, we will omit the
subscript for nodej.
1pK is obtained by means of a two-moment approximation recently developed by
Smith 31
pK equation2.1. 2.3
2pK′ is obtained with the following approximation from diffusion techniques given by Labetoulle and Pujolle 37:
p′K
µjµh
µh −
λrK
2 −r1K
−rK−1 2 −r1K−1
µhr2K1−r1K1
−rK
2 −r1K
−1
λi
λi
i
i
j
j M/G/1/Ki
M/G/1/Ki
M/G/1/Kj
M/G/1/Kj
θj
θj
(1− )
(1− )
M/G/∞
hj
Pkj
Pkj P
′ kj P′
kj
Figure 3:Generalized expansion method.
wherer1andr2are the roots to the polynomial
λ−λµhµjxµhx20, 2.5
withλ λj−λh1−p′K,λh is the actual arrival rate to the artificial holding node,
andλjis the actual arrival rate to the finite nodej, given by
λjλi1−pKλi−λh. 2.6
3µhis calculated as follows using renewal theory:
µh
2µj
1σ2
jµ2j
, 2.7
whereσ2
j is the service time variance.
Feedback Elimination
The repeated visits to the holding nodesdue to the feedback create strong dependence in the arrival process. Therefore, the repeated immediate feedback is eliminated. This is accomplished by giving the customer enough service time during the first passage through the holding node. The adapted service rate for the holding nodeµ′hthen becomes
µh′ 1−pK′ µh. 2.8
Summary 1. The goal of GEM is to provide an approximation scheme to update the
service rates of upstream nodes that take into account all blocking after service caused by downstream nodes
µ−i1µ−i1pKµ′h −1
. 2.9
λi. Solving these equations simultaneously, we can compute all the performance measures of
the network
λλj−λh1−p′K
, 2.10
λjλi1−pK, 2.11
λj λi−λh, 2.12
p′K
µjµh
µh −
λrK
2 −r1K
−rK−1 2 −r1K−1
µhr2K1−r1K1
−rK
2 −r1K
−1
, 2.13
zλ2µh2−4λµh, 2.14
r1
λ2µh−z1/2
2µh
, 2.15
r2
λ2µhz1/2
2µh
, 2.16
pK equation 2.1. 2.17
Equation2.10through2.13is related to the arrivals and feedback in the holding node. Equation 2.14 through 2.16 is used to solve 2.13 with z used as a dummy parameter for simplicity. Lastly,2.1gives the blocking probability for theM/G/1/Kqueue. Thus, we essentially have five equations to solve2.10–2.13and2.1.
2.2. Optimization Algorithm
For the network under consideration, MOEAs appeared to be a suitable choice for the multiobjective maximization of throughput. MOEAs are optimization algorithms that perform an approximate global search based on information obtained from the evaluation of several points in the search space 38,39. The population of points that converge to an optimal value are obtained through the application of genetic operators such asmutation,
crossover, selection, and elitism. Each one of these operators characterizes an instance of a
MOEA and can be implemented in several different ways. Additionally, MOEA convergence is guaranteed by assigning a value of fitness to each population member and preserving diversity. In fact, recent successful applications of GAs for single-objective applications were reported by Lin 40 and Calvete et al. 41, whereas Carrano et al. 30 employed GAs for multiple-objective applications. Additionally, the efficiency of GAs is well established for multiobjective problems 42,43. Many references are provided by the aforementioned authors.
algorithm
read graph, arrival, service rates,GN, A,Λi∀i∈N P1← GenerateInitialPopulationpopSize fori1untilnumGendo
/∗generate offspring by crossover and mutation∗/
Qi←MakeNewPopPi /∗combine parent and offspring∗/
Ri←Pi∪Qi
/∗find nondominated frontsF F1,F2, . . .∗/ F ←FastNonDominatedSortRi /∗find new population by∗/
/∗the crowding-distance-assignment∗/
Pi1←GenerateNewPopulationRi end for
PnumGen1← ExtractParetoSetPnumGen
writePnumGen1 end algorithm
Algorithm 1:Elitist multiobjective genetic algorithmNSGA-II.
I
II
III
IV V
VI
f2
f1
Figure 4:Dominatedand nondominated•points.
xj xj1, xj2, . . . , xjnifxiis superior toxj in one objectivefkxi< fkxj, for minimization
and is not inferior in any other objectivefℓxi>f/ ℓxj, for minimization.
For instance,Figure 4displays the points for a two-dimension minimization problem. In the figure, point V is dominated by point I, but not by points II, III, and IV. Point VI is dominated by points I, II, and III, but not by point IV. The best front includes points I through IV and is an approximation for the Pareto set, which is the set of points that are superior to other points. To perform elitism, an algorithm commonly referred to as the fast nondominated sorting algorithm was employeddetails may be found in Deb et al. 44. This algorithm separates the individuals in the population into several layers or fronts Fi, such that the
solutions inF1are nondominated, and every solution in a given frontFi,i >1, is dominated
by at least one solution inFi−1, and not by any solution inFj,j ≥i. This can be achieved in
Onlogntime 44.
Selection is performed by sequentially selecting points from each nondominated front
F1,F2, . . .until the number of required individuals for the next iteration is obtained. Criteria
Cuboid
i i−1
i+1 f2
f1
Figure 5:Illustration of the crowding distance.
And And
Parent 1 Parent 2 Child 1 Child 2 x1,(2,t)
x1,(1,t)
x2,(1,t) x2,(2,t)
x1,(1,t+1)
x2,(1,t+1)
x1,(2,t+1)
x2,(2,t+1)
. . .
. . .
. . .
. . .
xn,(1,t) xn,(2,t) xn,(1,t+1) xn,(2,t+1)
Figure 6:Chromosome representation and simulated binary crossoverSBX.
of individuals is exceeded. The algorithm computes a measure of diversitythe crowding distance, as defined by Deb et al. 44to ensure the highest possible diversity. Thus, only the points with the largest crowding distance are kept for future iterations, as shown inFigure 5.
Crossover and mutation are somewhat independent of the multiobjective nature of
the problem but are highly dependent on the application. For the problem at hand, a crossover mechanism known as “uniform” was selected 45. Uniform crossover is popular in multivariable encodings due to its efficiency in identifying, inheriting, and protecting common genes, as well as recombining noncommon genes 46, 47. In this mechanism, crossovers were performed for each variable with a probabilityrateCrothat is in accord-ance with the crossover operator. The crossover operator used in the algorithm was the simulated binary crossover operator SBX 48,49, as illustrated in Figure 6. SBX is quite convenient for real-coded GAs because it is able to simulate binary crossover operators but avoids reencoding the variables. The children xi,·,t1 were calculated from the parents xi,·,taccording to the following equation:
xi,1,t1 0.51βxi,1,t1−βxi,2,t ,
xi,2,t1 0.51−βxi,1,t1βxi,2,t ,
0 2 4 6 8
0 0.5 1 1.5 2
η=4 η=8 η=16
f
(
β
)
β
Figure 7:Probability density function ofβ.
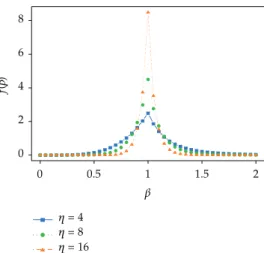
whereβis a random variable obtained from the following probability distribution function:
fβ ⎧ ⎪ ⎨ ⎪ ⎩
0.5η1βη, if β≤1,
0.5η1 1
βη2, otherwise.
2.19
The function was designed to create a child solution that possesses a similar search power to a single-point crossover of binary-coded GAs 48. By adjustingη, several different weightsβcan be generated to produce children that are similar to their parentsi.e., large ηor notsmallη. Several distributions are shown inFigure 7.
For each individual gene the decision variables Ki and µi, the mutation scheme
occurs with a specific probability rateMut. As suggested by Deb and Agrawal 48, Gaussian perturbations were added to the decision variables,Kiεi and µiεNi, for all
i∈N, withεi∼ N0,1,i∈ {1,2, . . . ,2N}.
After crossover and mutation, constraints1.2 may no longer apply. To guarantee feasibility, the values of integer variables were rounded accordingly and were readjusted by applying reflection operators
Krfli 1|Ki−1|,
µrfli µlowlimi
µi−µlowlimi ,
2.20
where 1 is the lower limit of buffer allocation,µlowlimi is the lower limit of service allocation
to ensure that ρ < 1 is applicable,Ki andµi are the resulting values after crossover and
mutation, andKrfli and µrfli are the results after reflection. The proposed scheme generates
feasible solutions without avoiding or favoring any particular solution.
Recently, the stopping criterion of multiobjective optimization evolutionary algo-rithms has been analyzed in detail see, e.g., Rudenko and Schoenauer 50 and Mart´ı
not be ideal because computational time is wasted when many iterations do not lead to a significant improvement. Thus, Rudenko and Schoenauer 50suggested that a superior stopping criterion is obtained when a fixed number of iterations are performed without improvement. To demonstrate the complexity of the issue, Rudenko and Schoenauer 50
conducted a comprehensive set of computational experiments. Their results revealed that an obvious stopping criterion, such as the entire population possessing a rank of 1, did not indicate that evolution should be terminated. The authors proposed a local stopping criterion that computes a measure of the stability of nondominated solutions after each iteration. Another global stopping criterion was recently proposed by Mart´ıet al. 51. This sophisticated method views population evolution as a dynamic system, where the state of the system can be estimated by a Kalman filter. For the sake of simplicity, the criterion of Rudenko and Schoenauer 50was employed in this study. This criterion is based on the stabilization of the maximal crowding distance,dl, measured overLgenerations, and is calculated by the
following standard deviation:
σL
1
L
L
l1
dl−dL 2
. 2.21
As shown in 2.21, dL is the average of dl over L generations. Moreover, 2.21
indicates that the MOEA stops when σL < δlim. Rudenko and Schoenauer 50suggested
that σL does not depend on the actual values of the objective function because crowding
distances are normalized. Furthermore, they also suggested thatLandδlim should be set to
40 and 0.02, respectively, which leads to a stopping criteria that isσ40 ≤ 0.02. According to
empirical evidence, these values are compatible with the network under consideration.
3. Computational Results and Discussion
To use previous implementations of GEM based on the International Mathematics and Statistics LibraryIMSL, the optimization algorithm was implemented in Fortran 31,33. The code is available from the corresponding author upon request and must be used for educational and research purposes only. The computational experiments were conducted to discover the suboptimal set of parameters that guarantee rapid convergence. Moreover, the analysis of a large and complex network of finite queues was also achieved with the proposed algorithm.
3.1. Setting the Parameters
λ
1 2 3
x x x
aA three-node series topology
λ 1
2 3
4 5
x x x
x x
b A five-node series topology
· · · λ
1 2 3
4 10
x x
x
x x
cA ten-node series topology
Figure 8:Tested topologies.
0 0.02 0.06
0 1000 2000 3000 4000 Generation
0.1
Pure crossover Pure mutation(2%)
Combination σL
a 3-node series network
Pure crossover Pure mutation(2%)
Combination
0 1000 2000 3000 4000 Generation
0 0.02 0.06
0.04 0.08
σL
b 10-node series network
Figure 9:Effect of crossover and mutation.
In this study, each factor was analyzed independently; specifically, each factor was varied one at a time while the other parameters were held constant. Montgomery 52
reminds us that the major disadvantage of an independent analysis is that it fails to account for interactions between variables. However, recent experiments reported by Cruz et al. 53
indicated that potential interactions were insignificant; thus, interactions between factors were neglected in this study.
Figure 9presents the convergence speedin terms ofσLas a function of the number
of generations. It is possible to conclude thatpuremutation could be used to determine the optimal solution sometimes pure mutation solves the problem, see Mathieu et al. 54. However, the SBX operator was also utilized because it removed irregularities from the con-vergence profile. The combination of pure mutation and SBX provided satisfactory results, regardless of the number of queues in the network.
The results inFigure 10revealed that the population sizepopSizehad a significant effect on algorithm convergence. However, the population size cannot be arbitrarily increased because the required computational effort would become prohibitive. Moreover, the perfor-mance of the algorithm was not affected by an increase in the number of network nodes.
0 0.02 0.06
0 1000 2000 3000 4000 Generation
Pop size=100 Pop size=200 Pop size=400 0.1
σL
a3-node series network
0 1000 2000 3000 4000 Generation
0 0.02 0.06
0.04 0.08
Pop size=100 Pop size=200 Pop size=400 σL
b10-node series network
Figure 10:Effect of population size.
0 1000 2000 3000 4000 Generation
0 0.02 0.04 0.06 0.08 0.1
2% mutation 4% mutation 8% mutation σL
a 3-node series network
0 1000 2000 3000 4000 Generation
0 0.02 0.06
0.04 0.08
2% mutation 4% mutation 8% mutation σL
b 10-node series network
Figure 11:Effect of the mutation rate.
0 1000 2000 3000 4000 Generation
0 0.04 0.08 0.12
η=8 η=16 η=32 σL
a3-node series network
0 1000 2000 3000 4000 Generation
0 0.02 0.06
0.04 0.08
η=8 η=16 η=32 σL
b10-node series network
0 60 120 180 240 300 0 18 36 54 72 90 1 2 3 4 5 6 Θ ∑K ∑X
a Initial population
0 60 120 180 240 300 0 18 36 54 72 90 1 2 3 4 5 6 Θ ∑K ∑X
b After 10 generations
0 18 36 54 72 90 0 60 120 180 240 300 1 2 3 4 5 6 Θ ∑K ∑X
cAfter 100 generations
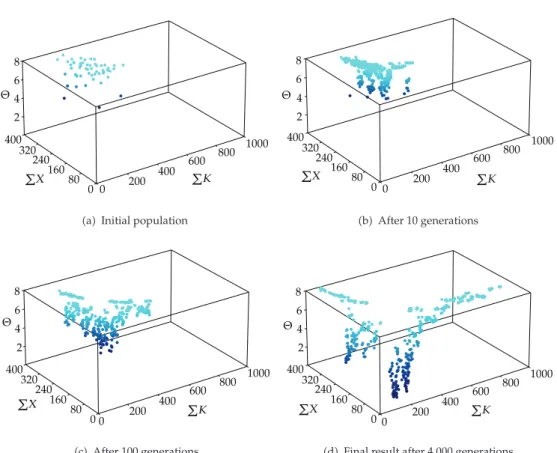
0 60 120 180 240 300 0 18 36 54 72 90 1 2 3 4 5 6 Θ ∑K ∑X
d Final result after 4,000 generations
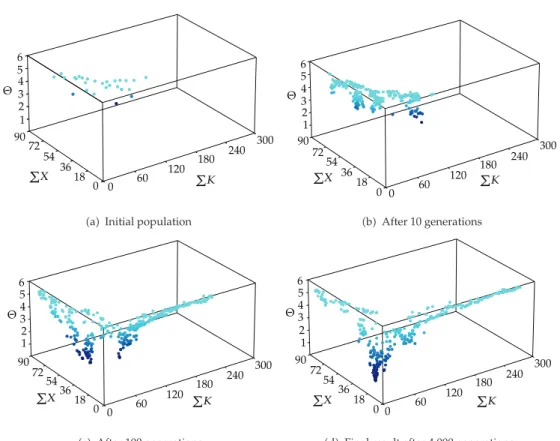
Figure 13:Population evolution of a 3-node network.
Figure 12displays the convergence as a function ofη, which controls the dispersion ofβq in the SBX operator,2.19. A further improvement in the convergence speed was not
observed for values ofηgreater than 8.
Finally, Figures13and14illustrate the population evolution, from the starting point to the final generation. They show the population spreading over time to cover an increasing proportion of objective space.
In summary all of the attempted problems could be successfully solved by employing the following combination: a combined use of mutation and SBX, a population size of 400 individuals, a mutation rate of 2%, and a dispersion parameter η of 8. Moreover, the convergence seemed to be fairly independent of the topologyresults not shown, for split topologies, merge topologies, and so on, the external arrivalΛ, the squared coefficient of
variation of the service time s2, and the number of nodes of the network. Additionally,
to ensure that the computation is complete within a finite amount of time, the maximum number of generationsnumGenmust be predefined. In this study,numGenwas set to 4,000 generations.
3.2. Analysis of a Large Complex Network
2 4 6 8
0 80 160 240 320 400
0 200
400 600
800 1000
Θ
∑K
∑X
aInitial population
0 80 160 240 320 400
2 4 6 8
0 200
400 600
800 1000
Θ
∑K
∑X
bAfter 10 generations
0 80 160 240 320 400
2 4 6 8
0 200
400 600
800 1000
Θ
∑K
∑X
c After 100 generations
0 80 160 240 320 400
2 4 6 8
0 200
400 600
800 1000
Θ
∑K
∑X
dFinal result after 4,000 generations
Figure 14:Population evolution of a 10-node network.
analyzeds2 {0.5,1.0,1.5}at an arrival rate Λ
1of 5.0. First, the convergence speed of
the genetic algorithm was confirmed to be robust for this type of problem. The experimental setup was identical to the previous analysis. However, the results indicated that convergence was stable at 2,000 iterations. Moreover, as shown inFigure 15, the convergence was largely independent of the squared coefficient of variation.
0 1000 2000 3000 4000 0
0.05 0.1 0.15 0.2 0.25
Generation σL
S2=0.5
S2=1
S2=1.5
Figure 15:Convergence of the 16-node network fromFigure 1.
1 2 3 4 5
0 50 100 150 200 250
0 400
800 1200 1600
Θ
∑K
∑X
a Final surface fors20.5
0 50 100 150
0 200 400 600 800 4.6
4.1
4.6
4.1
3.6 2.2
∑K
∑
X
b Contour plot fors20.5
0 400
800 1200 1600
0 50 100 150 200 250
1 2 3 4 5
Θ
∑K
∑X
c Final surface fors21.5
4.5
4.5
4.1
3.6 3.1
2.6 3.1
0 50 100 150
0 200 400 600 800
∑K
∑
X
d Contour plot fors21.5
4. Conclusions and Final Remarks
In this study, a multiobjective approach was developed to maximize the throughput of single server, general queueing networks. By combining the generalized expansion method
GEMwith a multiobjective evolutionary algorithmMOEA, insightful Pareto curves were obtained. These curves display the tradeoffbetween throughput, total buffer allocation, and overall service allocation.
Future investigations should be conducted to determine the applicability of this methodology for the determination of other optimal conditions in finite queueing networks. For instance, this method could be applied to optimize throughput in finite general, multiserver queueing networks or queueing networks with loops. Thus, the method could be used to model systems that lead to a reverse stream of products. Moreover, future research should be conducted to evaluate the algorithms in real-life situations.
Acknowledgments
The research of Frederico Cruz has been partially funded by CNPq Conselho Nacional de
Desenvolvimento Cient´ıfico e Tecnol´ogico; Grants, 201046/1994-6, 301809/1996-8,
307702/2004-9, 472066/2004-8, 304944/2007-6, 561259/2008-307702/2004-9, 553019/2009-0, 550207/2010-4, 501532/ 2010-2, 303388/2010-2, by CAPESCoordenac¸˜ao de Aperfeic¸oamento de Pessoal de N´ıvel Superior; grant BEX-0522/07-4, and by FAPEMIG Fundac¸˜ao de Amparo `a Pesquisa do Estado de Minas Gerais; Grants, CEX-289/98, CEX-855/98, TEC-875/07, CEX-PPM-00401/ 08, CEX-PPM-00390-10. The Brazilian government funding agencies mentioned above had no role in the study.
References
1 J. Li, E. Enginarlar, and S. M. Meerkov, “Conservation of filtering in manufacturing systems with unreliable machines and finished goods buffers,”Mathematical Problems in Engineering, vol. 2006, Article ID 27328, 12 pages, 2006.
2 A. B. Hu and S. M. Meerkov, “Lean buffering in serial production lines with Bernoullimachines,”
Mathematical Problems in Engineering, vol. 2006, Article ID 17105, 24 pages, 2006.
3 A. M. A. Youssef and H. A. ElMaraghy, “Performance analysis of manufacturing systems composed of modular machines using the universal generating function,”Journal of Manufacturing Systems, vol. 27, no. 2, pp. 55–69, 2008.
4 I. Dimitriou and C. Langaris, “A repairable queueing model with two-phase service, start-up times and retrial customers,”Computers and Operations Research, vol. 37, no. 7, pp. 1181–1190, 2010. 5 F. R. B. Cruz, F. S. Q. Alves, H. C. Yehia, L. A. C. Pedrosa, and L. Kerbache, “Upper bounds on
performance measures of heterogeneousM/M/cqueues,”Mathematical Problems in Engineering, vol. 2011, Article ID 702834, 18 pages, 2011.
6 J. H. Harris and S. G. Powell, “An algorithm for optimal buffer placement in reliable serial lines,”IIE Transactions, vol. 31, no. 4, pp. 287–302, 1999.
7 R. Andriansyah, T. van Woensel, F. R. B. Cruz, and L. Duczmal, “Performance optimization of open zero-buffer multi-server queueing networks,”Computers and Operations Research, vol. 37, no. 8, pp. 1472–1487, 2010.
8 J. M. Smith, F. R. B. Cruz, and T. van Woensel, “Topological network design of general, finite, multi-server queueing networks,”European Journal of Operational Research, vol. 201, no. 2, pp. 427–441, 2010. 9 N. Koizumi, E. Kuno, and T. E. Smith, “Modeling patient flows using a queuing network with
10 A. M. de Bruin, A. C. van Rossum, M. C. Visser, and G. M. Koole, “Modeling the emergency cardiac in-patient flow: an application of queuing theory,”Health Care Management Science, vol. 10, no. 2, pp. 125–137, 2007.
11 C. Osorio and M. Bierlaire, “An analytic finite capacity queueing network model capturing the prop-agation of congestion and blocking,”European Journal of Operational Research, vol. 196, no. 3, pp. 996– 1007, 2009.
12 F. R. B. Cruz, J. M. Smith, and D. C. Queiroz, “Service and capacity allocation inM/G/c/c state-dependent queueing networks,”Computers and Operations Research, vol. 32, no. 6, pp. 1545–1563, 2005. 13 F. R. B. Cruz, T. van Woensel, J. M. Smith, and K. Lieckens, “On the system optimum of traffic assignment inM/G/c/cstate-dependent queueing networks,”European Journal of Operational Research, vol. 201, no. 1, pp. 183–193, 2010.
14 N. U. Ahmed and X. H. Ouyang, “Suboptimal RED feedback control for buffered TCP flow dynamics in computer network,”Mathematical Problems in Engineering, vol. 2007, Article ID 54683, 17 pages, 2007.
15 J. Chen, C. Hu, and Z. Ji, “An improved ARED algorithm for congestion control of network transmission,”Mathematical Problems in Engineering, vol. 2010, Article ID 329035, 14 pages, 2010. 16 L. Tang, H.-S. Xi, J. Zhu, and B.-Q. Yin, “Modeling and optimization of m/g/1 -type queueing
networks: an efficient sensitivity analysis approach,”Mathematical Problems in Engineering, vol. 2010, Article ID 130319, 16 pages, 2010.
17 G. M. Gontijo,, G. S. Atuncar, F. R. B. Cruz, and L. Kerbache, “Performance evaluation and dimen-sioning ofGIX/M/c/Nsystems through kernel estimation,”Mathematical Problems in Engineering, vol. 2011, Article ID 348262, 20 pages, 2011.
18 K. Chaudhuri, A. Kothari, R. Pendavingh, R. Swaminathan, R. Tarjan, and Y. Zhou, “Server allocation algorithms for tiered systems,”Algorithmica, vol. 48, no. 2, pp. 129–146, 2007.
19 D. A. Menasc´e, “QoS issues in web services,”IEEE Internet Computing, vol. 6, no. 6, pp. 72–75, 2002. 20 J. M. Smith and F. R. B. Cruz, “The buffer allocation problem for general finite buffer queueing
networks,”IIE Transactions, vol. 37, no. 4, pp. 343–365, 2005.
21 D. G. Kendall, “Stochastic processes occurring in the theory of queues and their analysis by the method of imbedded Markov chains,”Annals Mathematical Statistics, vol. 24, pp. 338–354, 1953. 22 J. G. Shanthikumar and D. D. Yao, “Optimal server allocation in a systemofmulti-server stations,”
Management Science, vol. 33, no. 9, pp. 1173–1180, 1987.
23 L. E. Meester and J. G. Shanthikumar, “Concavity of the throughput of tandem queueing systems with finite buffer storage space,”Advances in Applied Probability, vol. 22, no. 3, pp. 764–767, 1990. 24 F. R. B. Cruz, “Optimizing the throughput, service rate, and buffer allocation in finite queueing
networks,”Electronic Notes in Discrete Mathematics, vol. 35, pp. 163–168, 2009.
25 F. R. B. Cruz, A. R. Duarte, and T. van Woensel, “Buffer allocation in general single-server queueing networks,”Computers and Operations Research, vol. 35, no. 11, pp. 3581–3598, 2008.
26 V. Chankong and Y. Y. Haimes, Multiobjective Decision Making: Theory and Methodology, Elsevier, Amsterdam, The Netherlands, 1983.
27 L. Kerbachea and J. M. Smith, “The generalized expansion method for open finite queueing net-works,”European Journal of Operational Research, vol. 32, no. 3, pp. 448–461, 1987.
28 L. Kerbache and J. M. Smith, “Asymptotic behavior of the expansion method for open finite queueing networks,”Computers and Operations Research, vol. 15, no. 2, pp. 157–169, 1988.
29 L. Kerbache and J. M. Smith, “Multi-objective routing within large scale facilities using open finite queueing networks,”European Journal of Operational Research, vol. 121, no. 1, pp. 105–123, 2000. 30 E. G. Carrano, L. A. E. Soares, R. H. C. Takahashi, R. R. Saldanha, and O. M. Neto, “Electric
distribution network multiobjective design using a problem-specific genetic algorithm,” IEEE Transactions on Power Delivery, vol. 21, no. 2, pp. 995–1005, 2006.
31 J. M. Smith, “Optimal design and performance modelling of M/G/1/K queueing systems,”
Mathematical and Computer Modelling, vol. 39, no. 9-10, pp. 1049–1081, 2004.
32 T. Kimura, “A transform-free approximation for the finite capacityM/G/squeue,”Operations Research, vol. 44, no. 6, pp. 984–988, 1996.
33 J. M. Smith, “M/G/c/Kblocking probability models and system performance,”Performance Evaluation, vol. 52, no. 4, pp. 237–267, 2003.
34 D. Gross, J. F. Shortle, J. M. Thompson, and C. M. Harris,Fundamentals of Queueing Theory, Wiley-Interscience, New York, NY, USA, 4th edition, 2009.
36 F. R. B. Cruz, P. C. Oliveira, and L. Duczmal, “State-dependent stochastic mobility model in mobile communication networks,”Simulation Modelling Practice and Theory, vol. 18, no. 3, pp. 348–365, 2010. 37 J. Labetoulle and G. Pujolle, “Isolation method in a network of queues,”IEEE Transactions on Software
Engineering, vol. 6, no. 4, pp. 373–381, 1980.
38 K. Deb,Multi-Objective Optimisation Using Evolutionary Algorithms, Wiley, 2001.
39 C. A. Coello Coello,Evolutionary Algorithms for Solving Multi-Objective Problems, Kluwer, 2002. 40 F. T. Lin, “Solving the knapsack problem with imprecise weight coefficients using genetic algorithms,”
European Journal of Operational Research, vol. 185, no. 1, pp. 133–145, 2008.
41 H. I. Calvete, C. Gal´e, and P. M. Mateo, “A new approach for solving linear bilevel problems using
genetic algorithms,”European Journal of Operational Research, vol. 188, no. 1, pp. 14–28, 2008.
42 C. A. Coello Coello, “An updated survey of GA-based multiobjective optimization techniques,” in
Proceedings of the ACM Computing Surveys, vol. 32, pp. 109–143, 2000.
43 C. M. Fonseca and P. Fleming, “An overview of evolutionary algorithms in multiobjective optimization,”Evolutionary Computing, vol. 3, no. 1, pp. 1–16, 1995.
44 K. Deb, A. Pratap, S. Agarwal, and T. Meyarivan, “A fast and elitist multiobjective genetic algorithm: NSGA-II,”IEEE Transactions on Evolutionary Computation, vol. 6, no. 2, pp. 182–197, 2002.
45 T. B¨ack, D. Fogel, and Z. Michalewicz,Handbook of Evolutionary Computation, Institute of Physics Publishing and Oxford University Press, 1997.
46 X. B. Hu and E. Di Paolo, “An efficient Genetic Algorithm with uniform crossover for the multi-objective airport gate assignment problem,” in Proceedings of the IEEE Congress on Evolutionary Computation (CEC ’07), pp. 55–62, Singapore, September 2007.
47 G. Sywerda, “Uniformcrossover in genetic algorithms,” inProceedings of the 3rd International Conference on Genetic Algorithms, pp. 2–9, Morgan Kaufmann Publishers, San Francisco, Calif, USA, 1989. 48 K. Deb and R. B. Agrawal, “Simulated binary crossover for continuous search space,” Complex
Systems, vol. 9, pp. 115–148, 1995.
49 K. Deb and H.-G. Beyer, “Self-adaptive genetic algorithms with simulated binary crossover,” Tech. Rep. CI-61/99, Department of Computer Science/XI, University of Dortmund, Dortmund, Germany, 1999.
50 O. Rudenko and M. Schoenauer, “A steady performance stopping criterion for Pareto-based ev-olutionary algorithms,” inProceedings of the 6th International Multi-Objective Programming and Goal Programming Conference, Hammamet, Tunisia, 2004.
51 L. Mart´ı, J. Garc´ıa, A. Berlanga, and J. M. Molina, “A cumulative evidential stopping criterion for multiobjective optimization evolutionary algorithms,” inProceedings of the 9th Annual Conference on Genetic and Evolutionary Computation (GECCO ’07), pp. 2835–2842, ACM, New York, NY, USA, 2007. 52 D. C. Montgomery,Design and Analysis of Experiments, John Wiley & Sons, New York, NY, USA, 6th
edition, 2004.
53 F. R. B. Cruz, T. van Woensel, and J. M. Smith, “Buffer and throughput trade-offs inM/G/1/Kqueueing networks: a bi-criteria approach,”International Journal of Production Economics, vol. 125, no. 2, pp. 224– 234, 2010.