A Work Project, presented as part of the requirements for the Award of a Master Degree in Economics
from the NOVA – School of Business and Economics
THE EFFECT OF CROSS-NATIONALITY EXPOSURE ON
COMPETITIVE TOURNAMENT ENTRY AND
OVERCONFIDENCE
A Laboratory Experiment
Robin Bohn, 3123
A Project carried out on the Master in Economics Program, under the supervision of:
Professor Alexander Coutts
Abstract
Overconfidence is a persistent bias that entails less-than-optimal decision making. Reducing
overconfidence is of high interest to increase efficiency. Conducting a laboratory experiment at
Nova SBE, this research proposes a novel information-based treatment on over-entry in a
com-petitive setting. Participants receive information on their competitor ahead of decision making,
including nationality. It is hypothesized that this information raises participants awareness of cross-nationality exposure as in- and out-groups which alters decision making. Findings are
suggestive that treatment exposure reduces over-entry within the laboratory experiment. This
outcome advocates that promoting multicultural environments could be beneficial to improve
efficient decision making.
Keywords: Laboratory experiment, overconfidence, tournament entry
1
Introduction
De Bondt and Thaler (1995) state that “perhaps the most robust finding in the psychology of
judgment is that people are overconfident”(p. 389).
The existence of overconfidence has been an established finding in behavioural economics
as well as psychology literature in past decades and been observed in a variety of topics.
Sven-son’s (1981) seminal study on self-perception of one’s driving skills pioneered the range of
research pertaining to this topic, exhibiting people’s tendencies towards overconfidence.
Over-confidence, in general, has been linked to a wide range of issues from labour strikes (Neale and
Bazerman, 1985) to war (Johnson, 2009).
The existence and importance of overconfidence have also been discussed within the field
of economics. Overconfidence has been suggested as an explanation to excessive trading and
subsequent monetary losses (Odean, 1998), to over-entry into markets (Camerer and Lovallo,
1999), and to an excess number of corporate mergers (Malmendier and Tate, 2005). These
show that overconfidence can entail losses in efficiency. To increase efficiency and improve
in their choices. Conducting an experiment following Niederle and Vesterlund (2007) this
the-sis investigates the effect of cross-nationality exposure on overconfident tournament entry in a
competitive tournament setting.
Conducting a laboratory experiment at Nova SBE, a novel information-based treatment was
developed to study how competing against an individual from another nationality alters entry
choices compared to competing against a compatriot. This thesis shows that results are
sug-gestive that cross-nationality exposure lowers excess entry, reduces expressed overconfidence
and could contribute to more optimal decision making. These findings support the argument
that multicultural teams can bring along more efficient decision making and are thus of high
potential interest to businesses, corporations, and public bodies.
This thesis is structured the following way: First, a literature review introduces the con-text of this research within the literature and how it can add insight. Second, the experimental
approach is introduced including the participant pool, the experimental mechanism, how the
treatment was introduced, payment, matching, and belief elicitation. Third, ex-ante predictions
of tournament entry of rational decision makers and the observed, actual behaviour of
partic-ipants are discussed. A discussion on descriptive performance and belief measures follows.
Fourth, a probit model of tournament entry is introduced using established predictors which
are, fifth, expanded to assess the impact the suggested treatment has on tournament entry. The treatment is analysed under different specifications within the experimental setting. It is shown
that results are suggestive that cross-nationality exposure reduces tournament entry and could
be a valid mean to lower overconfident over-entry.
2
Literature review
The notion of overconfidence originally stems from psychology. The issue was introduced by
Svenson (1981) with the famous remark that 90% of drivers consider themselves above average.
Overconfidence has been studied outside psychology as well, three examples include: percep-tion of performances (Clayson and Healy, 2005), expectapercep-tions of the speed at which tasks can
be completed (Buehler, Griffin, and Ross, 1994), and people’s inability to judge frequencies
highly significant bias in decision making (Plous, 1993) and is nowadays a standard part of
behavioural finance textbooks (See, e.g., Barberis and Thaler, 2003). In economics,
overconfi-dence has been linked to a wide range of phenomena such as speculative bubbles (Scheinkman and Xiong, 2003) and compensation schemes of CEOs (Gervais, Heaton, and Odeon, 2011).
Moore and Healy (2008) provide an extensive overview of the areas in Economics to which the
notion of overconfidence has been applied.
Usually, overconfidence is understood as a negative that leads to less efficient decision
out-comes. Malmendier and Tate (2005) use CEO overconfidence to explain an excess of mergers
and show that those with overconfident CEOs are more penalised by the market. Camerer and
Lovallo (1999) show that overconfidence leads to excess entry into competitive markets in
lab-oratory experiments, reducing profits or even incurring losses.
Odean (1998) links overconfidence to excessive trading and subsequent monetary losses of
traders. Barber and Odean (2001) put a number on this and compute that overconfidence in
male investors costs them more than 2.5% in yearly average returns. All this research suggests
that reducing overconfidence is clearly desirable to increase efficiency in entry, mergers, and
trading.
This thesis relies on recent experimental literature which investigates on the importance
of group composition, such as Charness, Luca, and Rustichini (2007), Chen and Li (2009), and Charness and Rustichini (2011), who have found that group composition and opponents
characteristic can alter both an individual’s decision making and preferences, which can also
influence overconfidence.
Expanding on findings of Healy and Pate (2011), that exposure to another person as a team
member within a competitive, individual decision can reduce overconfidence, the experiment
will expose participants to another person as a competitor in a competitive, individual decision
to assess whether such direct, competitive, exposure can also reduce overconfidence. Arkes et al. (1987) also show that exposure to people reduces overconfidence. Research on the
impor-tance of group composition for decision making has been recent and is still developing, leaving
room for a further understanding of how group characteristics influence decisions.
genders in a strictly patriarchal society and a matrilineal one. They find that while a gender gap
in overconfidence exists in both societies, the gender exhibiting it differs across cultures. Their
findings doubted the idea of mere biological determinants of overconfidence (as expressed in Niederle and Vesterlund (2007)) and gave rise to the question of the importance of cultural
background and its influence on the behaviour of individuals respective of group membership.
The treatment suggested builds on the idea that overconfidence can differ across groups and
culture, proxied by nationality.
Based on previous research showing that culture and an individual’s characteristic matter for
preferences and decision making, especially for in- and out-group behaviour, it seems plausible
to expect differences in competitive behaviour by nationality as a group characteristic. This
the-sis will investigate the following research question: Does exposure to another nationality reduce overconfident over-entry in a competitive tournament environment? To assess overconfidence,
this thesis will adapt an experiment proposed by Niederle and Vesterlund (2007) and expand it
to a setting of out-group exposure and nationality which, to the author’s best knowledge, has
never been studied before.
3
Methodology – A laboratory experiment
To assess the impact of competition across nationality as out-group competition, a laboratory
experiment was designed, planned and conducted at Nova SBE. The pairing of subjects into competitive groups of two is regarded as the treatment, depending on the matching.
Partici-pants who were matched with a competitor from a different nationality are considered to have
received the treatment, whereas participants who competed against someone from their own
country serve as control group for the effect of cross-nationality exposure. The experiment is
an alteration of an experiment conducted in Niederle and Vesterlund (2007). Participants
con-ducted a real effort task by adding a series of two-digit numbers. This task has familiarity,
comparable to everyday tasks such as adding prices during grocery shopping. It cannot be said that the task is too difficult or unfamiliar which has been found to influence overconfidence
(see Moore and Healy, (2008)). Nevertheless, it takes some mental effort to add the numbers
allocated. The experiment was conducted in a pen-and-paper style, and all sheets were handed
out and collected individually, resulting in around 900 pages of material.
3.1
Participants
Three experimental sessions of about one hour each were conducted at Nova SBE with a total
of 71 students participating in the experiment, 47.9% of which were female. Students were
re-cruited through a public invitation to the experiment on the social media platform “Facebook”.
For each Masters programme, an individual group exists on this platform within which the
invi-tation was published. Therefore, every Master student at Nova SBE was targeted to participate.
Table 1 below reports the distribution of participants by age, gender, and nationality. Partici-pants’ age was between 20 and 26, except for one outlier at 35 years of age, with a median age
of 22.8 years. Excluding the one outlier, normality in the age distribution failed to be rejected at
10%. Out of all participating students, only one pursued a Bachelor’s degree whereas all others
pursued a Master’s degree. Due to the nature of the undertaking, a large number of participants
pursued a degree in Economics, representing about 50% of participants. The distribution of
nationalities is wide, with a peak in Portuguese and German participation. Close to 50% of
participants were Portuguese, 25% German and 8.5% Italian with the rest diversely distributed.
Table 1
Age Total AT BE BR CA DK DE GW IT NO PL PT CH TN US
Female 34 1 1 5 5 3 1 18
20-22 16 1 3 1 11
23-25 18 1 5 2 3 7
Male 37 1 1 1 1 12 1 1 16 1 1 1
20-22 14 1 1 11 1
23-25 21 1 1 1 1 10 5 1 1
26+ 2 1 1
Total 71 2 1 1 1 1 17 1 6 3 1 34 1 1 1
Note: AT= Austria, BE=Belgium, BR=Brazil, CA=Canada, DK= Denmark, DE=Germany, GW=Guinea-Bissau, IT=Italy, NO=Norway, PT=Portugal, CH=Switzerland, TN=Tunisia, US=United States
3.2
Experimental design
Participants were asked to add five two-digit numbers and could add as many out of 30 additions
numbers they must add. This procedure was performed four times whereas three of these four
rounds differed by payment scheme. In round 1 and 2, payment schemes were given whereas
round 3a) and 3b) allowed participants to choose the payment scheme. The payment schemes will be discussed in detail in section 3.4.
Round 1 and 2 are for controls on participants behaviour, whereas round 3a) and 3b) evaluate
the treatment. In round 1, participants did not compete against one another. For round 2 – 3b),
subjects were randomly allocated into groups of two in which they competed in a 1v1 fashion.
Rounds 3a) and 3b) are repetitions of one another, as the task faced by participants remained
the same and the repetition was done to permit multiple matches with different nationalities.
A difference in matching existed between 3a) and 3b) due to the limitations the experimenter
faced regarding the scope of the experiment and the number of participants, which are discussed in section 3.6.
3.3
Payment
Students received chocolate as a show-up fee and were rewarded with Experimental Currency
Units (ECUs) depending on their performances. ECUs worked as lottery tickets. Each ECU
was a ticket that could be drawn. The pool of the lottery was the sum of all ECUs earned by all
participants. The chance of winning money from the lottery was strictly increasing in one’s own
ECUs. In total, 100ewere allocated to tranches of 5 times 20ewhich were then raffled among
ECUs. The experimenter made participants aware of how this payment scheme functions and
asked whether they understood it before the experiment. Students were told that one out of four
rounds would be randomly chosen for payment. Expected payoffs for students are:
E(X) = ΣECUindividual
ΣECUall participants
∗100e (1)
3.4
The rounds
Round 1 was performed under a flat-wage scheme. Participants received a sheet with two-digit
number additions which contained brief instructions and had 5 minutes to perform the additions
sheet with additions to perform. They had 5 minutes to perform the additions task. Round 2
was performed under a tournament scheme. Students were randomly matched with one other
player. The participant amongst the two with the highest number of correctly solved additions received 2 ECU per correctly solved addition, the other none (in case of ties the winner was
chosen randomly). Participants were forced to perform under a competitive tournament scheme
and had no information against whom they performed.
Round 3a) and 3b) were performed alike, but the matching between the two differed.
Stu-dents received a sheet with information about their competitor, as explained in section 3.5.
After receiving this and before performing the round, they had to make a choice on how to be
remunerated in the next round: they could choose a flat wage and be paid as in round 1 or a
tournament scheme and be paid as in round 2. Choosing the tournament scheme was considered as entry into the tournament, whereas the flat wage was considered as the choice to not enter
the tournament. After this choice was made, the corresponding sheets were collected and only
then was the task distributed to students so that they could not alter their choice ex-post.
As suggested by Niederle and Vesterlund (2007), in rounds 3a) and 3b) participants did not
perform against their competitor’s performance in the same round, but against their competitor’s
performance in round 2, to exclude the possibility that participants make their choice partly on
the belief whether the competitor enters. Round 2 has already been played, beliefs about the behaviour of others are irrelevant as it is known that Round 2 was played under the tournament
scheme. The same procedure was repeated for round 3b), but participants were rematched.
Table 2
Round
1 2 3
3a) 3b)
Task Number adding Number adding Number adding Number adding
Payment Flat-wage Tournament Choice Choice
Matching
PT Half A
None Random
Random within Random
Half B Random Random within
DE Random within Random
Others Random Random
3.5
Treatment
The treatment occurred through giving students pieces of information on their competitor, thus
creating knowledge on the opponent. Whereas no information was provided to students ahead
of rounds 1 and 2, in round 3a) and 3b) they were silently given information about their com-petitor for the following round (See Appendix, Section 9.3). Participants received a sheet of
paper which stated their competitor’s age, degree level they pursued, favourite colour and
na-tionality. Only the latter was the treatment which is hypothesized to alter participants behaviour.
The former three were given in addition to not elicit participants awareness of the variable of
in-terest. This additional information was chosen as it is considered to not have any economically
meaningful impact on behaviour. This was confirmed in robustness checks ex-post. Regressed
on tournament entry, none of these additional pieces of information was found to have any statistically significant effect. Assessing the effect of giving students information on their
com-petitor’s nationality, making them aware of in-group or out-group competition, on tournament
entry decision and overconfident entry is the principal motivation for this thesis.
3.6
Matching
Participants were matched randomly. However, some restrictions were made to allow for the
proper functioning of the treatment allocation and due to the limitation of the subject pool. In
round 2, students were randomly matched without restrictions. In round 3a) and 3b), students were divided into subgroups. All Portuguese participants were equally divided into two
sub-groups. Participants in one of the subgroups were randomly matched with other Portuguese
par-ticipants, those in the other group were randomly matched with all remaining non-Portuguese
participants. This process was reversed in round 3b). Therefore, a Portuguese who was matched
with a Portuguese in round 3a) was matched with a foreigner in round 3b) and vice versa. This
was to ensure that each Portuguese student would face a Portuguese once as a control. Some of
the 14 nationalities were unique and therefore could not match with anyone from the same
and randomly matched against a non-German in round 3b)1. This potentially induced round-effects which can be controlled for. All other students were randomly matched. In section 6.2.3,
this difference in matching is explored to assess whether it affected the results.
3.7
Beliefs elicitation and other information
After each round, participants were asked how many correct additions they think they solved.
For round 3a) and 3b), this was also asked about their competitor’s performance. If correct,
students would receive an additional ECU. After playing all rounds of the game, participants
were also asked about their guess on the average performance in the tournament2, their belief on their relative rank amongst ten randomly chosen participants and to do a risk-aversion test
based on Holt and Laury (2002).
3.8
Tournament entry: predicted behaviour
Participantihas the choice between a risk-free flat wage scheme that remunerates him/her with
1 ECU per correctly solved additionci or enter a tournament against their matched competitor j. Under the tournament scheme, the participant receives 2 ECU for each correct addition if
he/she “wins” against his/her competitor, that is, makes more correct additions than his/her
competitor and nothing if he/she makes less. In case of a tie, the winner is randomly chosen.
The participant thus faces the issue to choose betweenE(Xf) =1∗ci (flat wage) andE(Xt) = ρ∗2∗ci(tournament scheme) withρthe probability thatci≥cj. That is, receiving 1 per correct
answer with certainty or 2 with the probability of winning.
A risk-neutral individual with perfect expectations would enter the tournament if and only
if his/her expected pay-offs were higher than under the risk-free flat-wage scheme, which is
E(Xt)>E(Xf)or ρ∗2∗ci>1∗ci which only holds ifρ>0.5. Therefore, a risk-neutral
indi-vidual with perfect expectations would only strictly enter the tournament if the probabilities of
winning are at least 50% - or simply more than chance. On average, in a pair of risk-neutral
individuals with perfect expectations, only one participant would join the tournament whereas
1There were not enough German participants to perform the matching the way it was done for the Portuguese
participants, as it requires 4 Germans per session to create two subgroups of two participants each.
the second player maximizes his/her expected payoff by choosing the flat wage. Consequently,
with risk-neutral individuals with perfect expectations one would expect exactly 50% of
par-ticipants to join the tournament in aggregate, and even lower numbers for risk-averse decision makers. The following paragraph shows that this is not the case.
4
Experimental results: behaviour and summary statistics
The following paragraphs describes participants’ behaviour regarding entrance, performance, and beliefs to illustrate how participants performed. Table 3 below provides summary statistics
of tournament entry and performance (number of additions) regarding gender, rounds of the
ex-periment (those with treatment), and nationality, divided into Portuguese, Germans, and Others,
due to the low number of nationalities.
4.1
Tournament entry decision
Regarding entry, data shows that participants do not enter in the fashion predicted above for risk
neutral, rational decision makers in aggregate. 60% of the time, participants choose to compete, effectively forgoing the chance to gain real money through ECUs. This pattern is consistent and
identical over the two repeated rounds, 3a) and 3b) (Mann-Whitney p = 0.731). There can be
several explanations for higher than expected entry.
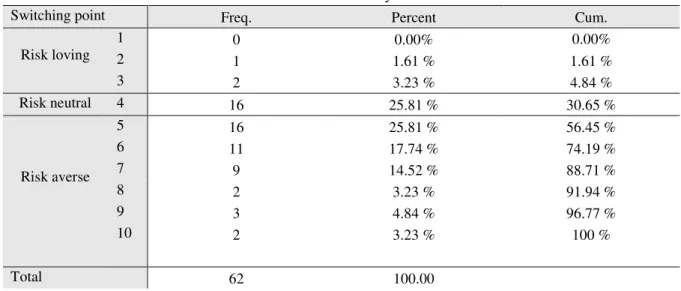
First, participants were not risk-neutral, but instead risk-loving. To control for this, students
performed a Holt-Laury test of risk aversion (Holt and Laury, 2002). Using this measure, only
4.84% of participants exhibited risk-loving behaviour, 25.81% exhibited risk-neutral behaviour,
and the remaining 69.35% exhibited risk-aversion (See Table A-1). One would expect that, if risk aversion played a role, on average, even less than 50% of participants joined. Second,
par-ticipants show what Niederle and Vesterlund (2007) describe astaste for competition. Niederle
and Vesterlund define taste for competition as the error term of their regression analysis on
tournament entry. This explanation cannot be straightforwardly rejected from the experimental
data directly. Instead, if the introduced treatment is valid in contributing to explain over-entry
Niederle and Vesterlund attributed to the residual of their model. Third and most importantly,
data showed that participants exhibited overconfidence. Their perception of the probability of
winning the tournament was incorrect resulting in inefficient over-entry. Observations of entry and reported beliefs strongly suggest that it is overconfidence that drives over-entry.
Table 3
Gender Round Nationality
Male Female Total 3a 3b PT DE Other
p-value* p-value*
Not entered 32% 49%
0.046 40% 39% 41% 0.73 46% 19% 48%
Entered 68% 51% 60% 61% 59% 54% 81% 53%
Performance 11.03 8.60 0.00 10.69 10.20 11.19 0.14 9.29 11.02 9.88
Belief on own
performance 11.97 9.72 0.00 12 11.57 12.42 0.17 10.49 12.33 10.38
*p-value for the null hypothesis that enter and not enter are equal across column values Numbers subject to rounding
4.2
Observations on performance
As predicted by theory on incentives and repeatedly shown in the literature (e.g., Niederle and
Vesterlund, 2007), performance differs with payment scheme. Comparing round 1, played
under a flat wage, to round 2, played under a tournament scheme, participants perform better
under the tournament scheme. Performance also significantly differs from round 1 to when the
choice of enumeration scheme is left to the participants as in round 3a) (p<1%) and 3b) (p<1%).
There is no statistically significant difference between round 2 and 3a) or round 3a) and 3b).
However, performance in round 3b) is different (and better) than in round 2 and the difference is statistically significant at 5%. The average number of correctly solved additions increases with
every round, suggesting that participants perform better with experience and show some effect
of learning (See Figure A-1 in the Appenidx). Contrary to Niederle and Vesterlund (2007), the
author finds a consistent and significant difference in performance between men and women,
both for a flat wage and a tournament payment scheme (See Figure A-2). The difference in
performance across gender was driven by a strongly male-dominated 10th decile, including two
4.3
Beliefs on own performance
Participants were asked incentivized questions about their beliefs on performance. Comparing
this belief to their actual performance allows shedding light on how accurate beliefs are and
the presence of overconfidence in the form of overestimation. Participants were not accurate in guessing their performance correctly with “misses” both up- and downwards, even though the
upward biases were much more present and persistent. Table 4 reports some summary statistics
on belief accuracy, providing further evidence that overconfidence is present in the sample.
Within a band of ±1 around the actual value (a not too small band, given that the average
correct number is 9.8) around half of the participants expressed a belief on their performance
that is inaccurate, with a wide range around it. The average “miss” is 1.03 away from the actual
performance. However, the standard deviation is considerably larger at 2.4 with participants overestimating their performance by up to 14 additions. Using a Wilcoxon signed-rank test,
the null hypothesis that the actual number of correctly solved additions and the belief on the
number of solved additions are equal can be rejected at 1% and show an upward bias, that is,
beliefs are consistently and significantly above the actual value. Participants were not naively
overestimating themselves as in the sense that the number of additions they attempted was equal
to their belief on how many they solved. They acknowledged that they can make mistakes and
the reported belief is significantly (at 1%) below the number of attempted additions. Participants
updated their beliefs downward. However, they did not do this sufficiently.
Table 4
Accuracy of beliefs on own performance Accuracy of beliefs on competitor’s performance
Correct Correct ±1 Δ from true value
Correct Correct ±1 Δ from true value
Share of accurate
beliefs 0.23 0.54 1.03 0.06 0.19 -0.49
SD 0.42 0.50 2.40 0.24 0.40 4.95
Note: Table 4 reports accuracy of participants beliefs on their own performance and on performance of competitors.
Correct reports the share of participants whose belief coincide with the actual value, Correct ±1 reports the share of
5
Tournament entry – model selection
This section prepares the analysis of the treatment effect on tournament entry. To do so, a
probit model to describe tournament entry choices using established factors net of the treatment
variable is discussed first. In section 6, an analysis including the treatment variable is performed.
This way, it is highlighted how the treatment can add value above established tournament entry
factors and whether it influences the degree of overconfidence participants exhibit.
The dependent variable, tournament entry, is binary. It can take only values of either 0 (not enter) or 1 (enter). Using a maximum-likelihood probit estimation, all specification will be
estimated along the lines of the below model:
Pr(Y =1|X) =γ0+βi∗I+βC∗C+θiL (2)
WhereX is the set of all explanatory variablesX ={I,C,L}. I is a set of explanatory
vari-ables that affect tournament entry net of the new treatment which have been discussed in the
literature and can be retrieved from the experimental data. These mostly refer to performance
measures. Their appropriateness for model specification is discussed below. C is the
treat-ment dummy; facing a competitor with a different nationality. L is a set of control variables.
The information given to the participants about their competitors beyond the treatment are not
included in the displayed estimations results for two reasons. First, it was given only to not make participants aware that the opponent’s nationality is the variable of interest and
consid-ered economically meaningless. Second, several model specifications were ran including all of
the additional pieces of information and, as expected, none of them were found to be significant
or meaningful. Models are estimated using clustered standard errors on individuals over both
rounds to account for the fact that every individual played twice and a person’s choice in round
3a) is not independent of that in round 3b).
5.1
Set of control variables
Using a Mann-Whitney test, there were no significant differences on tournament entry over
entry decisions, where entry increased with age. This justifies the usage of age as a control
variable in probit estimation models. The number of observations for each age is not very high
and results comparing age need to be considered with care. Additionally, round fixed-effects are included to control for differences across the pooled round 3a) and 3b). As established in
the literature, there are significant differences in tournament entry across gender. Less than 50%
of women in the sample entered the competition, whereas nearly 70% of men entered
(Mann-Whitney p = 0.046). A female dummy is included to capture potential effects. Lastly, dummy
variables on risk aversion retrieved from a Holt-Laury test on risk aversion are included.
5.2
Independent variables net of treatment
Whether a participant wins in the tournament or not depends crucially on his/her performance in the setting. Therefore, subjects’ decision on entry should be strongly influenced by their
expectations of their future performance. It is crucial to include an approximation of these
expectations to a model of entry decision to which the treatment shall bring additional insight.
However, this internal information is not observable ex-ante. Two variables are tested as an
approximation for the expectations on future performance that influence participants in their
decisions: actual future performance, as suggested in Niederle and Vesterlund (2005), and belief
on past performance.
If participants had perfect expectations, then future performance would be perfectly antic-ipated and entry decision should be perfectly predictable for risk neutral agents based on this
performance which can be observed ex-post. However, one observed inefficient over-entry,
with participants effectively forgoing real monetary reward. This strongly suggests that
partic-ipants did not have perfect expectations when making their entry decision but were
overconfi-dent in their expectations of winning. The 5% of risk-loving participants alone cannot explain
this excess entry. If perfect expectations do not hold, the most relevant information to build
expectations on performance in the upcoming competitions are past experiences, unless partic-ipants expect a sudden and significant increase in performance and thus their ability. During
the experiments, subjects never received feedback on their actual performance. As the actual
is therefore argued that ex-ante, belief on past performance is the most reliable performance
measure to predict entry. Participants’ belief on their performance most closely reflected what
they (inaccurately) assessed as their performance, measured after they performed.
As future performance and reported beliefs on past performance are correlated (Spearman’s
ρ = 0. 6938) they are expected to work similarly well as performance measures of tournament
entry decision. However, it is argued ex-ante that belief on past performance would be the
most accurate measure: past performance was unknown and so was future performance unless
participants had very accurate expectations. Their belief on how they performed before should,
therefore, be closest to how they expected to perform next.
5.2.1 Belief on past performance vs. future performance
Estimating a probit model with the controls mentioned above, the result shows that, as expected,
participants belief is a valid predictor of entrance probability and statistically significant at
5%, with a positive coefficient. All control variables, except a participants age, are highly insignificant. An increase in the belief on past performance has a positive effect on tournament
entry, that is, it increases the probability of entrance.
If participants had perfect expectations then future performance, as perfectly expected,
would be the strongest indicator of entering the tournament scheme, though both the
aggre-gate tournament entry and the inaccuracy of belief speak against perfect expectations. Running
the estimation, indeed, yields similar results compared to past beliefs. Higher future
perfor-mance increases the probability of entering the tournament at 1% significance level. Both belief on past performance and future performance are valid means to capture the impact of
partici-pants’ expectations of their future performance on entry decisions. Both regressors are used in
the model assessing the cross-nationality exposure treatment.
5.2.2 Past entry-decision
Past entry decision can help assess future decisions through two channels. On the one hand,
people could be repetitive in their choices, either through perceiving their past behaviour as a
or degree of overconfidence. On the other hand, individuals could reverse their choices to
“in-sure” themselves against ambiguity and therefore play each option once. A simple model of
tournament entry decision using past entry and the common control variables was estimated in-dicating that choosing tournament in the previous round had a significant positive effect on the
probability of choosing to enter the tournament in the current round. This suggests that
partici-pants rather did not play an insurance pattern, but that entry decisions show some consistency.
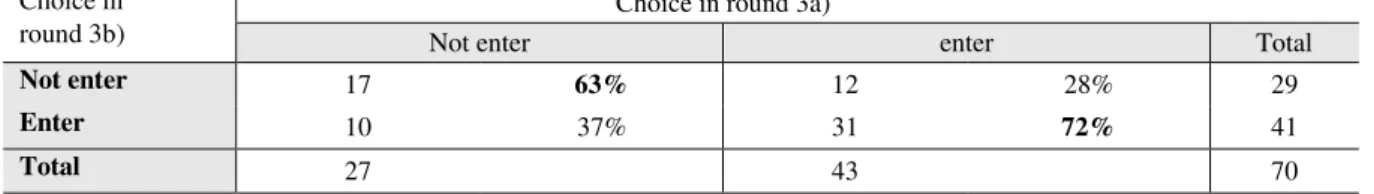
Table 5 below highlights this: 63% of participants who did not enter in round 3a) did not enter
in round 3b), 37% altered their choice. Similarly, 72% of participants who entered in round
3a) did so in round 3b). To capture this degree of consistency, a robustness check using past
entry decision will be included in a specification of the probit model to assess the impact of the
treatment in section 6.2.
Table 5
Choice in round 3b)
Choice in round 3a)
Not enter enter Total
Not enter 17 63% 12 28% 29
Enter 10 37% 31 72% 41
Total 27 43 70
Note: One incomplete observation reduced observations in Round 3a and 3b
6
The effect of cross-nationality exposure treatment on
tour-nament entry and overconfidence
6.1
Main findings
In this section, the impact of the novel treatment of cross-nationality exposure is discussed.
Table 6 below shows tournament entry by treatment groups. It is observable that entry and the
degree of over-entry were higher in the non-treated group than the treated one. Entry in the
treated group was closer to the pay-off maximizing 50%. A probit model is used as discussed
above to assess the effect of the cross-nationality exposure treatment to figure out whether it had a non-trivial impact on tournament entry decision and overconfidence as hypothesized in
Table 6
Cross-nationality treatment
Entry choice Non-treated Treated
Frequency Percentage Frequency Percentage Total
Not enter 19 33% 37 45% 56
Enter 39 67% 45 55% 84
Total 58 82
PT DE OTHER PT DE OTHER
Not enter 14 5 17 1 19
Enter 20 19 17 7 21
Total 34 24 34 8 40
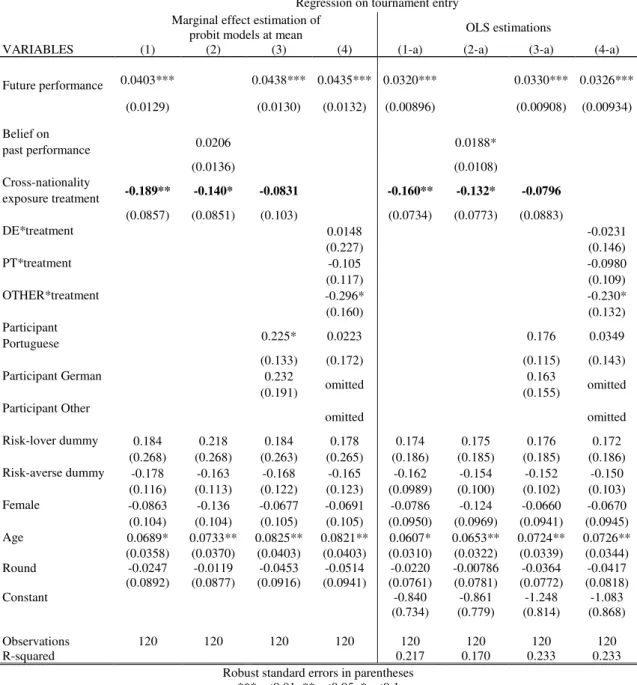
Table 7 reports marginal effects of probit regressions on the dependent variable tournament
entry, where 1 is entry. Marginal effects are reported at means. The regressions include a set of control variables and different explanatory variables, as discussed in section 5. For robustness
and to interpret interaction terms, all specifications are also represented as linear OLS
estima-tions.
For all specifications, the point estimate of the female dummy has the direction predicted
by the literature (e.g., Niederle and Vesterlund, 2007) but remains insignificant. As suggested
above, a participant’s age has a positive effect on the probability of tournament entry across most
specifications. Older participants are more likely to enter, ceteris paribus. The dummy terms for risk appetites have the expected sign but are statistically insignificant across all specifications.
Nine participants (18 observations) were excluded as their Holt-Laury test was inconsistent
(mostly alternating A-B pattern). No round effects can be detected.
As can be seen from models (1) and (2) to (4), future performance of participants is a
func-tioning predictor of tournament entry, suggesting that the realization of performance scores that
ex-ante can only be anticipated influence tournament entry, with a higher ex-post score
increas-ing participation in the tournament. Contrary to the author’s ex-ante expectations above, future performance (1) is a stronger predictor than reported beliefs (2) and has proven so in different
specifications. Consequently, future performance is used as independent variable for models (3)
and (4). Similar observations hold for OLS regressions with subscript “-a”.
Regressions (1) and (2) introduce the treatment, whereas (3) and (4) include controls and
Table 7
Regression on tournament entry Marginal effect estimation of
probit models at mean OLS estimations
VARIABLES (1) (2) (3) (4) (1-a) (2-a) (3-a) (4-a)
Future performance 0.0403*** 0.0438*** 0.0435*** 0.0320*** 0.0330*** 0.0326***
(0.0129) (0.0130) (0.0132) (0.00896) (0.00908) (0.00934)
Belief on
past performance 0.0206 0.0188*
(0.0136) (0.0108)
Cross-nationality
exposure treatment -0.189** -0.140* -0.0831 -0.160** -0.132* -0.0796 (0.0857) (0.0851) (0.103) (0.0734) (0.0773) (0.0883)
DE*treatment 0.0148 -0.0231
(0.227) (0.146)
PT*treatment -0.105 -0.0980
(0.117) (0.109)
OTHER*treatment -0.296* -0.230*
(0.160) (0.132)
Participant
Portuguese 0.225* 0.0223 0.176 0.0349
(0.133) (0.172) (0.115) (0.143) Participant German 0.232
omitted 0.163 omitted
(0.191) (0.155)
Participant Other
omitted omitted
Risk-lover dummy 0.184 0.218 0.184 0.178 0.174 0.175 0.176 0.172 (0.268) (0.268) (0.263) (0.265) (0.186) (0.185) (0.185) (0.186) Risk-averse dummy -0.178 -0.163 -0.168 -0.165 -0.162 -0.154 -0.152 -0.150
(0.116) (0.113) (0.122) (0.123) (0.0989) (0.100) (0.102) (0.103) Female -0.0863 -0.136 -0.0677 -0.0691 -0.0786 -0.124 -0.0660 -0.0670 (0.104) (0.104) (0.105) (0.105) (0.0950) (0.0969) (0.0941) (0.0945) Age 0.0689* 0.0733** 0.0825** 0.0821** 0.0607* 0.0653** 0.0724** 0.0726** (0.0358) (0.0370) (0.0403) (0.0403) (0.0310) (0.0322) (0.0339) (0.0344) Round -0.0247 -0.0119 -0.0453 -0.0514 -0.0220 -0.00786 -0.0364 -0.0417 (0.0892) (0.0877) (0.0916) (0.0941) (0.0761) (0.0781) (0.0772) (0.0818)
Constant -0.840 -0.861 -1.248 -1.083
(0.734) (0.779) (0.814) (0.868)
Observations 120 120 120 120 120 120 120 120
R-squared 0.217 0.170 0.233 0.233
Robust standard errors in parentheses *** p<0.01, ** p<0.05, * p<0.1
treatment on tournament entry and whether it is suitable to reduce overconfident over-entry.
Introducing cross-nationality exposure as independent variable next to performance
mea-sures in (1) and (2) support the hypothesized effect. Participants facing someone from a
differ-ent nationality are estimated to be less likely to differ-enter the tournamdiffer-ent, compared to those who
faced a compatriot. The coefficient estimates in (1) and (2) are significant at 5% and 10%,
re-spetively. Point estimates suggest that the treatment reduces entry probability by 19% to 14%,
per-formance measure, risk appetite, and some individual characteristics, the treatment effect has
the potential to reduce entry and lower efficiency-decreasing over-entry. Regression (3) and (4)
allow controlling and elaborating on these findings.
Estimation (3) is extended by dummy variables for the nationality of the participants. For
most nationalities, only one participant was present; these were grouped into “Others” and serve
as a baseline against facing a Portuguese or German competitor. Adding these nationality
dum-mies for competitors can be interpreted as controlling for tournament entry decision patterns
that would be specific and inherent to a participant’s nationality – one could imagine a specific
effect by nationality group for several reasons. For example, “Others” and Germans studying at
NOVA made the explicit choice to study abroad in a foreign environment and could generally
be more competitive or overconfident by self-selection. Contrary, given the reputation of the selectiveness of the Bachelor’s programme, Portuguese who studied at NOVA before the
Mas-ter’s degree could have a strong self-perception. These stories show that a nationality specific
effect is not all implausible.
Virtually no statistically significant effect can be detected for participant’s nationality
dum-mies, as visible from Table 7. Only the probit marginal effect dummy for Portuguese participant
is significant at 10% in (3), but not in the OLS specification 3-a. However, this specification
renders the treatment effect insignificant. It might be that in regressions (1) and (2) the treatment effect merely picked up variations in the difference in tournament entry across nationalities of
participants which were wrongly interpreted as a treatment effect. This observation also holds
for the Ordinary Least Squares (OLS) specifications reported on the right-hand side of the table.
Including dummies for participants’ and competitors’ nationalities in a linear regression on a
binary variable, the treatment effect shows no significant effect.
Regression (4) is used to investigate this claim and suggests rejecting it. The final
estima-tion presented introduces interacestima-tion terms with respective naestima-tionalities of participants, again divided into German, Portuguese and “Other” due to the size of the dataset. These
speci-fications ought to allow the treatment effect to differ across nationalities and detect whether
introducing mere nationality dummies picked up some of this effect or whether the treatment
treatment effect merely picked up nationality level effects as (3) could suggest. The interaction
term for both the “Other” group and Portuguese is negative and points towards the hypothesized
direction. Of those two, only the “Other” term is significant at 10%. The treatment effect for Germans is not significantly different from 0, suggesting that treatment effects that have been
interpreted in (1) and (2) are driven by non-Germans. While only one interaction term is
sig-nificant at 10%, given the number of observations, the estimates for Portuguese and “Others”
are still suggestive that the treatment has an effect and invite for an expanded analysis. For all
regressions (1) to (4) and all interaction terms, the point estimate always has the hypothesized
sign.
The OLS estimation for models (1-a) to (4-a) broadly support these findings. As in probit
marginal effects specification, the treatment has a negative effect on entrance at 10% signifi-cance. However, it is not robust to estimating (3-a) or (4-a) under OLS specification, only the
interaction term for “Others” is significant at 10% as in (4). Under consideration of the sample
size, in (4-a), the point estimate again is suggestive that the treatment has a negative effect on
tournament entry.
To conclude, the estimation results presented are suggestive that the treatment of
cross-national exposure reduces the probability of tournament entry and thus has the potential to
reduce overconfident, efficiency-reducing over-entry. It has been shown that the treatment is not robust to the mere introduction of dummy variables by participant’s nationality. However,
it was argued that more precise specification (4), including interaction terms between treatment
and nationalities, shows that the treatment could have the hypothesized effect, driven by
non-Germans. A larger sample pool could shed light on this. The remainder of this section will
discuss whether the treatment is robust to past entry decisions and potential issues arising from
the matching procedure.
6.2
Robustness checks
The following section will discuss the robustness of the treatment effect to different
6.2.1 Past entry decision and cross-nationality exposure
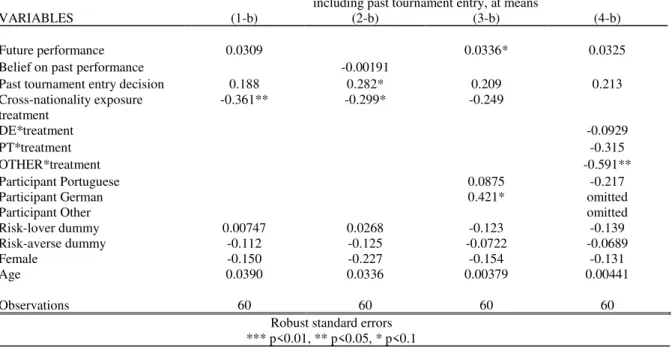
Information on past tournament entry can potentially be a useful predictor of current
tourna-ment entry to allow for a pattern in behaviour – consistency, insurance play, or a mix. This
information is only observable for round 3b), reducing the number of observations to 60. The difference in matching between round 3a) and 3b) could potentially raise questions about the
validity, which will be discussed below. The models used in paragraph 6.1 were enhanced by a
dummy variable for past tournament entry, and the estimation results are presented in Appendix
Table A-3 (with added subscript “-c”). Surprisingly, adding past entry decision on itself adds
only little explanatory power, with the added coefficient only statistically different from zero
in an expansion of regression (2). The point effect of the treatment variables remains the same
as for the estimations in table 7 and significant for expansions of the models (1) to (4), except (3) as before. The proposed treatment is robust in its evaluation above to the inclusion of past
entry decision and does not lose validity. Thus, facing a competitor from a different nationality
is suggestive to reduce a participant’s probability of joining the tournament and thus reduces
over-entry, compared to those facing a competitor from their own country when controlling for
participants past entry decisions.
6.2.2 Conditional past entry decision
Further refining of the sample supports the viability of the treatment. Regression (1) to (4) were
performed on the subset of round 3b) participants who have entered the tournament in round
3a) (See Appendix Table A-4 with added subscript “-d”). It thus includes all participants who
proofed willingness to enter a tournament. These regressions include a maximum 35 obser-vations and thus have only limited statistical power. The cross-nationality exposure treatment
remains significant with the correct sign for (1), (2) and (4), as before.
6.2.3 Robustness checks on matching
Due to limitations faced by the experimenter on the scale of the experiment and the number of
participants, round 3a) and 3b) were not fully identical. A difference existed in the matching
would seem reasonable to investigate whether there were differences stemming from the change
of matching of the German participants. To assess whether the treatment is robust to this
al-teration in matching procedure, estimation model (1) to (4) were reran excluding all German participants and all participants who faced a German – thus, the data are treated as if no German
were present in the first place. Results can be found in the Appendix (Table A-5). Necessarily,
both the level dummy and treatment interaction term for German participants were removed.
The pattern observed before still holds. The treatment effect on tournament entry probability
is negative and significant for one interaction term under the fully specified model (4), but not
for a specification (3) with only nationality level dummies, similar to the findings before. This
suggests that it is unlikely to be the differences in the matching process of Germans that drove
the results.
7
Conclusion
This thesis presented a behavioural economic laboratory experiment on overconfident
over-entry into tournaments conducted with 71 students at Nova SBE. Using an experimental design
based on Niederle and Vesterlund (2007), a novel information-based treatment was introduced.
Before making decisions on entry, students were provided additional information on their
com-petitor. All information except for a competitor’s nationality was considered economically
meaningless and introduced to not prime participants on the topic. Information on the com-petitor’s nationality was fundamental and exposure to a competitor from a different nationality
regarded as the treatment of cross-nationality exposure.
Treating nationality as an in-group defining characteristic, the goal was to assess the
hy-pothesis that competition across groups and thus exposure to a competitor from a different
na-tionality affected tournament entry decision. Consequently, it was shown that cross-nana-tionality
exposure is a valid mean to reduce overconfident over-entry and increase efficient entry decision
making.
In line with the literature, it has been shown that overconfidence in entry was present within
the sample. The effect of the treatment was found to be pointing towards the hypothesized
are suggestive that the treatment has the hypothesized effect and could be a valid mechanism to
reduce inefficiently high numbers of entry when overconfident over-entry is present. Whereas
results are suggestive, it remains important to note that like in all laboratory experiments, issues of external validity might remain if students at Nova SBE are a specifically non-representative
sample. Contrary, Nova SBE has an international student population and may, in fact, be an
ap-propriate environment to study such effects. This leaves scope for further research to investigate
the proposed treatment with a higher number of participants allowing for improved matching,
observation, and statistical power.
If the proposed effect holds, that is, cross-nationality exposure is found to be a valid means to
reduce overconfident over-entry, it could be an important mechanism to reduce overconfidence
in applied settings. It could encourage to increase the exposure of agents to individuals from different nationalities to reduce overconfident actions. This finding suggests that promoting a
multicultural workplace can be beneficial to improve efficient decision making in all kind of
entities and principal-agent relations such as companies, corporations, NGOs or public bodies.
8
References
Arkes, Hal R., Christensen, Caryn, Lai, Cheryl, and
Catherine Blumer. 1987. “Two methods of reducing
overconfidence.” Organizational Behavior and Human
Decision Processes, 39(1): 133-144.
Barber, Brad M., and Terrance Odean. 2001. “Boys
will be boys: Gender, overconfidence, and common
stock investment.” The quarterly journal of economics,
116(1): 261-292.
Barberis, Nicholas, and Richard Thaler,. 2003.
“A survey of behavioral finance.” In Handbook of the
Economics of Finance, Edited by George M.
Constan-tinides, Milton Harris and Rene M. Stulz, 1053-1128.
Brenner, Lyle A., Koehler, Derek J., Liberman,
Varda., and Amos Tversky. 1996. “Overconfidence in
probability and frequency judgments: A critical
exami-nation.”Organizational Behavior and Human Decision
Processes, 65(3): 212-219.
Buehler, Roger, Griffin, Dale, and Michael Ross.
1994. “Exploring the "planning fallacy": Why people
underestimate their task completion times.” Journal of
personality and social psychology, 67(3): 366.
Camerer, Colin, and Dan Lovallo. 1999.
“Overcon-fidence and excess entry: An experimental approach.”
The American Economic Review, 89(1): 306-318.
Charness, Gary., and Aldo Rustichini. 2011.
“Gen-der differences in cooperation with group membership.”
Games and Economic Behavior, 72(1): 77-85.
Charness, Gary., Rigotti, Luca, and Aldo
Rusti-chini. 2007. “Individual behavior and group
Chen, Yan, and Sherry X. Li. 2009. “Group
iden-tity and social preferences.” The American Economic
Review, 99(1): 431-457.
Clayson, Dennis E., and Debra. A. Haley. 2005.
“Marketing models in education: Students as customers,
products, or partners.” Marketing Education Review,
15(1): 1-10.
De Bondt, Werner F., and Thaler, Richard H.
(1995). “Financial decision-making in markets and
firms: A behavioral perspective.” inHandbooks in
oper-ations research and management science, ed. R. Jarrow
et al., 9, 385-410. Amsterdam: Elsevier Science
Gervais, Simon., Heaton, J. B., and Terrance
Odean. 2011. “Overconfidence, compensation
con-tracts, and capital budgeting.” The Journal of Finance,
66(5): 1735-1777
Gneezy, Uri, Leonard, Kenneth. L., and John. A.
List. 2009. “Gender differences in competition:
Ev-idence from a matrilineal and a patriarchal society.”
Econometrica, 77(5): 1637-1664.
Healy, Andrew, and Jennifer Pate. 2011. “Can
teams help to close the gender competition gap?.” The
Economic Journal, 121(555): 1192-1204.
Holt, Charles. A. and Susan Laury. 2002. “Risk
Aversion and Incentive Effects.” Andrew Young School
of Policy Studies Research Paper SeriesNo. 06-12.
Johnson, Dominic. D. 2009. Overconfidence and
war. Cambridge: Harvard University Press.
Malmendier, Ulrike, and Geoffrey Tate. 2005.
“CEO overconfidence and corporate investment.” The
journal of Finance, 60(6), 2661-2700.
Moore, Don. A., and Paul J. Healy. 2008.
“The trouble with overconfidence.“ Psychological
re-view, 115(2): 502.
Neale, Margaret. A., and Max H. Bazerman. 1985.
“The effects of framing and negotiator overconfidence
on bargaining behaviors and outcomes.” Academy of
Management Journal, 28(1), 34-49.
Niederle, Muriel, and Lise Vesterlund. 2005. “Do
women shy away from competition? Do men compete
too much?” No. w11474.National Bureau of Economic
Research.
Niederle, Muriel, and Lise Vesterlund. 2007. “Do
women shy away from competition? Do men
com-pete too much?.”The Quarterly Journal of Economics,
122(3): 1067-1101.
Odean, Terrence. 1998. “Volume, volatility, price,
and profit when all traders are above average.”The
Jour-nal of Finance, 53(6), 1887-1934.
Plous, Scott. 1993. The psychology of judgment
and decision making. New York: McGraw-Hill.
Scheinkman, Jose. A., and Wei Xiong. W. 2003.
“Overconfidence and speculative bubbles.” Journal of
political Economy, 111(6): 1183-1220.
Svenson, Ola. 1981. “Are we all less risky and
more skillful than our fellow drivers?.” Acta
psycho-logica, 47(2): 143-148.
van Veldhuizen, Roel. 2017. “Gender differences in
tournament choices: Risk preferences, overconfidence
9
Appendix
9.1
Figures
Figure A-1
9.2
Tables
Table A-1
Holt-Laury Risk aversion test
Switching point Freq. Percent Cum.
Risk loving
1 0 0.00% 0.00%
2 1 1.61 % 1.61 %
3 2 3.23 % 4.84 %
Risk neutral 4 16 25.81 % 30.65 %
Risk averse
5 16 25.81 % 56.45 %
6 11 17.74 % 74.19 %
7 9 14.52 % 88.71 %
8 2 3.23 % 91.94 %
9 3 4.84 % 96.77 %
10 2 3.23 % 100 %
Total 62 100.00
Table A-2
Participants belief on their relative rank position among 10 randomly chosen participants Belief on
relative rank Freq. Percent Cum.
1 3 4.35 % 4.35 %
2 7 10.14 % 14.49 %
3 12 17.39 % 31.88 %
4 12 17.39 % 49.28 %
5 12 17.39 % 66.67 %
6 10 14.49 % 81.16 %
7 8 11.59 % 92.75 %
8 3 4.35 % 97.10 %
9 1 1.45 % 98.55 %
10 1 1.45 % 100.00 %
Table A-3
Marginal effect estimation of Probit estimation on tournament entry, models (1) to (4) including past tournament entry, at means
VARIABLES (1-b) (2-b) (3-b) (4-b)
Future performance 0.0309 0.0336* 0.0325 Belief on past performance -0.00191
Past tournament entry decision 0.188 0.282* 0.209 0.213 Cross-nationality exposure
treatment
-0.361** -0.299* -0.249
DE*treatment -0.0929
PT*treatment -0.315
OTHER*treatment -0.591**
Participant Portuguese 0.0875 -0.217
Participant German 0.421* omitted
Participant Other omitted
Risk-lover dummy 0.00747 0.0268 -0.123 -0.139 Risk-averse dummy -0.112 -0.125 -0.0722 -0.0689
Female -0.150 -0.227 -0.154 -0.131
Age 0.0390 0.0336 0.00379 0.00441
Observations 60 60 60 60
Robust standard errors *** p<0.01, ** p<0.05, * p<0.1
Table A-4
Marginal effect estimation of Probit regression on tournament entry decision in round 3b for participants who entered in round 3a, at means
VARIABLES (1-c) (2-c) (3-c) (4-c)
Future performance 0.0314 0.0378 0.0408 Belief on past performance 0.0412**
Cross-nationality exposure
treatment -0.355** -0.390** -0.168
DE*treatment omitted
PT*treatment -0.431*
OTHER*treatment -0.534*
Participant Portuguese 0.267 0.0907
Participant German 0.456** omitted
Participant Other omitted
Risk-lover dummy -0.0217 -0.0331 -0.167 -0.362 Risk-averse dummy -0.132 -0.112 -0.157 -0.193
Female 0.0416 0.0378 -0.0204 0.0418
Age 0.0723 0.102* 0.0815 0.107
Observations 35 35 35 30
Table A-5
Probit marginal effects estimation on tournament entry, excluding German participants and participants who interacted with those, at means
VARIABLES (1-d) (2-d) (3-d) (4-d)
Future performance 0.0497*** 0.0544*** 0.0544***
Belief on past performance 0.0630*** Cross-nationality exposure
treatment -0.189 -0.222* -0.0482
PT*treatment -0.0482
OTHER*treatment -0.352**
Participant Portuguese 0.304*
Participant Other omitted
Risk-lover dummy omitted omitted omitted omitted
Risk-averse dummy -0.244* -0.205 -0.224 -0.224
Female -0.208* -0.207* -0.178 -0.178
Age 0.102** 0.139*** 0.136*** 0.136***
Round -0.0602 -0.0663 -0.0504 -0.0504
Observations 81 81 81 81
9.3
Experiment sheets
Round 3a
Dear student number __________________ (Student number), your competitor is ________ (age)
Please fill in your 5-digit student ID: _____________
INSTRUCTIONS
Welcome to this experimental session!
During the experiment, it is not allowed to communicate with other participants. If you have a
question, please raise your hand and we will approach you in silence. If a question is relevant for other
participants, we will answer it aloud for everyone.
Please fill in your 5-digit student ID on the top of EVERY page
You will receive sheets of paper during the course of the experiment. The experiment sheets will
contain rows of 2-digit numbers. Each row contains 5 such numbers, followed by an empty cell at the
right-side end of each row.
You are asked to add the 2-digit numbers in each row and report the result of your additions in the
empty cell at the right-side end of each row. See below for an example exercise.
You cannot use a calculator or phone but you may use blank paper.
EXAMPLE
Below you can see an example on how to perform the exercise. The five 2-digit numbers [Grey
background] need to be added up and written in the right-side box labelled “Result”, which will be
empty. In this example, it is filled with the correct answer [Green background] for illustrative purposes.
This will not be the case in your experimental sheets.
Numbers to be added Result
(Box empty)
11 82 29 44 74 240
PAYMENT
In each round, you will be able to earn Experimental Currency Units depending on your performance
(ECU).
After the experiment, one round (out of 4) will be randomly chosen to determine the ECU allocation.
Each ECU works as an individual lottery ticket. Amongst all ECUs, five will be randomly drawn. Each
winning ECU is worth 20€. Thus, for each ECU earned during the game you increase your probability
Please fill in your 5-digit student ID: _____________
Round 1: Piece rate
Your sheet contains rows of 2-digit numbers. All rows contain 5 such numbers, followed by an empty cell at the right-side end of each row.
You are asked to add the 2-digit numbers in each row and report the result of your additions in the empty cell at the right-side end of each row. You have 5 minutes to perform as many additions as possible.
You cannot use a calculator or phone but you may use blank paper.
For every correctly solved addition, you will receive 1 ECU.
Numbers to add Results
21 54 76 56 99
64 22 28 79 25
73 88 24 31 71
57 18 95 53 82
28 79 46 39 21
69 27 72 36 32
86 11 25 17 47
75 35 55 57 72
46 41 77 27 45
36 80 14 73 50
49 72 86 67 52
77 80 10 92 39
28 82 60 76 27
27 67 16 80 15
34 71 47 14 37
98 13 79 99 55
24 78 33 67 60
15 89 61 37 70
63 74 88 69 69
43 29 26 44 59
92 85 26 56 27
29 65 67 37 64
74 21 79 93 49
81 53 71 63 61
66 88 79 44 55
84 20 43 83 53
39 73 57 75 30
68 21 88 76 58
83 84 27 61 89
Please fill in your 5-digit student ID: _____________
Round 1: Piece rate
Please indicate how many additions you think you solved correctly in round 1 (The round you just played). Report the number in the box below.
If your guess is correct, you will receive an additional 1 ECU that will be added to your performance.
Please fill in your 5-digit student ID: _____________
Round 2: Tournament
Your sheet contains rows of 2-digit numbers. All rows contain 5 such numbers, followed by an empty cell at the right-side end of each row.
You are asked to add the 2-digit numbers in each row and report the result of your additions in the empty cell at the right-side end of each row. You have 5 minutes time to perform as many additions as possible.
In this round, you will be randomly matched against another participant. If you made more correct additions than your competitor, you will receive 2 ECU per correctly solved answer and none otherwise. In case of a tie, the winner will be randomly chosen.
Numbers to add Results
38 86 59 36 68
73 86 14 82 39
46 49 66 80 89
65 53 31 44 67
67 13 21 27 53
84 71 35 55 75
65 45 12 35 16
61 85 23 66 93
26 70 84 57 83
22 99 97 87 33
59 34 58 93 62
98 74 35 80 94
63 20 47 41 12
24 67 14 18 90
33 46 37 51 56
91 56 91 81 30
63 42 13 39 94
14 43 48 39 47
75 17 11 18 85
73 49 96 77 71
13 53 99 29 79
69 93 43 18 53
65 24 36 12 56
65 40 66 18 49
50 70 18 92 49
79 86 48 27 53
28 54 27 27 12
87 95 49 20 18
30 51 46 31 24
Please fill in your 5-digit student ID: _____________
Round 2: Tournament
Please indicate how many additions you think you solved correctly in round 2 (The round you just played). Report the number in the box below.
If your guess is correct, you will receive an additional 1 ECU that will be added to your performance.
Please fill in your 5-digit student ID: _____________
Round 3a: Choice of compensation
In this round, you will be randomly matched against a competitor. You will receive additional
information about your competitor beforehand and then choose your compensation scheme before
performing. The tasked performed is the same as before:
Your sheet contains rows of 2-digit numbers. All rows contain 5 such numbers, followed by an empty cell at the right-side end of each row. You are asked to add the 2-digit numbers in each row and report the result of your additions in the empty cell at the right-side end of each row. You have 5 minutes time to perform as many additions as possible.
If you chose the fixed-payment scheme, you will receive 1 ECU for every correctly solved addition
If you chose the tournament payment scheme, you will receive 2 ECU per correctly solved addition if you made more correct additions than your competitor and zero if otherwise. In case of a tie, the winner will be randomly selected. Your performance in round 3a will be evaluated against your competitors round 2 performances, which was performed under a tournament scheme.
Please select your scheme of compensation for round 3a below:
Piece Rate
Please fill in your 5-digit student ID: _____________
Round 3a: Choice of Compensation
Your sheet contains rows of 2-digit numbers. All rows contain 5 such numbers, followed by an empty cell at the right-side end of each row.
You are asked to add the 2-digit numbers in each row and report the result of your additions in the empty cell at the right-side end of each row. You have 5 minutes time to perform as many additions as possible.
You will be paid according to the scheme you chose before.
Numbers to add Results
64 27 63 32 92
68 34 80 68 54
46 83 76 52 26
92 99 89 65 68
45 61 87 22 70
33 74 30 65 61
37 87 99 77 67
92 95 84 54 29
22 40 66 84 37
59 39 35 79 84
42 71 43 35 17
21 93 13 92 86
41 16 90 83 84
66 20 37 31 26
20 84 52 80 78
79 73 75 52 74
69 56 43 15 32
48 88 63 60 12
76 80 86 84 57
81 10 91 34 86
43 86 86 51 19
30 85 29 92 83
10 88 86 32 41
53 69 68 80 68
95 23 25 27 28
26 63 77 22 20
42 78 76 28 18
25 26 54 96 11
60 21 89 79 94
Please fill in your 5-digit student ID: _____________
Round 3a: Choice of Compensation
Please indicate how many additions you think you solved correctly in round 3a (The round you just played). Please also indicate how many additions you think your competitor solved in the round you
competed against (his/her Round 2). Report the numbers in the box below.
You will receive an additional 1 ECU that will be added to your performance for each correct guess.
Please indicate your best guess for your own performance (number of additions solved correctly) here:
Please fill in your 5-digit student ID: _____________
Round 3b: Choice of compensation
Round 3b is a repetition of Round 3a you just played. However, you will be randomly matched against
a different participant than before.
In this round, you will receive additional information about your competitor beforehand and then
choose your compensation scheme before performing. The tasked performed is the same as before:
Your sheet contains rows of 2-digit numbers. All rows contain 5 such numbers, followed by an empty cell at the right-side end of each row. You are asked to add the 2-digit numbers in each row and report the result of your additions in the empty cell at the right-side end of each row. You have 5 minutes time to perform as many additions as possible.
If you chose the fixed-payment scheme, you will receive 1 ECU for every correctly solved addition
If you chose the tournament payment scheme, you will receive 2 ECU per correctly solved addition if you made more correct additions than your competitor and zero if otherwise. In case of a tie, the winner will be randomly selected. Your performance in round 3b will be evaluated against your competitors round 2 performances, which was performed under a tournament scheme.
Please select your scheme of compensation for round 3b below:
Piece Rate