Artigo / Article
Hematological and nutritional parameters in apparently healthy elderly
individuals
Parâmetros hematológicos e nutricionais em idosos aparentemente saudáveis
Mariza D'Agord Schaan1 Carla H. A. Schwanke2 Moisés Bauer3 Clarice Luz3 Ivana M. Cruz4,5
1Serviço de Hematologia, Faculdade de Medicina, Pontifícia Universidade Católica do Rio Grande do Sul (PUCRS). 2Faculdade de Biociências, Pontifícia Universidade Católica do Rio Grande do Sul (PUCRS).
3Instituto de Pesquisas Biomédicas, Pontifícia Universidade Católica do Rio Grande do Sul (PUCRS).
4Departamento de Ciências da Saúde, Universidade Regional do Noroeste do Estado do Rio Grande do Sul (UNIJUI). 5Departamento de Morfologia, Centro de Ciências da Saúde, Universidade Federal de Santa Maria.
Correspondence: Ivana Beatrice Manica da Cruz Rua José Hickembick 138/101
98700-000 – Ijuí-RS – Brasil
Tel.: 55-55-33320301; Fax: 55-55-33323303 E-mail: [email protected]
Introduction
Aging is related to a progressive decline in the functional reserve of multiple organ systems increasing the probability of dysfunction and disease. Hematopoiesis is maintained by the balance between production and destruction of blood cells. Hematopoietic modulation becomes imbalanced with aging. The reason for this phenomenon is related to the decrease in the bone marrow's ability to respond to stimuli such as bleeding, infection and cytotoxic damage. Studies in this setting suggest a decline in
the stem cell population reserve, imbalance in the hematopoietic cytokine production, decreased sensitivity of stem cells and precursor cells to the action of cytokines and alterations in the microenvironment impairing homing.1
Anemia, generally mild, is a common problem in the elderly, especially in men. The incidence of anemia increases with age, principally after 60 years old.2 The frequency of
anemia of undetermined etiology in the elderly is high, constituting 14 to 17% of anemias in this age group. This high prevalence raised the hypothesis that lower levels of hemoglobin could be associated with the normal aging process. A non-probabilistic study in an elderly free living community was performed. The first analysis was cross-sectional in design and the additional analysis, a case-control design. In the first analysis, 745 subjects were enrolled. Additional analyses, made in 46 apparently healthy elderly subjects (AHE) and 33 young adults (YA) included: clinical, hematological and biochemical analyses, 24-hours nutritional recall and diet frequency questionnaire. The AHE were selected using the Senieur test protocol. To avoid selection bias in the AHE sample, additional analysis comparing cultural, socioeconomic, and health variables were compared between AHE and non-selected elderly with same dysfunction or morbidity (DE). The prevalence of AHE was 6.17% (n=46) among whom 4.3% were anemic. There were no statistically differences in hematocrit, hemoglobin, leukocytes and vitamin B12 levels between AHE and YA groups. Mean values of MCV, RDW, eosinophils, folate and ferritin were higher in the AHE than the YA group. On the other hand, platelets were higher in the YA group. No statistically significant difference occurred between the AHE and DE groups when nutritional indicators were compared. The comparison between nutritional indicators of anemic and non-anemic apparently healthy elderly people showed statistically significant differences in vitamin B12 and protein intake, which were lower in the anemic elderly. The results suggest independent biological differences between hematological parameters of elderly and young individuals. Rev. bras. hematol. hemoter. 2007;29(2):136-143.
However, controversy continues to surround the significance of unexplained anemia in elderly patients and the extent to which this could be a physiological occurrence.3 There are
opinions in favor and against this statement. Untreated geriatric anemia was associated with higher mortality, increasing the prevalence of comorbidities and functional impairment.4 In this context, several questions arise such as:
what main hematological changes in aging are independently associated to diseases and physiological dysfunction? To contribute to the elucidation of this question, the present study was performed with four general objectives: (1) to identify the prevalence of apparently healthy elderly subjects (HE); (2) to compare the hematological parameters between AHE and a young adult group (YA); (3) to compare nutritional indicators between AHE and elderly people who have some dysfunction or morbidity (HD) and to compare nutritional indicators between anemic and non-anemic HE.
Methods
Type of study
A non-probabilistic and community based study was performed. The first analysis had a cross-sectional design and additional analyses case-control designs. Elderly subjects, who participate in informal social groups in Gravataí, a town in the Porto Alegre Metropolitan Area, Brazil, were recruited by random selection from the Gravatai Health and Social Assistance Service which provides support to the Gravataí Project. They compose the GENESIS-Gravatai Project that investigates gene-environmental interactions in healthy aging and age-related diseases. Methodological details and general sample data about the project are given in Da Cruz et al.5and Flores et al.6 Data collection was made in the
Muni-cipal City Office of Gravataí and Catholic Medicine School, Institute of Biomedical Research and Institute of Geriatrics and Gerontology, Pontificia Universidade Católica in Rio Grande do Sul.
Patients
To perform the study, 745 elderly subjects (> 60 years old) were recruited from local community groups and registered at the Office for Social Care in Gravataí. This elderly population corresponds both ethnically and socio-economically to the general population of the State of Rio Grande do Sul.5 The other analyses were made for AHE
selected from first analysis and a control group of young adults (YA, n=33).
Method
HE and YA groups were appraised by the SENIEUR 22 protocol that defines rigorous criteria for selecting healthy individuals in immunogerontological studies. Details regarding the selection of the AHE group are described by Luz et al.7 The prevalence of apparently AHE was determined.
The AHE group was defined as being free of acute or chronic diseases determined by medical history and physical examination as described in a similar study conducted by Olivares et al.8 and a nutritional assessment. Usual dietary
intake was assessed by a 24-hour food record and a food-frequency questionnaire.9 Additional AHE Group health
conditions were checked according to accurate clinical investigations and to hematological and biochemical parameters as well as by anthropometric data. AHE exclusion criteria were presence of infection, chronic or acute inflammation, autoimmune disease, cardiopathy, under-nourishment, clinical depression, neurodegenerative diseases, neoplasias, caregiving subjects, the use of hormones or drugs and refusal to participle of the study.10
Similar procedures were made to select the YA Group. To avoid selection bias in the AHE sample, additional analysis comparing cultural, socioeconomics, and health variables were compared between AHE and non-selected elderly (DE). These variables included: (1) anthropometric data: body mass index (BMI) was obtained with quantification of weight (kilograms) and height (meters) using mechanical weighing scales (Filizolla, São Paulo). Then, the BMI was calculated by dividing the weight in kilograms by the square of the height in meters (kg/m2). Smoking status: Smoking was
considered for cigarettes and other forms of tobacco. Ingestion of alcoholic beverages was by the number of glasses of alcohol beverages ingested per week. Also, this study investigated: (1) Daily life activities (DLA) constructed in the following four domains: movement; dressing and bathing, eating and urinary continence.11 (2) life satisfaction:
four physical items about life satisfaction were also investigated;12 (3) nutritional risk: the Nutrition Screening
Initiative (NSI) score was used to measure the risk of undernourishment.13
Hematological measurements
Fasting blood samples were obtained from each AHE subject by venipuncture. Less than 20 mL of blood was drawn from each subject in three Vacutainers: one containing K2 -EDTA for complete blood counts (CBCs); one containing K2 -EDTA for folate, vitamin B-6 and B-12 status assessment; one dry Vacutainer for other serum measurements. All blood samples were immediately transported in an thermal box to the laboratory. Measurements performed on the blood samples included red blood cell (RBC) count, total lymphocyte (TLC) count, hemoglobin (Hb), hematocrit (Ht), mean corpuscular volume (MCV), mean corpuscular hemoglobin concentration (MCHC), leukocyte count and platelet count. Plasma vitamin B-12 concentrations were measured using the Bio-Rad Quantaphase II assay. Serum ferritin determinations were performed using a two-site enzyme immunoassay. 14 The prevalence of anemia in the AHE and
Table 1. Global health indicators comparison between apparently healthy elderly (HE) and the other elderly participating in Projeto Gravataí (DE)
Variables Specification
Apparently healthy elderly (HE)
Elderly with previous disease (DE)
p
Social economic and Cultural
Income Status (US$)/
month % %
No income 5.6 5.9 0.395
50 a 139 64.2 66.8
140 a 279 20.0 20.5
280 a 359 10.2 4.2
> 360 2.9
Education background 0.456
illiterate 14.6 17.50
< 3 years 9.0 11.0
>2 < 8 years 74.2 67.2
>8 < 12 years 4.2 3.6
>12 years 0.0 0.7
Marital Status 0.408
Married 30.6 33.3
Widowed 50.0 51.3
Single 6.2 5.9
Divorced 13.2 9.4
Functional status
(retirement) 87.7 74.1 0.229
Sanitary conditions
Immunizations
(/year) 63.0 58.0 0.457
Physician
evaluation/year 85.7 80.3 0.546
Regular medicine
consumption 0.0 63.8 0.001
Nutritional Risk (NSI)
Low 38.1 35.10 0.171
Moderate 47.6 30.70
High 14.3 34.20
Smoking status 70.6 80.5 0.518
Males 30.1 34.42
Females 15.68
Daily Living Activities (DLA)
Independence 86.7 82.9 0.687
Wash and dress 95.9
Eating 98.5 97.40
Movement 94.80
Urinary continence 75.7 79.81 0.586
<130 g/dL for women and <120g/dL for men, and macrocytosis as a mean corpuscular volume (MCV) >100 fL.15
Subsequently, a comparison between the hematological and the nutritional profile between AHE and YA groups was made. Additionally, clinical and nutritional parameters were compared between the AHE group and the
other elderly subjects that participated in the Project.
Statistical analysis
The data were analyzed using SPSS Version 9.0.16 Categorical variables were
summarized using frequencies and percentages. Means and standard deviations were calculated for continuous variables and normality was assessed. Variables not normally distributed were log transformed before analysis. To assess differences between AHE and other elderly participants of the Project Genesis – Gravataí, AHE and YA Groups, AHE anemic and non-anemic subgroups, chi-square analysis and Student t-test were performed on categorical variables and continuous variables, respectively. When the continuous variables did not present normal distribution the comparison was performed using the non-parametric Wilcoxon Mann-Whitney test. Forward Wald logistic regression was performed to test intervenient variables in the statistical positive associations. All variables with p-values >0.20 were included in the regression equation.
Ethics
The Ethics Committee of the Pontifical Catholic University of Rio Grande do Sul approved the study protocol. Informed consent was prospectively obtained from all individuals whose information was collected.
Results
The prevalence of apparently healthy elderly (HE) was 6, 17% (n=46). The AHE group was composed of 32.6 (n=15) male and 67.4% (n=31) female individuals. In the DE group, 31% (n=217) were male and 69% (n=484) female. There were no statistical differences in gender proportions of both groups (p=0.847). Mean ages were also similar in both groups: AHE group was 66.3 ± 5.0 years and DE group was 66.9 ± 7.4 (p=0.591).
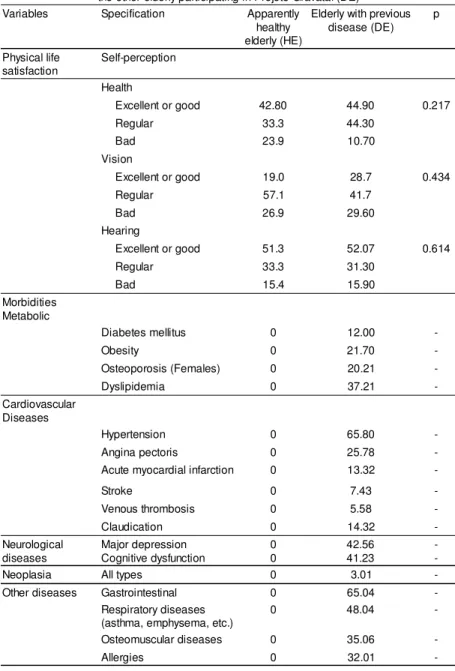
The comparison of health indicators
Table 1 - Global health indicators comparison between apparently healthy elderly (HE) and the other elderly participating in Projeto Gravataí (DE)
Variables Specification Apparently healthy elderly (HE)
Elderly with previous disease (DE)
p
Physical life satisfaction
Self-perception
Health
Excellent or good 42.80 44.90 0.217
Regular 33.3 44.30
Bad 23.9 10.70
Vision
Excellent or good 19.0 28.7 0.434
Regular 57.1 41.7
Bad 26.9 29.60
Hearing
Excellent or good 51.3 52.07 0.614
Regular 33.3 31.30
Bad 15.4 15.90
Morbidities Metabolic
Diabetes mellitus 0 12.00
-Obesity 0 21.70
-Osteoporosis (Females) 0 20.21
-Dyslipidemia 0 37.21
-Cardiovascular Diseases
Hypertension 0 65.80
-Angina pectoris 0 25.78
-Acute myocardial infarction 0 13.32
-Stroke 0 7.43
-Venous thrombosis 0 5.58
-Claudication 0 14.32
-Neurological diseases
Major depression Cognitive dysfunction
0 0
42.56 41.23
-Neoplasia All types 0 3.01
-Other diseases Gastrointestinal 0 65.04
-Respiratory diseases (asthma, emphysema, etc.)
0 48.04
-Osteomuscular diseases 0 35.06
-Allergies 0 32.01
-p = significance measured by chi-square. 1 US$ (dollar) = R$2.8
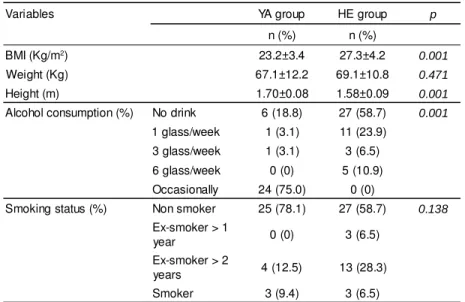
Mean age of the young adult group was 27.4 ± 6.7. In the young group 45, 5% (15) were men and 54.5% (18) women. No significant differences were seen in gender frequencies between both groups (p=0.246) or other variables with the exception of the ingestion of medicines and previous morbidities as expected.
The comparison of biological and lifestyle variables between the AHE and YA Groups are described in Table 2. The AHE group presented with a higher BMI than the YA Group, and shorter stature. The YA Group reported they occasionally drank alcohol, while the majority of AHE subjects reported no alcohol intake. There were no statistically significant differences in smoking between groups.
The hematological profile showed statistically significant differences between AHE and YA Groups. Mean values of VCM, RDW, eosinophils, ferritin and folic acid were higher in the older group, while mean values of CHCM and platelets were higher in the young group (Table 3).
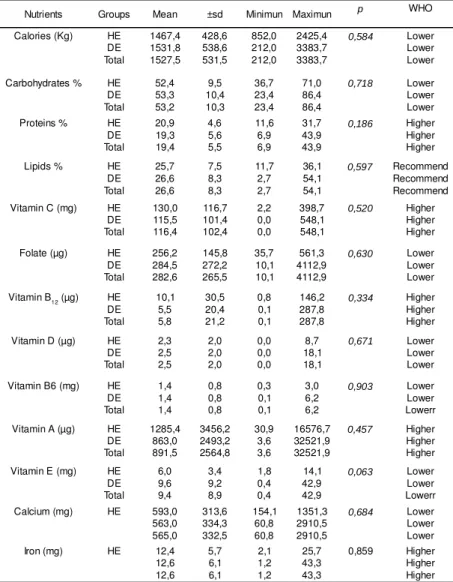
The nutritional profile was statistically similar between the AHE and DE Groups (Table 4). However, unbalanced nutrition ingestion was observed in the two groups of elderly subjects (HE and DE). Lower mean values to those recommended by WHO were detected in the ingestion of the following nutrients: calories, carbohydrates, folic acid, vitamin D, vitamin B6, calcium and vitamin E. On the other hand, the mean values of ingestion of vitamin B12, vitamin A, vitamin C, iron and protein were higher than those recommended by WHO.
Prevalence of anemia in the AHE group was 4.3%. Even considering the low number of anemic subjects, hematological and nutritional parameters of the anemic and non-anemic elderly were compared. The results are summarized in Table 5. Mean values of serum vitamin B12 and mean values of protein ingestion were significantly lower in the anemic group than in the non-anemic apparently healthy subjects.
Discussion
The present study describes the prevalence of apparently healthy elderly individuals. Additionally, we analyzed the hematological profile of aged subjects selected for being healthy, comparing them with a group of young adults also without known morbidities. The study shows a very low frequency of apparently healthy elderly, no major nutritional influence on the hematological parameters investigated and a very low prevalence of anemia in the AHE Group.
Table 2. Anthropometric and life style variables comparison between apparently healthy elderly (HE) and young adults (YA).
Variables YA group HE group p
n (%) n (%)
BMI (Kg/m2) 23.2±3.4 27.3±4.2 0.001
Weight (Kg) 67.1±12.2 69.1±10.8 0.471
Height (m) 1.70±0.08 1.58±0.09 0.001
Alcohol consumption (%) No drink 6 (18.8) 27 (58.7) 0.001
1 glass/week 1 (3.1) 11 (23.9) 3 glass/week 1 (3.1) 3 (6.5) 6 glass/week 0 (0) 5 (10.9) Occasionally 24 (75.0) 0 (0)
Smoking status (%) Non smoker 25 (78.1) 27 (58.7) 0.138
Ex-smoker > 1
year 0 (0) 3 (6.5)
Ex-smoker > 2
years 4 (12.5) 13 (28.3)
Smoker 3 (9.4) 3 (6.5)
p= significant value using Student t test.
In this study there were no significant differences between hematocrit and hemoglobin levels in the elderly and young adults. This finding agrees with other reports investigating aged people and implies the adequacy of the WHO diagnostic criteria for anemia, which use the same reference values as young adults. However, it must be remembered that this is a cross-sectional study limiting this kind of conclusion. The establishment of normal hematocrit and hemoglobin values for the aged is complex, because of the heterogeneity of this population and the great diversity of studies on this issue. Longitudinal investigations would be better to evaluate this, but they are scarce and difficult to execute.
Some authors, such as Yamada et al.
state that there is a physiological reduction in normal hematologic values as age increases. In this study a group of Japanese individuals was followed up for a forty-year period, measuring hemoglobin levels every two years, with adjustments for gender, birth cohort, cigarette smoking and anemia related diseases. This group was used as a control group for other subjects submitted to atom bomb irradiation, accompanied during the same period of time. A tendency for the hemoglobin rate to diminish with age was identified; thus the authors postulated that aging per se may be the cause of anemia. Also, cohort effects and consequences of cigarette smoking were observed.
Blood hemoglobin (Hb) has, in a number of studies, been reported to decline in the elderly, more so among men than among women.17 No consensus has been reached on
age-related Hb patterns in healthy elderly persons, which may be due, in part, to the study designs used.18
We observed anemia even in the apparently healthy elderly group. A similar study performed by Olivares et al.
was conducted in Chile. These authors analyzed 275 apparently healthy individuals older than 60 and found a prevalence of 4% of anemia in men and 4% in women. This was similar to our results indicating that even in aged people without detectable disease, anemia may occur. These findings are corroborated in longitudinal studies. Similar results were found in the Seneca study, a multicentric longitudinal study,19,20 that described 6% of anemia in men and 5% for
women, at the beginning and at the end of a five-year observation period. Izaks et al.21 also found an increase in
mortality risk following anemic elderly individuals for five
Table 3. Hematological indicators comparison between apparently health elderly and young adult groups
Variables YA group HE group p
Mean ± sd Median Mean ± sd Median
HT 41,66 ± 3,74 43 42,31 ± 3,53 42 0,489
HB (g/dl) 14,13 ± 1,50 14,7 14,06 ± 1,29 13,9 0,841
RCC (x 1012 / l) 4,75 ± 0,43 4.7 4,64 ± 0,37 4.6 0,295
MCV (-fl) 87,14 ± 3,89 87 90,89 ± 4,19 91 0,001
MCHC 33,42 ± 0,75 34 32,80 ± 0,98 33 0,015
RDW (%) 13,15 ± 0,59 13,1 13,53 ± 0,60 13,5 0,042
WBC (x 109 / l) 6595,93 ± 1965,57 6,600 6788,89 ± 1370,84 6,900 0,642
Neutrophils (x 109 / l) 3954,77 ± 1105,08 3755 3843,91 ± 1029,38 3708 0,687
Basophils (x 109 / l) 28,73 ± 21,08 28 31,91 ± 25,11 30 0,610
Eosinophils* (x 109 / l) 169,50 ± 120,60 120 267,80 ± 258,47 241 0,038
Monocytes (x 109 / l) 552,73 ± 194,62 441 579,38 ± 173,30 588 0,572
Lymphocytes (x 109 / l) 2329,73 ± 632,21 2122 2035,16 ± 603,80 2126 0,069
Platelets (x 109 / l) 253.666,67 ± 61.429,01 249000 210.000,00 ± 55.893,44 206000 0,024
B12 serum* (ng / l) 495000 ± 269640 369000 516870 ± 201640 486000 0,687
Folate serum (µg / l 5,02 ± 2,63 3,8 7,00 ± 2,99 6,0 0,003
Serum ferritin (µg / l) 112,30 ± 95,40 82,7 179,67 ± 144,77 110 0,022
p= significant value; sd= standart desviation; variables with normal distribution were compared using Student t test; variables with no normal distribution were compared by Wilcoxon-Mann-Whitney test (*)
years. Based on the results obtained here we believe that preventive hematological testing is important in old people, as anemia may represent a signal for disease, even in asymptomatic people.
Serum measurements of vitamin B12 in young adults and apparently healthy elderly subjects were not statistically different. Some considerations must be made:
1. pernicious anemia has a genetic predisposition and is more prevalent in European and North American people. Since the population studied is ethnically mixed all samples present with Caucasian phenotypes. For this reason we can not study genetic predisposition.
2. the rigorous criteria used for selection certainly contributed to excluding this pathology.
3. the elderly included in the study participate in a socially active group, automatically excluding individuals with possible B12 related neurological disease.
4. as we assessed vitamin B12 by the immunological assay Elisa, which has well-known limitations, a normal result does not exclude the possibility of a real deficit.
Serum levels of B12 diminish with aging, while serum concentrations of methylmalonic acid increase. Subnormal concentrations were detected in old people in 3% to 40%, depending on the diagnostic criteria used. Probably the lower reference values used to define B12 deficiency are in fact too low, underestimating the real frequency of this deficiency in the old population. It was seen that in 40% of elderly individuals with normal but near lower reference values of B12, methyl-malonic acid was elevated.
We found higher mean serum levels of folic acid in apparently healthy elderly than in the young adult group. This was somewhat expected, since the studied group was composed of socially active individuals without symptomatic disease. In general, folic acid deficiency in the aged is associated with institutionalization, disease, alcoholism and feeding difficulties. The majority of the literature reviewed reported similar findings.
We found significantly higher mean values of serum ferritin in apparently healthy elderly in comparison to the young adult group. Some factors influencing ferritin levels are the presence of chronic disease (inflammation, infection, neoplasia), hepatic disease and genetic predisposition (hemochromatosis). In our study the exclusion of these factors was only clinical, without laboratory testing. The low incidence of iron deficiency could be attributed to the good nutritional status of the subjects and/or to the adequate selection of healthy elderly. A tendency to store iron with aging may be possible.
Table 4. Nutritional indicators comparison between apparently health elderly (HE) and another elderly (DE) participant of Projet Gravataí
Nutrients Groups Mean ±sd Minimun Maximun p WHO
Calories (Kg) HE
DE Total 1467,4 1531,8 1527,5 428,6 538,6 531,5 852,0 212,0 212,0 2425,4 3383,7 3383,7 0,584 Lower Lower Lower
Carbohydrates % HE
DE Total 52,4 53,3 53,2 9,5 10,4 10,3 36,7 23,4 23,4 71,0 86,4 86,4 0,718 Lower Lower Lower
Proteins % HE
DE Total 20,9 19,3 19,4 4,6 5,6 5,5 11,6 6,9 6,9 31,7 43,9 43,9 0,186 Higher Higher Higher
Lipids % HE
DE Total 25,7 26,6 26,6 7,5 8,3 8,3 11,7 2,7 2,7 36,1 54,1 54,1 0,597 Recommend Recommend Recommend
Vitamin C (mg) HE
DE Total 130,0 115,5 116,4 116,7 101,4 102,4 2,2 0,0 0,0 398,7 548,1 548,1 0,520 Higher Higher Higher
Folate (µg) HE
DE Total 256,2 284,5 282,6 145,8 272,2 265,5 35,7 10,1 10,1 561,3 4112,9 4112,9 0,630 Lower Lower Lower
Vitamin B12 (µg) HE
DE Total 10,1 5,5 5,8 30,5 20,4 21,2 0,8 0,1 0,1 146,2 287,8 287,8 0,334 Higher Higher Higher
Vitamin D (µg) HE
DE Total 2,3 2,5 2,5 2,0 2,0 2,0 0,0 0,0 0,0 8,7 18,1 18,1 0,671 Lower Lower Lower
Vitamin B6 (mg) HE
DE Total 1,4 1,4 1,4 0,8 0,8 0,8 0,3 0,1 0,1 3,0 6,2 6,2 0,903 Lower Lower Lowerr
Vitamin A (µg) HE
DE Total 1285,4 863,0 891,5 3456,2 2493,2 2564,8 30,9 3,6 3,6 16576,7 32521,9 32521,9 0,457 Higher Higher Higher
Vitamin E (mg) HE
DE Total 6,0 9,6 9,4 3,4 9,2 8,9 1,8 0,4 0,4 14,1 42,9 42,9 0,063 Lower Lower Lowerr
Calcium (mg) HE 593,0
563,0 565,0 313,6 334,3 332,5 154,1 60,8 60,8 1351,3 2910,5 2910,5 0,684 Lower Lower Lower
Iron (mg) HE 12,4
12,6 12,6 5,7 6,1 6,1 2,1 1,2 1,2 25,7 43,3 43,3 0,859 Higher Higher Higher sd=Standard deviation; p= significance value obtained by Student t test compassion. WHO= World Health Organization
showed significant differences in MCV, MCHC and RDW, with MCV and RDW being higher in the aged. Nilsson-Ehle
et al.17 also found a tendency towards higher mean values of
CMV with increasing age in a longitudinal study. The fact that MCV values did not vary significantly between the anemic and non-anemic elderly supports the hypothesis that this is related to aging per se.
We found no difference between total and differential counts of white blood cells of young adults and apparently healthy elderly individuals. Statistically the eosinophil count was different but this did not have clinical significance and so it was not identified as an aging-related hematological abnormality. Corberand et al.22 stated that differences in white
Fleming et al.23 analyzed iron deposits in a group of
elderly with ages between 67 and 96 years old, survivors of the original Framingham study cohort, with emphasis on the differential diagnosis of anemia in chronic diseases. They measured reactive protein C (to exclude inflammatory disease), alkaline phosphatase and transaminases (to exclude hepatic disorders), white blood cell count and differential (to exclude infection) and clinical analysis to discard neoplasia. They interpreted high levels of transferring saturation, ferritin and total serum iron as possible associations with hemochromatosis genes, but confirmatory exams were not performed. The results of this study were: low frequency of iron deficiency and a higher prevalence of high iron deposits rather than deficiency. The causes were ignored, but the role of diet must be better investigated for possible subclinical inflammatory conditions. There are a few studies about iron deposits in the old, showing similar results. Until now, the real situation of iron status in the elderly is difficult to determine due to the high prevalence of chronic diseases. In our study the quantities of iron, protein and vitamin B12 ingestion by apparently healthy elderly subjects were higher than those recommended by World Health Organization, results that are similar to other reports on the aged. There are questions about the necessity of increasing the quantity considered adequate for old people, since the catabolism rate increases in this group.
A comparison of anemic and non-anemic apparently healthy elderly showed a significantly lower level of vitamin B12 in the first group. This finding agrees with the high prevalence of subclinical deficiency of this vitamin reported in the literature.
The comparison of nutritional indicators between the apparently healthy elderly and the other elderly did not show differences, suggesting that the diet did not play an important role in determining health status in this setting.
We found in both groups, ingestion below the recommended quantities for several macro and micro nutrients. A previous study described the nutritional characteristics of these elderly and compared them with similar studies in diverse countries. The analysis suggested similar ingestion of B12, folate and iron as elderly living in Bangkok,24
Atlanta,25 Costa Rica,26 Germany27 and France.28 The
low ingestion of calories, high ingestion of proteins and adequate ingestion of lipids were also reported in other studies. Since the elderly investigated were of a lower education level, this could be related to a lack of information.
Although the study described here presents some limitations, the data obtained suggest that there are some differential hematological parameters in elderly individuals that may be biological aging associated. Whether these modifications are clinical consequences need to be tested in future studies.
Resumo
Foi realizado um estudo não probabilístico em idosos que vivem na comunidade. A primeira análise teve um delineamento transversal e análises adicionais um delineamento caso-controle. Na primeira análise foram incluídos 745 indivíduos. Análises adicionais foram feitas em 46 idosos saudáveis (HE) e em 33 adultos jovens (YA) incluindo: análises clínicas, hematológicas e bioquímicas, recor-datório nutricional de 24 horas e questionário de freqüência dietética. Os idosos saudáveis foram selecionados através do uso do proto-colo Seniour. Para evitar viés de seleção na amostra HE, uma análise adicional comparando variáveis culturais, socioeconômicas e saúde com a dos idosos não selecionados (DE). A prevalência de HE foi de 17% (n=46) sendo que, entre estes, 4,3% estavam anêmi-cos. Não ocorreram diferenças estatísticas de hematócrito, hemoglobina, leucócitos, neutrófilos e vitamina B12 entre os grupos AHEe YA. Níveis médios de MCV, RDW, eosinofilos folato and ferritina foram mais altos no grupo AHE do que no YA. Ao contrário, as plaquetas foram mais altas no grupo YA. Não ocorreram diferen-ças significativas entre os grupos AHE e DE quando os indicadores nutricionais foram comparados. A comparação entre indicadore nutricionais de idosos anêmicos e não-anêmicos em idosos aparen-temente saudáveis mostrou diferenças significativas na ingestão de vitamina B12 e de proteína, que foi mais baixa nos idosos anêmicos. Os resultados sugerem diferenças biológicas independentes entre Table 5. Comparison of hematological and nutritional indications between apparently
health elderly with anemia and without anemia
Nutritional variables Groups Mean ± dp p
Hematological
B12 values Anemia Normal
1,50 1,98
0,71 0,12
0,000
Folate Anemia
Normal
8,85 6,17
3,75 2,99
0,218
Ferritin Anemia Normal
264,0 147,6
207,9 132,6
0,231
VCM Anemia
Normal
87,50 89,7
2,121 4,49
0,489
Leucocytes Anemia Normal
8000,00 6.686,31
8485,280 1.582,613
0,249
Diet
Calories (Kg) Anemia Normal
1.730,0000 1.407,5839
0,00000 949,93717
0,638
Carbohydrates (%) Anemia Normal
46,8800 111,5989
0,00000 298,55744
0,764
Protein (%) Anemia Normal
13,2800 22,3078
0,00000 11,86670
0,000
Lipids (%) Anemia Normal
39,8400 57,0353
0,00000 58,75962
0,685
Vitamin B12 ( g) Anemia Normal
1,8900 29,1828
0,00000 128,74656
0,769
Iron (mg) Anemia Normal
8,9900 9,4311
0,00000 5,03356
0,903
Folate (µg) Anemia Normal
272,0400 388,2811
0,00000 364,97801
os parâmetros hematológicos de idosos e jovens. Rev. bras. hematol. hemoter. 2007;29(2):136-143.
Palavras-chave: Envelhecimento saudável; envelhecimento hemato-lógico; nutrição; anemia; idoso saudável.
Acknowledgments
The authors would like to acknowledge the technical assistance of Ingrid Manfredi (Office for Social Care) and the data collection assistance made by Josiane Siviero, Gislaine Astir Flores, Maristela Taufer and Alexandre Manica da Cruz. We are also grateful to the City Hall of Gravatai’ that set up special facilities for the recruitment of the elderly subjects enrolled in this study. The work presented in this manuscript was supported by grants from Fapergs (M.E.B., Proc. 00/(M.E.B., Proc. 00/0168.9) and CNPq (M.E.B., Proc. 551180/ 01-3; M.E.B. Proc. 400195/199-2
References
1. Balducci L, Hardy CL, Lyman GH. Hemopoiesis and aging. Cancer Treat Res. 2005;124:109-34.
2.Berkahn L, Keating A. Hematopoiesis in the elderly. Hematology. 2004;9(3):159-63.
3. BB. Dallman PR. Prevalence and causes of anemia in tne United States, 1976 to 1980. Am J Clin Nutr. 1984;39:437-45.
4. Linton PJ, Dorshkind K. Age-related changes in lymphocyte development and function. Nat Immunol. 2004;5:133-9. 5. Cruz IBM, Schwanke CH, Flores GLS, Sivieiro J, Cruz AAM, Cruz
BAMP, Moriguchi EH. Projeto Gravataí um estudo longitudinal e interdisciplinar sobre o envelhecimento: descrição da escolha do município. Revista de Medicina da PUC/RS. 2003;13:383-92.
6. Flores GAL, Cru AAM, Taufer M, Sivieiro J, Nascimento NMR, Canto MEP, et al. Indicadores de saúde dos idosos participantes do Projeto Gravataí. Revista de Medicina da PUC/RS. 2003;13: 393-9.
7. Luz C, Dornelles F, Preissler T, Collaziol D, Cruz I, Bauer ME. Impact of psychological and endocrine factors on cytokine production of healthy elderly people. Mech Ageing Dev. 2003; 124:887-95.
8. Olivares M, Hertrampf E, Wegner D, Capurro MT, Letelier A, Valenzuela E. Normal values of the hemogram and other hematological variables in subjects over 60 years old. Rev Med Chil. 1994;122:1289-93.
9. Siviero J, Schwanke CH, Bruscato N, Carvalho D, Nascimento JC, Cruz IBM. Ingestão regular de frutas e sua associação com indica-dores de saúde e de nutrição em idosos participantes do Projeto Gravataí. Revista de Medicina da PUC/RS. 2003;13:412-18. 10. Fried L. Epidemiology of Aging. Epidemiology Review.s 2000;
22:95-106.
11. Katz S, Downs TD, Cash HR. Progress in Development of the Index of ADL. The Gerontologist. 1970;20-30.
12. Lawton MP. The Philadelphia Geriatric Center Morale Scale: A revision. J Gerontology. 1975;30-1:85-9.
13. Reuben DB, Greendale GA, Harrison GG. Nutrition Screening in Older Persons. Journal of the American Geriatric Society. 1995; 43:415-25.
14. EE. Blain H. Determination by flow cytometry of reference values of erythrocyte parameters in aged subjects. Presse Med. 2001; 30:779-84.
15. GG. Takubo T. Reference values for hematologic laboratory tests and hematologic disorders in the aged. Rinsho Byori. 2000;48:207-16. 16. SPSS Version 11.0 for Windows, 2000.
17. Nilsson-Ehle H, Landahl S, Lindstedt G, Netterblad L, Stockbruegger R, Westin J, et al. Low serum cobalamin levels in a population study of 70- and 75-year-old subjects. Gastrointestinal causes and hematological effects. Dig Dis Sci. 1989;34:716-23.
18. Yamada M, Wong FL, Suzuki G; RERF's (Radiation Effects Research Foundation) Adult Health Study. Longitudinal trends of hemoglobin levels in a Japanese population--RERF's Adult Health Study subjects. Eur J Haematol. 2003;70(3):129-35.
19. Weggemans RM, de Groot LC, Haller J. Factors related to plasma folate and vitamin B12. The Seneca study. Int J Food Sci Nutr. 1997;48(2):141-50.
20. de Groot CP, van Staveren WA; Survey in Europe on Nutrition and the Elderly, a Concerted Action. Undernutrition in the European SENECA studies. Clin Geriatr Med. 2002;18(4):699-708, vi. 21. Izaks GJ, van Houwelingen HC, Schreuder GM, Ligthart GJ. The
association between human leucocyte antigens (HLA) and mortality in community residents aged 85 and older. Am Geriatr Soc. 1997;45(1):56-60.
22. Corberand J, Laharrague P, Fillola G. Blood cell parameters do not change during physiological human ageing. Gerontology 1987; 33(2):72-6.
23. Fleming DJ, Jacques PF, Tucker KL, Massaro JM, D'Agostino RB Sr, Wilson PW, Wood RJ. Iron status of the free-living, elderly Framingham Heart Study cohort: an iron-replete population with a high prevalence of elevated iron stores. Am J Clin Nutr. 2001 Mar;73(3):638-46.
24. Tanphaichitr V, Senachack P, Nopchinda S, Leelahagul P, Pakpeankitvatana R. Global assessment of nutrition risk factors in the elderly. Southeast Asian J Trop Med Public Health. 1997;28 Suppl 2:94-9.
25. McCullough ML, Feskanich D, Stampfer MJ, Giovannucci EL, Rimm EB, Hu FB, et al. Diet quality and major chronic disease risk in men and women: moving toward improved dietary guidance. Am J Clin Nutr. 2002;76(6):1261-71.
26. Satia JA, Patterson RE, Herrero R, Jin F, Dai Q, King IB, et al. Study of diet, biomarkers and cancer risk in the United States, China and Costa Rica. Int J Cancer. 1999;82(1):28-32
27. Bates CJ, Benton D, Biesalski HK, Staehelin HB, van Staveren W, Stehle P, et al. Nutrition and aging: a consensus statement. J Nutr Health Aging. 2002;6(2):103-16
28. Raynaud-Simon A, Lesourd B. Malnutrition in the elderly. Clinical consequences. Presse Med. 2000;29(39):2183-90.
Avaliação: Editor e dois revisores externos Conflito de interesse: não declarado
Recebido: 07/02/2006