ABSTRACT:Objectives: The study aimed at evaluating the contextual efects of social vulnerability over anthropometric indexes related to global and central obesity in adults living in Ribeirão Preto (SP), Brazil, in 2006.
Methods: In a population-based cross-sectional study using multistage sampling, multilevel linear models were applied considering two levels: ecological and individual. The 81 census tracts drafted for sample composition were considered the ecological level and classiied according to Paulista Social Vulnerability Index (IPVS). Results:
Individual correlates to body mass index (BMI) were age, familial and personal antecedents of overweight, and total fat consumption (direct relationship), exception to gender and schooling (inverse relationship). Individual correlates to waist circumference were age, familial antecedents of stroke, personal antecedent of overweight, BMI, number of medicines taken, time of smoking, and diet total energy (direct relationship), exception to gender (inverse relationship). Considering both outcomes (BMI and waist circumference), in the inal models, the variance of IPVS showed statistical signiicance (p < 0.05), depicting the contextual efect (rho ≈ 8%) over global and central obesity, even after the adjustment for individual correlates. Conclusion: Results showed that interventions to promote healthy behaviors and to prevent obesity might be focused not only on individual factors but also on socioenvironmental context in which people are inserted.
Keywords: Social vulnerability. Anthropometry. Body mass index. Waist circumference. Contextual efect. Multilevel analysis. Cross-sectional studies.
Social vulnerability efect over obesity
anthropometric indexes: results from
population-based epidemiological study
O efeito da vulnerabilidade social sobre indicadores antropométricos
de obesidade: resultados de estudo epidemiológico de base populacional
Isabel Cristina Martins de FreitasI, Suzana Alves de MoraesII
ORIGINAL ARTICLE / ARTIGO ORIGINAL
IPostdoctoral Program in Epidemiology. School of Nursing of Ribeirão Preto, Universidade de São Paulo. Epidemiology Center – Ribeirão Preto (SP), Brazil.
IIMaternal, Child and Public Health Department. School of Nursing of Ribeirão Preto, Universidade de São Paulo. Epidemiology Center – Ribeirão Preto (SP), Brazil.
Corresponding author: Isabel Cristina Martins de Freitas. Universidade de São Paulo. Escola de Enfermagem de Ribeirão Preto. Núcleo de Epidemiologia. Avenida Bandeirantes, 3900, Vila Monte Alegre, CEP: 14040-902, Ribeirão Preto, SP, Brasil. E-mail: [email protected].
Conlict of interests: nothing to declare – Financial Support:Conselho Nacional de Desenvolvimento Cientíico e Tecnológico (CNPq) –
INTRODUCTION
In general, the epidemiological and nutritional proile of modern societies is a result of complex and progressive changes in their patterns of morbidity, mortality and fertility (Epidemiological Transition), with the consequent restructuring over the centuries of their age proile (Demographic Transition), their diferent dietary habits (Nutritional Transition), alongside their environmental, socioeconomic, and lifestyle determinants1,2.
Obesity, similar to other chronic diseases, is a multifactorial disease whose origin involves environmental, genetic, biological, and behavioral factors. In developing countries, the emergence of obesity initially afected the highest socioeconomic strata of the population. However, recent trends reveal a diferent pattern, as its prevalence has shifted to the lower strata of income and education2,3.
McLaren4,in a literature review study, compiled results from cross-sectional studies that
investigated the association between socioeconomic status (SES) and overweight. In this study, the SES comprised eight indicators: income, educational level, occupation, employ-ment status, consumer goods, social class, and neighborhood context; host countries were classiied according to the Human Development Index (HDI) into three levels: high, medium, and low. A total of 1,994 associations were examined and the results showed that 71% of them were reversed among women in high-HDI countries, especially when the SES was
RESUMO:Objetivo: O estudo teve por objetivo avaliar o efeito da vulnerabilidade social sobre os indicadores antropométricos de obesidade global e central em adultos (30 anos ou mais) de Ribeirão Preto (SP), 2006.
Métodos: Estudo transversal de base populacional com amostra complexa, desenvolvida em três estágios. Modelos lineares multinível foramconstruídos em dois níveis: ecológico e individual. Os 81 setores censitários sorteados para a amostra compuseram o nível ecológico e foram classiicados segundo o Índice Paulista de Vulnerabilidade Social (IPVS). Resultados: Fatores de nível individual que apresentaram relação direta com o índice de massa corporal (IMC): idade, antecedentes familiares e pessoais de excesso de peso e consumo de lipídios, com exceção de sexo e escolaridade (relação inversa). Fatores de nível individual que apresentaram relação direta com a circunferência da cintura (Ccint): idade, antecedentes familiares de acidente vascular cerebral (AVC), história pessoal de excesso de peso, IMC, número de medicamentos, tempo de tabagismo e energia total da dieta, com exceção da variável sexo (relação inversa). Para ambos os desfechos (IMC e Ccint), a variância do IPVS nos modelos inais apresentou signiicância estatística (p < 0,05) revelando o efeito contextual (rho ≈ 8%) da vulnerabilidade social sobre os indicadores de obesidade, mesmo após ajustamento para variáveis de nível individual. Conclusão: Os achados apontam para a necessidade de ações de promoção de hábitos saudáveis e de prevenção da obesidade, direcionadas não apenas aos fatores de nível individual, mas ao contexto socioambiental onde os indivíduos estão inseridos.
evaluated from the occupation, educational level, or neighborhood contexts. Among males, inverse associations were detected in 37% of studies.
In the last decades, some studies aimed at investigating the determinants of positive energy balance beyond the purely individual dimension5-7. However, studies investigating the
environmental characteristics in determining the overall or central obesity are still scarce, and eforts to understand the contextual efects are incipient.
Characteristics of particular region or neighborhood, such as the availability of green areas, large supermarket chains, or architectural features, have been identiied as associated with overweight in studies of mixed efects, both in developed and in developing countries. Many researchers have endeavored to evaluate the context efect on obesity, facing meth-odological limitations mainly related to the concept and deinition of “neighborhood,” the selection of its attributes that are worth investigating, and the adoption of the most appro-priate strategy to measure them. Identifying how the social-environmental context inlu-ences the behavior of individuals or population subgroups, taking them to diferent levels of exposure to risk and protection factors for chronic outcomes, may be a major contribu-tion to the planning of future intervencontribu-tions, as it allows applying efective measures and greater coverage in the prevention and control of obesity8.
Within this perspective, this study aimed at evaluating the efect of social vulnerability on anthropometric indicators of global and central obesity, and to identify individual factors associated with the outcome in the adult population of Ribeirão Preto (SP).
METHODS
STUDY DESIGN AND SAMPLING PROCESS
This study is a subproject derived from OBEDIARP Project, which is a cross-sectional population-based study, entitled “Risk factors for overweight, obesity and diabetes melli-tus in adults living in Ribeirão Preto, SP-2006.” The target population consisted of indi-viduals aged 30 years and over living in Ribeirão Preto (SP), in which a cluster sample developed in three stages was selected. The census tract9,10 was the primary sampling
unit, and domiciles and residents corresponded to randomly selected units in the sec-ond and third stages, respectively. Sample consisted of 930 adults, and variability (difer-ent stages of selection) was considered by assigning sample weights, thus originating a weighted sample (nw) of 2,197 participants. Sample weighting details can be found in a previous publication11.
Data were collected at participant’s home by pairs of previously trained and “calibrated”12
interviewers. Data quality was evaluated by the replication of 12.5% of the interviews, applying the Kappa statistic for all the questions of the replication.
with accuracy of one millimeter. The measurement techniques followed the recommen-dations of Lohman et al.13.
STUDY VARIABLES
Dependent variables
BMI14, overall index of obesity, which is obtained by calculating: and
Ccint, central obesity index, measured at the anatomical site (lesser curvature) located between the costal margin and the iliac crest13.
Independent variable of ecological level
IPVS15, designed and calculated by the Fundação Sistema Estadual de Análise de Dados
(SEADE) for all census tracts of the 645 municipalities in São Paulo State. Factor analysis with the inclusion of nine variables (ive for the socioeconomic and four for demographic dimension) enabled the linear combination of these two dimensions, creating the IPVS indicator as constructo of social vulnerability, which was classiied into seven groups: 1 – extremely low; 2 – very low; 3 – low; 4 – medium; 5 – high; 6 – very high vulnerability and 7 – high vulnerability—the latter only applied for census tracts located in rural areas. In this study, social vulnerability variable was reclassiied into three categories: very low (irst and second groups), low (third group), and upper-middle vulnerability (fourth, ifth, and sixth groups).
The ecological level of this study was composed of 81 census tracts randomly selected in the irst phase of the sampling process.
Independent variables of individual level
The variables were grouped into diferent blocks, according to the conceptual model developed a priori16:
1. Block 1 – Demographic and socioeconomic characteristics: gender; age; educational level; working conditions (labor activity, with remuneration in cash, carried out in the seven days preceding the interview); individual income; marital status; and length of residence in the city.
2. Block 2 – Family background: presence of family history of stroke and/or
overweight.
4. Block 3B – Access to health services: use of outpatient services (public or private, in the last six months) and number of medicines taken in the 15 days preceding the interview).
5. Block 4 – Behavioral aspects: smoking time (in years, calculated for participants who self-reported being smokers or ex-smokers); alcohol dependence measured by the questionnaire AUDIT17,in which participants were divided into two categories:
“nondependent” and “dependent.”18 Metabolic waste (in Metabolic Equivalents
[METs]*minute*week1), and daily mean of sitting time, both measured by the
International Physical Activity Questionnaire (IPAQ) (short version)19. Participants
were asked whether they were engaged in a speciic diet to lose weight. With regard to the dietary pattern, a semiquantitative food frequency questionnaire containing 128 items20,21 with their respective portions and sizes was applied. Quantiication of
dietary nutrients was processed in NutWin software. In this study, total lipids (in grams) and total energy (in calories) were considered, in which the amount of lipids were adjusted for total energy of the diet22.
STATISTICAL ANALYSIS
In the descriptive phase, the municipality and the study population were characterized, and estimates were calculated by points and conidence intervals (95%CI). Linear trend tests were applied, adopting α = 0.05. At this phase, the variable BMI was considered as an adjustment variable for the central obesity index (Ccint) and categorized according to the
cutofs recommended by the World Health Organization (WHO)14.
In the analytical phase, adherence tests to the normal distribution were performed for BMI and Ccint variables. Multicollinearity was evaluated by the correlation matrix between independent variables. Multilevel Linear models23 with two levels were built,
obtaining measures of effect estimated by points and confidence intervals. All indepen-dent variables of the individual level that were classified in more than two categories were treated as dummy, and the numerical variables were centralized24 and treated as
ETHICAL CONSIDERATIONS
The OBEDIARP project was approved in 2005 by the Ethics Committee of the Escola de Enfermagem de Ribeirão Pr eto (CEP-EERP/USP no 0528/2005). All participants signed the
informed consent form, according to the recommendations of the Resolution 196/96 from the National Health Council (CNS).
RESULTS
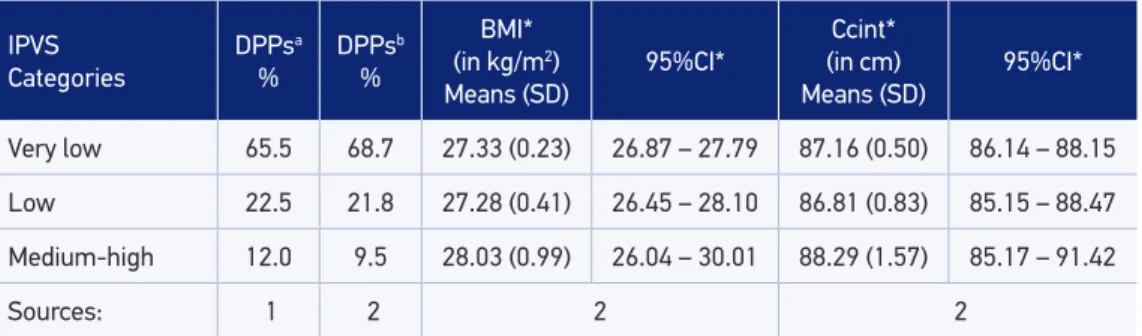
Table 1 shows the characteristics of the municipality of Ribeirão Preto based on the data extracted from the 2010 Census and from the OBEDIARP Project sample, as well as the outcome averages, according to IPVS categories. Noteworthy is the rep-resentativeness of the sample in relation to the 2010 Census. Highest BMI and Ccint means were observed among participants who were living in areas of medium or high social vulnerability.
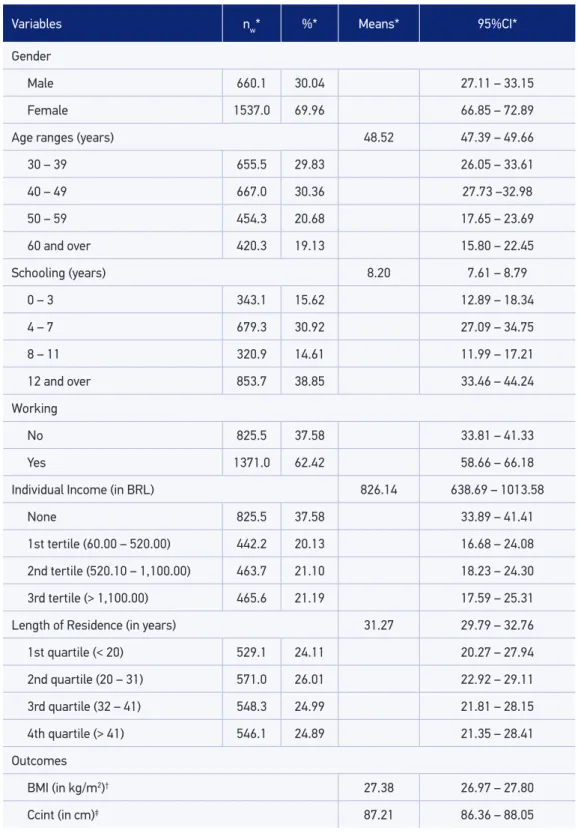
The main characteristics of the study population are presented in Table 2. With regard to age, 19.13% of the participants were elderly; 53% had eight or more years of schooling; 37.58% reported having no labor activity in the week prior to the interview; and the major-ity (76%) lived in Ribeirão Preto for at least 20 years. It is worth noting that BMI and Ccint means were higher than the respective cutof points for the classiication of global pre-obe-sity and central obepre-obe-sity.
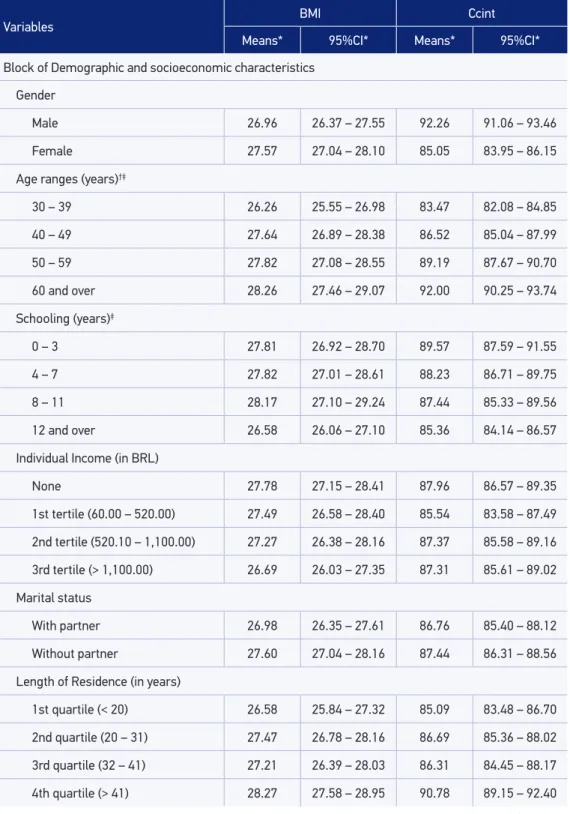
In Table 3, BMI and Ccint averages are presented with their respective conidence inter-vals in the categories of individual variables. For both indexes, a positive relation with age, length of residence in the city, family history of stroke, family and personal history of over-weight, number of medicines taken, daily means of sitting time, and adopting a diet to lose
Table 1. Characteristics of Ribeirão Preto city, according to data of the 2010 Census and sample of the OBEDIARP Project. Ribeirão Preto, SP, 2006.
IPVS Categories
DPPsa
%
DPPsb
%
BMI* (in kg/m2)
Means (SD) 95%CI*
Ccint* (in cm)
Means (SD) 95%CI*
Very low 65.5 68.7 27.33 (0.23) 26.87 – 27.79 87.16 (0.50) 86.14 – 88.15
Low 22.5 21.8 27.28 (0.41) 26.45 – 28.10 86.81 (0.83) 85.15 – 88.47
Medium-high 12.0 9.5 28.03 (0.99) 26.04 – 30.01 88.29 (1.57) 85.17 – 91.42
Sources: 1 2 2 2
a2010 Census; bSample of the OBEDIARP Project; *all estimates considered the design efect (def); DPP: private,
Table 2. Characteristics of the study sample. Ribeirão Preto, SP, 2006. OBEDIARP Project.
Variables nw* %* Means* 95%CI*
Gender
Male 660.1 30.04 27.11 – 33.15
Female 1537.0 69.96 66.85 – 72.89
Age ranges (years) 48.52 47.39 – 49.66
30 – 39 655.5 29.83 26.05 – 33.61
40 – 49 667.0 30.36 27.73 –32.98
50 – 59 454.3 20.68 17.65 – 23.69
60 and over 420.3 19.13 15.80 – 22.45
Schooling (years) 8.20 7.61 – 8.79
0 – 3 343.1 15.62 12.89 – 18.34
4 – 7 679.3 30.92 27.09 – 34.75
8 – 11 320.9 14.61 11.99 – 17.21
12 and over 853.7 38.85 33.46 – 44.24
Working
No 825.5 37.58 33.81 – 41.33
Yes 1371.0 62.42 58.66 – 66.18
Individual Income (in BRL) 826.14 638.69 – 1013.58
None 825.5 37.58 33.89 – 41.41
1st tertile (60.00 – 520.00) 442.2 20.13 16.68 – 24.08
2nd tertile (520.10 – 1,100.00) 463.7 21.10 18.23 – 24.30
3rd tertile (> 1,100.00) 465.6 21.19 17.59 – 25.31
Length of Residence (in years) 31.27 29.79 – 32.76
1st quartile (< 20) 529.1 24.11 20.27 – 27.94
2nd quartile (20 – 31) 571.0 26.01 22.92 – 29.11
3rd quartile (32 – 41) 548.3 24.99 21.81 – 28.15
4th quartile (> 41) 546.1 24.89 21.35 – 28.41
Outcomes
BMI (in kg/m2)† 27.38 26.97 – 27.80
Ccint (in cm)‡ 87.21 86.36 – 88.05
weight was observed. BMI and Ccint means showed a linear trend for the variables age and number of medicines taken.
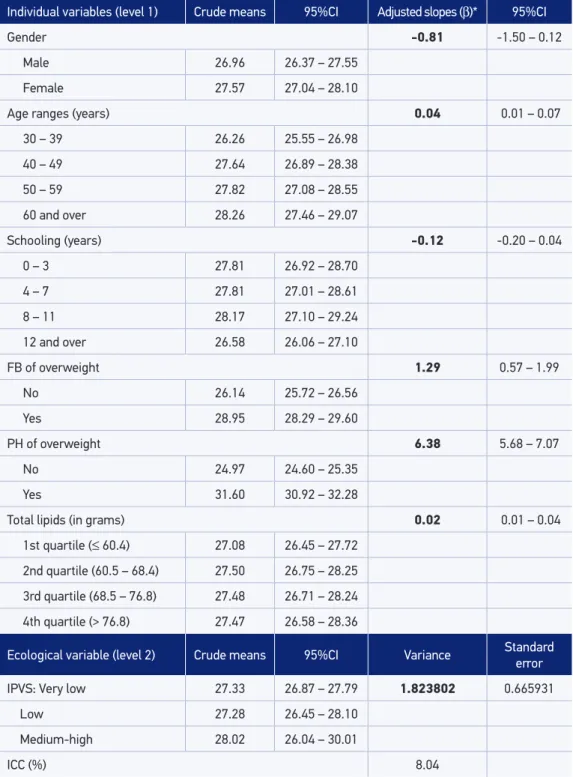
Variables that showed direct relationship with BMI (Table 4) were age, family and per-sonal history of overweight, and consumption of lipids, except for gender and schooling, which showed an inverse relation, being the variance of the IPVS statistically signiicant (p < 0.05) and ICC = 8.04%.
The set of variables associated with Ccint (Table 5) was composed of age, family his-tory of stroke, personal hishis-tory of overweight, BMI, number of medicines taken, smoking time and total energy of diet, all being directly related to the outcome, except for “gender” (inverse relationship). The variance of the IPVS was statistically signiicant (p < 0.05), and CCI was equivalent to 8%. The goodness of it of the inal models was conirmed by the residuals homoscedasticity (data not shown).
DISCUSSION
Multilevel analysis identified contribution equivalent to 8% (CCI) of the ecolog-ical level and significant variance of the variable “IPVS,” revealing contextual effect of social vulnerability on central and global obesity indexes, even after adjusting for individual variables. At this level, the variables associated with the two outcomes were gender (inverse relation), age, and personal history of overweight (direct relation). With regard to the variables related to the dietary pattern, the independent effect (direct relation) of fat intake and total dietary energy was identified for at least one of the obesity indexes.
The OBEDIARP Project was carried out using complex sample and its population pyramid was similar to those of the city of Ribeirão Preto, which reveals the representa-tiveness in relation to the reference population. The number of ecological units (n = 81), the average of observations per sector (n = 12), the high response rate (≈ 80%), and the selection of a single participant per household, reinforce the internal validity of the study and allow concluding that indings do not seem to have been caused by selection and/or information bias. In contrast, the training and the “calibration”12 of the team of
interview-ers, along with the replication of the interviews (kappa > 0.80), contributed to minimize measurement bias.
With regard to physical activity, its relationship with obesity remains controversial. Although the metabolic waste owing to physical activity is closely related to the mainte-nance of a healthy body weight, neighborhood context, in general, has modulated this relation8,25.In Ribeirão Preto, the nine municipal parks are concentrated in the central
Table 3. Body mass index and waist circumference means, with respective conidence intervals, according to the individual level variables. Ribeirão Preto, SP, 2006. OBEDIARP Project.
Variables BMI Ccint
Means* 95%CI* Means* 95%CI*
Block of Demographic and socioeconomic characteristics
Gender
Male 26.96 26.37 – 27.55 92.26 91.06 – 93.46
Female 27.57 27.04 – 28.10 85.05 83.95 – 86.15
Age ranges (years)†‡
30 – 39 26.26 25.55 – 26.98 83.47 82.08 – 84.85
40 – 49 27.64 26.89 – 28.38 86.52 85.04 – 87.99
50 – 59 27.82 27.08 – 28.55 89.19 87.67 – 90.70
60 and over 28.26 27.46 – 29.07 92.00 90.25 – 93.74
Schooling (years)‡
0 – 3 27.81 26.92 – 28.70 89.57 87.59 – 91.55
4 – 7 27.82 27.01 – 28.61 88.23 86.71 – 89.75
8 – 11 28.17 27.10 – 29.24 87.44 85.33 – 89.56
12 and over 26.58 26.06 – 27.10 85.36 84.14 – 86.57
Individual Income (in BRL)
None 27.78 27.15 – 28.41 87.96 86.57 – 89.35
1st tertile (60.00 – 520.00) 27.49 26.58 – 28.40 85.54 83.58 – 87.49
2nd tertile (520.10 – 1,100.00) 27.27 26.38 – 28.16 87.37 85.58 – 89.16
3rd tertile (> 1,100.00) 26.69 26.03 – 27.35 87.31 85.61 – 89.02
Marital status
With partner 26.98 26.35 – 27.61 86.76 85.40 – 88.12
Without partner 27.60 27.04 – 28.16 87.44 86.31 – 88.56
Length of Residence (in years)
1st quartile (< 20) 26.58 25.84 – 27.32 85.09 83.48 – 86.70
2nd quartile (20 – 31) 27.47 26.78 – 28.16 86.69 85.36 – 88.02
3rd quartile (32 – 41) 27.21 26.39 – 28.03 86.31 84.45 – 88.17
4th quartile (> 41) 28.27 27.58 – 28.95 90.78 89.15 – 92.40
Variables BMI Ccint
Means* 95%CI* Means* 95%CI*
Bock of family background
Stroke
No 27.03 26.51 – 27.55 86.50 85.38 – 87.62
Yes 28.04 27.30 – 28.78 88.59 87.01 – 90.18
Overweight
No 26.14 25.72 – 26.56 85.26 84.33 – 86.18
Yes 28.95 28.29 – 29.60 89.70 88.34 – 91.05
Block of Morbidity
Personal history of overweight
No 24.97 24.60 – 25.35 82.69 81.84 – 83.53
Yes 31.60 30.92 – 32.28 95.10 93.70 – 96.50
Block of access to health services
Used (in the last 6 months)
No 27.18 26.39 – 27.96 87.66 85.94 – 89.38
Yes 27.45 26.98 – 27.92 87.06 86.06 – 88.05
Number of medicines taken†‡
None 25.84 25.16 – 26.53 85.50 83.90 – 87.10
1 – 2 27.43 26.85 – 28.01 86.27 85.09 –87.45
3 or more 28.32 27.55 – 29.08 89.70 88.04 – 91.36
Block of behavioral variables
Smoking time (in years)
Non-smoker 27.50 26.92 – 28.09 86.28 84.96 – 87.59
1st tertile (1 – 12) 27.37 26.25 – 28.49 88.16 85.85 – 90.47
2nd tertile (12.1 – 25) 27.43 26.39 –28.46 87.37 85.25 – 89.49
3rd tertile (> 25) 26.90 25.95 – 27.85 89.59 87.55 – 91.63
Alcohol dependence
No (scores 0 – 7) 27.54 27.03 – 28.04 86.64 85.59 – 87.70
Yes (scores 8 – 40) 26.78 26.06 – 27.51 89.42 87.76 – 91.09
Table 3. Continuation.
Variables BMI Ccint
Means* 95%CI* Means* 95%CI*
Metabolic waste (METs*minute*week1)
≤ median (≤ 412.5) 27.17 26.60 – 27.73 86.77 85.55 – 87.98
> median (> 412.5) 27.60 27.07 – 28.13 87.64 86.57 – 88.70
Daily mean of sitting time (in min/day)‡
1st quartile (≤ 166.0) 26.73 25.81 – 27.66 85.57 83.74 – 87.41
2nd quartile (116.1 – 240.0) 27.57 26.83 – 28.32 87.40 85.90 – 88.89
3rd quartile (240.1 – 360.0) 27.55 26.77 – 28.32 87.15 85.57 – 88.73
4th quartile (> 360.0) 27.67 27.00 – 28.34 88.73 87.16 – 90.29
Diet to lose weight
No 27.15 26.71 – 27.59 86.61 85.67 – 87.54
Yes 28.72 27.81 – 29.62 91.06 89.21 – 92.90
Total lipids (in grams)
1st quartile (≤ 60.42) 27.08 26.45 – 27.72 89.10 87.69 – 90.50
2nd quartile (60.43 – 68.44) 27.50 26.75 – 28.35 86.70 85.11 – 88.28
3rd quartile (68.45 – 76.81) 27.48 26.71 – 28.24 86.45 84.71 – 88.20
4th quartile (> 76.81) 27.47 26.58 – 28.36 86.66 84.89 – 88.44
Total dietary energy (in kcal)
1st quartile (≤ 1,640.20) 27.90 27.16 – 28.64 86.85 85.29 – 88.41
2nd quartile (1,640.21 – 2,157.20) 27.82 26.97 – 28.67 86.79 85.10 – 88.48
3rd quartile (2,157.21 – 2,847.20) 26.88 26.01 – 27.75 86.57 84.64 – 88.50
4th quartile (> 2,847.20) 26.92 26.16 – 27.67 88.60 86.98 – 90.23
it is plausible to suppose that the efects may have been mitigated by the inluence of social vulnerability.
Among the indings in the literature, few studies26,27 hasconsidered the efect of
“fam-ily history of chronic events” on obesity and, when taken into account, its objectives only consisted in the investigation of individual-level determinants. Hajian-Tiaki and Heidari26
Table 3. Continuation.
*All estimates considered the design efect; †p-value < 0.05 for linear trend test – BMI ; ‡p-value < 0.05 for linear trend
Table 4. Crude means and adjusted slopes for the body mass index, with respective conidence intervals. Final model. Ribeirão Preto, SP, 2006. OBEDIARP Project.
Individual variables (level 1) Crude means 95%CI Adjusted slopes (β)* 95%CI
Gender -0.81 -1.50 – 0.12
Male 26.96 26.37 – 27.55
Female 27.57 27.04 – 28.10
Age ranges (years) 0.04 0.01 – 0.07
30 – 39 26.26 25.55 – 26.98
40 – 49 27.64 26.89 – 28.38
50 – 59 27.82 27.08 – 28.55
60 and over 28.26 27.46 – 29.07
Schooling (years) -0.12 -0.20 – 0.04
0 – 3 27.81 26.92 – 28.70
4 – 7 27.81 27.01 – 28.61
8 – 11 28.17 27.10 – 29.24
12 and over 26.58 26.06 – 27.10
FB of overweight 1.29 0.57 – 1.99
No 26.14 25.72 – 26.56
Yes 28.95 28.29 – 29.60
PH of overweight 6.38 5.68 – 7.07
No 24.97 24.60 – 25.35
Yes 31.60 30.92 – 32.28
Total lipids (in grams) 0.02 0.01 – 0.04
1st quartile (≤ 60.4) 27.08 26.45 – 27.72
2nd quartile (60.5 – 68.4) 27.50 26.75 – 28.25
3rd quartile (68.5 – 76.8) 27.48 26.71 – 28.24
4th quartile (> 76.8) 27.47 26.58 – 28.36
Ecological variable (level 2) Crude means 95%CI Variance Standard error
IPVS: Very low 27.33 26.87 – 27.79 1.823802 0.665931
Low 27.28 26.45 – 28.10
Medium-high 28.02 26.04 – 30.01
ICC (%) 8.04
*Adjusted for “Diet to lose weight”; FB: family background; PH: personal history; in bold: p-value < 0.05; IPVS: Índice
Table 5. Crude means and and adjusted slopes for the waist circumference, with respective conidence intervals. Final model. Ribeirão Preto, SP, 2006. OBEDIARP Project.
Individual variables (level 1) meansCrude 95%CI Adjusted slopes (β)* 95%CI
Gender -8.48 -9.24 – 7.72
Male 92.26 91.06 – 93.46
Female 85.05 83.95 – 86.15
Age ranges (years) 0.16 0.11 – 0.20
30 – 39 83.47 82.08 – 84.85
40 – 49 86.52 85.04 – 87.99
50 – 59 89.19 87.67 – 90.70
60 and over 92.00 90.25 – 93.74
FB of stroke 0.66 0.01 – 1.31
No 86.50 85.38 – 87.62
Yes 88.60 87.01 – 90.18
PH of overweight 2.17 0.07 – 4.27
No 82.69 81.84 – 83.54
Yes 95.10 93.70 – 96.51
Nutritional status 1.69 1.42 – 1.96
Normal weight 76.44 75.63 – 77.26
Pre-obese 88.82 88.09 – 89.55
Obese 101.18 99.81 – 102.53
Nº of medicines taken 0.22 0.04 – 0.39
None 85.50 83.90 – 87.10
1 – 2 86.27 85.09 – 87.45
3 or more 89.70 88.04 – 91.36
Smoking time 0.03 0.01 – 0.06
Non-smoker 86.28 84.96 – 87.59
1 – 12 years 88.16 85.85 – 90.47
12 – 25 years 87.37 85.25 – 89.49
> 25 years 89.59 87.55 – 91.63
Individual variables (level 1) meansCrude 95%CI Adjusted slopes (β)* 95%CI
Total dietary energy (in Kcal) 0.11 0.03 – 0.18
1st quartile (≤ 1,640) 86.85 85.29 – 88.41
2nd quartile (1,640.1 – 2,157) 86.79 85.10 – 88.48
3rd quartile (2,157.1 – 2,847) 86.57 84.64 – 88.50
4th quartile (> 2,847) 88.60 86.98 – 90.23
Ecological variable (level 2) meansCrude 95%CI Variance Standard error
IPVS: Very low 86.16 85.16 – 88.15 2.040663 0.6033421
Low 86.81 85.15 – 88.47
Medium-high 88.29 85.16 – 91.42
ICC (%) 7.94
carried out a study with 3,600 adults participants (aged 20 – 70 years) in four cities of the Mazandran province, Iran. Final models showed gender, marital status, and family history of obesity with statistically signiicant odds ratios for obesity, whereas educational level was identiied as a protective factor.
In Ribeirão Preto, the independent efect of variables “family history of overweight,” “family history of stroke,” and “personal history of overweight” on obesity indexes was detected. Future studies, preferably with longitudinal design, are necessary to verify the consistency of these associations.
Findings from diferent studies8,28 reinforce the association of central obesity with chronic
diseases. However, determinants of central obesity, which constitutes an intermediate event in relation to chronic non-communicable diseases and their complications (end-points), have been scarcely investigated.
Results of studies conducted on the basis of the European information Prospective Investigation into Cancer and Nutrition (EPIC)29,30, applying multilevel models, revealed
signiicant associations of lifestyle factors (smoking, alcohol consumption, and total dietary energy) in relation to Ccint. In this study, the independent efect of “smoking time” and “total dietary energy” on at least one of the two considered outcomes was clear.
In the literature of the last decade, environmental factors such as type and availabil-ity of food trade, settlement of urban space favorable to physical activities, among others, were identiied as determinants of overweight30,31,33. In addition to socioeconomic factors
and their relationship already well known in relation to obesity7,31,32, there is a consensus
Table 5. Continuation.
*Adjusted for “Diet to lose weight”; FB: family background; PH: personal history; in bold: p-value < 0.05; IPVS: Índice
that the neighborhood also has an important efect on obesity, since its characteristics can modulate the efect of individual-level determinants.
Despite several studies have pointed out, in the last two decades, that the urban environ-ment adversely afects the health of its inhabitants, not much is known about the mecha-nisms related to the combined action of the physical environment and social factors on the onset of ecological exposures that may generate inequalities in health status among difer-ent population groups30.
In Brazil, government policies that were focused on economic growth achieved the national targets to some extent; however, in general, they failed to extend its benefits to the most of the population, resulting in an economic growth model that is exclu-sionary and concentrator of wealth. In addition to the poverty of these populations, the prevailing social inequalities in urban areas resulted in a complex process of spatial segregation that helps to maintain the condition of poverty and promotes the diffusion of behaviors from the socialization processes in which certain values, objectives, and expectations are transmitted, and thus influence individual trajectories (determining or mediating them)15.
In general, the suburban areas of urban centers have deteriorated architectural standard, ofer few employment opportunities, concentrate the worst safety indicators, and have lim-ited availability of public spaces. Such characteristics may, among others, inluence the qual-ity of life of residents and their families. Living in spatially segregated environments pro-motes the formation of ghettos of families who share certain characteristics, which might make them more susceptible to adverse exposures over time8.
In Ribeirão Preto, census tracts that are classiied as presenting medium or high social vulnerability are located in the suburban areas of the municipality (data not shown), sug-gesting that the ongoing urban expansion process has “expelled” from the center low-in-come people and family arrangements most vulnerable. Similar results to those of this study were reported by other authors31-33.
Townshend and Lake34,in a review study, evaluated the efect of contextual obesogenic
environments on the positive energy balance. The main indings indicate that, with regard to dietary habits, the association of availability of unhealthy foods with overweight showed inconsistent results, whereas “neighborhoods of suburban locations with presence of eth-nic minorities” associated consistently and positively with obesity.
Results of studies carried out in the U.S. population identiied the neighborhood con-text efect by means of the associations of the ecological variables such as types of restau-rants35 and density of health food trade36 with nutritional status. In Ribeirão Preto, the
Most authors that included ecological variables related to dietary35,36 or physical
activ-ity patterns25,37 opted to evaluate the efect of these variables on the outcomes exclusively
(sociological fallacy), without considering individual determinants. In Ribeirão Preto, authors estimated the contribution of the neighborhood context to the outcomes, as well as identiied the individual factors independently associated with BMI and Ccint, without establishing hierarchy between the levels and considering the multidimensional aspects of the associations.
Among the limitations of the study, the cross-sectional design prevented a clear under-standing of the detected contextual efect, which could not be classiied as part of the causal network, since the ecological exposure (area of residence) was not prospectively evaluated. Within this perspective, simultaneous measurements of referred exposures and outcomes may have led to the reverse causality bias, the global association between “number of med-icines taken” and the two outcomes being one example.
Given the observed context efect (ICC ≈ 8%) and the magnitude of the variance attributed to social vulnerability, it is possible to conclude that regions of medium or high social vul-nerability can be deined as “dynamic components” or “exposure regulators”3 in
intercon-nected systems, thus modulating individual behavior and public policies related to preven-tion of obesity. Statistical models that estimate the extent to which individuals living in a particular neighborhood are submitted to similar exposures for certain outcomes, such as overweight, become essential to the development of eicient intervention strategies that can gradually cease to prioritize targeted interventions on changes that operate exclusively on the individual level38.
CONCLUSION
Considering the existence of the context efect, traditional measures of efects (clas-sic models) can lead to erroneous focus of intervention. Therefore, it is necessary to understand that individual efect measures along with the context efect provide addi-tional information that may assist in the combination of approaches focused on both the individuals and their contexts, when elaborating strategies of health promotion and prevention of obesity.
ACKNOWLEDGMENT
1. Omran AR. The epidemiologic transition in the Americas. Washington DC: Pan-American Health Organization/ The University of Maryland at College Park; 1996. 2. Caballero B, Popkin BM. Introduction. In: Caballero
B, Popkin BM, editors. The Nutrition Transition: Diet and Disease in the Developing World. London: Academic Press; 2002.
3. Huang TT, Drewnowski A, Kumanyika S, Glass TA. A systems-oriented multilevel framework for addressing obesity in the 21st century. Prev Chronic Dis 2009; 6(3): A82.
4. McLaren L. Socioeconomic status and obesity. Epidemiol Rev 2007; 29: 29-48.
5. Xu H, Short SE, Liu T. Dynamic relations between fast-food restaurant and body weight status: a longitudinal and multilevel analysis of Chinese adults. J Epidemiol Community Health 2013; 67(3): 271-9.
6. Sichieri R, Moura EC. Análise multinível das variações no índice de massa corporal entre adultos, Brasil, 2006. Rev Saúde Pública 2009; 43 Supl 2: 90-7.
7. Prince SA, Kristjansson EA, Russell K, Billette JM, Sawada MC, Ali A, et al. Relationships between neighborhoods, physical activity, and obesity: a multilevel analysis of a large Canadian city. Obesity (Silver Spring) 2012; 20(10): 2093-100.
8. Black JL, Macinko J. Neighborhoods and obesity. Nutr Rev 2008; 66(1): 2-20.
9. Instituto Brasileiro de Geograia e Estatística. Censo demográico 2010. Rio de Janeiro: IBGE; 2010. 10. Silva NN. Amostragem probabilística: um curso
introdutório. 2a ed. São Paulo: EDUSP; 2001. 11. Moraes SA, Freitas IC, Gimeno SG, Mondini L.
Prevalência de diabetes mellitus e identiicação de fatores associados em adultos residentes em área urbana de Ribeirão Preto, São Paulo, Brasil, 2006: Projeto OBEDIARP. Cad Saúde Pública 2010; 26(5): 929-41. 12. Castro V, Moraes SA, Freitas IC, Mondini L. Variabilidade
na aferição de medidas antropométricas: comparação de dois métodos estatísticos para avaliar a calibração de entrevistadores. Rev Bras Epidemiol 2008; 11(2): 278-86. 13. Lohman TG, Roche AF, Martorell R, editors.
Anthropometric standardization reference manual. Abridged edition. Champaign (IL): Human Kinetics Books; 1991.
14. World Health Organization. Obesity: preventing and managing the global epidemic. Report of a WHO Consultation. Geneva; 2000. (WHO - Technical Report Series, 894).
15. Fundação Sistema Estadual de Análise de Dados – SEADE. Índice Paulista de Vulnerabilidade Social. Metodologia. 2010. São Paulo; 2013.
16. Victora CG, Huttly SR, Fuchs SC, Olinto MT. The role of conceptual frameworks in epidemiological analysis: a hierarchical approach. Int J Epidemiol 1997; 26(1): 224-7.
17. Organización Mundial de la Salud. Cuestionario de identiicación de los transtornos debidos al consumo de alcohol – AUDIT, 2001.
18. Kypri K, McGee R, Saunders JB, Langley JD, Dean JI. Interpretation of items in the AUDIT questionnaire. Alcohol Alcohol 2002; 37(5): 465-7.
19. Craig CL, Marshall AL, Sjöström M, Bauman AE, Booth ML, Ainsworth BE, et al. International physical activity questionnaire: 12 country reliability and validity. Med Sci Sports Exerc 2003; 35(8): 1381-95.
20. Fornés NS, Martins IS, Velásquez-Melendez G, Latorre Mdo R. Escores de consumo alimentar e níveis lipêmicos em população de São Paulo, Brasil. Rev Saúde Pública 2002: 36(1); 12-8.
21. Fornés NS, Stringhini ML, Elias BM. Reproducibility and validity of a food-frequency questionnaire for use among low-income Brazilian workers. Public Health Nutr 2003; 6(8): 821-7.
22. Willett WC, Howe GR, Kushi LH. Adjustment for total energy intake in epidemiologic studies. Am J Clin Nutr 1997; 65 4 Suppl: 1220S-8S
23. Rabe-Hesketh S, Skrondal A. Multilevel and Longitudinal Modeling Using Stata. 1st ed. College Station (TX): Stata Press; 2005.
24. Hox JJ. Applied multilevel analysis. Amsterdam: TT-Publikaties; 1995.
25. Casagrande SS, Gittelsohn J, Zonderman AB, Evans MK, Gary-Webb TL. Association of walkability with obesity in Baltimore City, Maryland. Am J Public Health 2011; 101 Suppl 1: S318-24.
26. Hajian-Tilaki KO, Heidari B. Prevalence of obesity, central obesity and the associated factors in urban population aged 20-70 years, in the north of Iran: a population-based study and regression approach. Obes Rev 2007; 8(1): 3-10.
27. van der Sande MA, Walraven GE, Milligan PJ, Banya WA, Ceesay SM, Nyan AO, et al. Antecedentes familiares: una oportunidad para intervenir precozmente y mejorar el control de la hipertensión, la obesidad y la diabetes. Boletín de la Organización Mundial de la Salud 2001; 5: 34-40.
28. Fletcher GF. Central obesity – more weight in cardiovascular disease prevention. Am J Cardiol 2009; 103(10): 1408-10.
29. Hermann S, Rohrmann S, Linseisen J, May AM, Kunst A, Besson H, et al. The association of education with body mass index and waist circumference in the EPIC-PANACEA study. BMC Public Health 2011; 11: 169. 30. Travier N, Agudo A, May AM, Gonzalez C, Luan
J, Besson H, et al. Smoking and body fatness measurements: a cross-sectional analysis in the EPIC-PANACEA study. Prev Med 2009; 49(5): 365-73. 31. de Moraes SA, Humberto JS, de Freitas IC. Estado
nutricional e fatores sociodemográicos em adultos residentes em Ribeirão Preto, SP, 2006. Projeto OBEDIARP. Rev Bras Epidemiol 2011; 14(4): 662-76. 32. Jones-Smith JC, Gordon-Larsen P, Siddiqi A, Popkin
BM. Cross-national comparisons of time trends in overweight inequality by socioeconomic status among women using repeated cross-sectional surveys from 37 developing countries, 1989-2007. Am J Epidemiol 2011; 173(6): 667-75.
33. Lopez R. urban sprawl and risk for being overweight or obese. Am J Public Health 2004; 94(9): 1574-9.
34. Townshend T, Lake AA. Obesogenic urban form: theory, policy and practice. Health Place 2009; 15(4): 909-16.
35. Mehta NK, Chang VW. Weight status and restaurant availability: a multilevel analysis. Am J Prev Med 2008; 34(2): 127-33.
36. Rundle A, Neckerman KM, Freeman L, Lovasi GS, Purciel M, Quinn J, et al. Neighborhood food environment and walkability predict obesity in New York City. Environ Health Perspect 2009; 117(3): 442-7. 37. Brown BB, Yamada I, Smith KR, Zick CD, Kowaleski-Jones L, Fan JX. Mixed land use and walkability: Variations in land use measures and relationships with BMI, overweight, and obesity. Health Place 2009; 15(4): 1130-41.
38. Merlo J. Multilevel analytical approaches in social epidemiology: measures of health variation compared with traditional measures of association. J Epidemiol Community Health 2003; 57(8): 550-2.
Received on: 09/30/2014