doi: 10.1590/0101-7438.2017.037.01.0001
UNDERSTANDING THE ROLE OF OR/MS IN THE STRATEGIC DECISIONS OF COLOMBIAN ORGANISATIONS – AN EXPLORATORY STUDY
Felipe Henao
1*, Juli´an Benavides
1, Harrison Sandoval
1,
Cristian Trejos
2and Frances A. O’Brien
3Received October 18, 2016 / Accepted December 28, 2016
ABSTRACT.Operational Research & Management Science has been defined as the field that provides analytical methodologies to make better decisions. It offers an ample set of tools to facilitate the analysis of complex organisational issues and enlighten decision-making. Nonetheless, it has also been argued that the role it actually plays for corporate strategic decisions is not as key as one would expect it. This article aims at exploring the role that OR/MS plays at the corporate level of a sample of Colombian organisations. To this end, primary information was collected through an online survey that sought to identify the various types of problems they commonly face, the tools mostly employed, and the processes they normally follow. The results suggest limited use of tools at the corporate level of the organisations surveyed. We conclude the paper with some reflections and recommendations for reversing this situation that are worthy of further research.
Keywords: strategic decision making, OR practice, survey.
1 INTRODUCTION
One of the key success factors for modern organisations lies in their decision-making process (Nutt, 2002). That is, the steps they take to systematically study problematic situations, evaluate possible solutions, and make effective decisions (Hammond, Keeney & Raiffa, 1999; Blenko, Mankins & Rogers, 2010). Decision-making is the process of analysis and logical choice through which alternatives or options are evaluated in the light of their expected future performance, risks associated with uncertainties, and preferences of the decision makers (Hammond et al., 1999). This definition sounds simple, but in reality it is a complex activity that entails the consideration of multiple factors, such as competition, rapid changes in technology, volatility and uncertainty of markets, cultural, political and societal elements, and even potential psychological pitfalls that
*Corresponding author.
1Universidad Icesi, Facultad de Ciencias Administrativas y Econ´omicas, Calle 18 N. 122-135, Cali, Colombia. E-mails: [email protected]; [email protected]; [email protected]
can cloud the objectivity of the decision-maker (Tversky & Kahneman, 1974; Mentzas, 1996; Kerr, MacCoun & Kramer, 1996; Kahneman & Tversky, 2000; Sadovykh et al., 2015).
Those working in the field of Operational Research & Management Science (OR/MS), aware that human beings need assistance to systematically analyse complex decision problems, have created over the last 70 years an extensive arsenal of prescriptive tools to facilitate problem modelling and decision-making (Bowen, 2004; Vidal, 2006). OR/MS offers quantitative as well as qualitative approaches that have proved to be useful at addressing organisational situations that are characterized by ambiguity, uncertainty, and multiple objectives, constraints and stakeholders with conflicting interests (e.g., Rosenhead, 1996; Fortuin & Zijlstra, 2000; Vidal, 2006). Despite its importance for our modern society and the current advances in the field of decision-making, research also suggests that the role that OR/MS actually plays at corporate strategic level is not as expected (Churchman & Schainblatt, 1965; Stenfors et al., 2007; O’Brien, 2011). Mingers (2015), for example, goes even further arguing that business schools in general have dif-ficulties when dealing with real-world problems, because they lack contact with external organi-sations, lack relevant corporate related research, and have outdated techniques, among others. In Colombia, OR/MS is not an unfamiliar topic. On the contrary, there is a significant number of higher education institutions (at least 38) accredited as high quality by the CNA (National Ac-creditation Council, an entity linked to the National Ministry of Education of Colombia), where OR/MS related courses are taught in different programmes at undergraduate and postgraduate levels. Additionally, there is an OR Society, named ASOCIO, which periodically brings together researchers to share their advances and experiences in different subjects within the field. There-fore, one would expect that OR/MS would have a leading role in Colombian organisations at the strategic and managerial levels.
Nevertheless, the role that OR/MS plays in the Colombian business sector, particularly at its strategic decision-making level, is unknown (i.e. it is unknown to what extent our graduates put into practice what they learned at university). The OR literature produced in Colombia mainly concentrates on reporting successful cases of application or theoretical developments, but not on analysing the impact of OR in the business sector. This shows a disconnection between academia and industry (White, Smith & Currie, 2011). Knowing the impact of OR in practice is essential if one wants to bring practical solutions to meaningful problems and contribute to advance theory (Mingers, 2015; Bornstein & Rosenhead, 1990; White et al., 2011).
To address this gap, this paper explores the actual role played by OR/MS in the strategic decision-making process within a sample of Colombian organisations. We follow the normative strategy process framework proposed by O’Brien & Dyson (2007), who divided the process into a num-ber of activities, in order to structure the study and investigate how different tools support the activities that strategic decision-making entails. To this end, an online survey was developed to identify the tools most commonly used for tackling various types of complex strategic decision problems and to unveil the steps typically followed when making important decisions.
Hence, this paper is organized as follows. In section 2 we review studies conducted in other countries that have a similar purpose as ours; we focus on the research approaches adopted and the types of questions asked. Then, in section 3 we describe our own research methodology. Section 4 shows the results obtained from the survey undertaken by a sample of Colombian organisations. Finally, in section 5 we present a discussion about what this means for OR/MS and in section 6 we conclude drawing some lessons that could be used to improve the future impact of OR in the Colombian business sector.
2 UNDERSTANDING THE ROLE OF OR IN PRACTICE
The OR/MS literature in places like the United Kingdom, United States and Europe, as well as in Asia, has tried to characterize the degree of use of its tools in practice. Most of these studies, some of which are detailed below, have focused on exploring what tools are most commonly used by scholars, consultants and organisations, and for what purposes (e.g., Ranyard, Fildes & Hu, 2015; Fildes, Crymble & Ranyard, 1999). Few studies have turned their gaze towards analysing whether or not OR/MS plays a key role in addressing fundamental problems experienced by de-veloping countries, such as poverty and the development of disadvantaged communities (Itanyi, Ewurum & Ukpere, 2012; White et al., 2011). In this section we summarise the surveys under-taken beginning with those conducted on a global basis, followed by those conducted for specific regions or countries.
Since 1993, Bain & Company, a management consulting firm, has surveyed executives world-wide about the tools most commonly used by them for decision-making and how effective they are perceived to be. In 2007, for example, Rigby & Bilodeau (2007) surveyed 1,221 executives and found that there was an increase, in comparison to results obtained in 2004, in the num-ber of organisations that used tools specifically for decision-making. Amongst the top 10 most popular tools reported were: strategic planning, customer relationship management (CRM), core competencies and customer segmentation. The authors also found that executives were more in-clined to use a particular tool, when they saw the possibility of measuring benefits and reporting convincing results.
In the UK, Bornstein & Rosenhead (1990) analysed the limited impact of OR in developing countries and argued that one of the main problem lies when scholars assume that the OR appli-cation is a simple transference of technology or knowledge without any adaptation to the local conditions. Those conditions that make developing countries different to developed countries are argued to be inter alia: poverty; lack of infrastructure; lack of awareness of the potential of OR; and cultural barriers (e.g. local businesses have more confidence in foreign consultants and con-sequently give fewer opportunities to locals, which in turn limits their growth and professional development).
White et al. (2011) also developed a critical analysis of the relevance of OR for developing countries, particularly when addressing issues related to poverty and sustainable development. They used as a primary source of data scientific articles in refereed OR journals that could be reached through ISI Web of Knowledge, EBSCO Business Source, and the ROAR (International Abstracts in Operational Research) databases. One of the aspects that the authors noted was the lack of studies that characterize the influence of OR in developing countries. In addition, they identified there was an asymmetry between pairs of regions regarding the number of reported applications (the regions considered were Asia, Africa, Middle East, and Latin America), with Latin America being the region with the lowest number of reports of OR applications.
In the UK, Jeffrey & Seaton (1995) and Clark & Scott (1995) undertook surveys of members of the OR Society with the purpose of gathering their perceptions about the usefulness of various tools in practice at the strategic level. Jeffrey & Seaton (1995) found that what increased the use-fulness and trustuse-fulness of tools lay in the hands of the analysts or facilitators when they clearly communicated the main benefits and limitations of the tools to the decision-makers. Clark & Scott (1995), on the other hand, identified the types of problems analysts were mostly involved with and the tools they tended to employ. For example, in organisational analysis the most pop-ular tools employed were simulation and spreadsheets, especially in the areas of production and finance; while for the analysis of environment, statistics and spreadsheets were used for market analysis. Within strategic analysis, In-house models, spreadsheets and simulation were widely used for generating strategic alternatives, and project management to plan their implementation. Fildes, Crymble & Ranyard (1999) explored the organizational, environmental and managerial factors influencing the success and survival of 87 OR groups within 60 organizations in the UK industry, commerce and public sector. The purpose was to understand the differences and similarities in how the groups were managed and if these characteristics had changed in the last ten years. In terms of tools, 43 respondents were asked, through a supplementary questionnaire, what tools had contributed the most to the performance of their OR groups and they pointed to spreadsheets, simulation, Soft OR and System Dynamics as the most influential ones. In terms of changes over the last ten years, the results showed that the groups employed more qualified staff, with higher quantitative skills and with more experience in the field, than in the past. Also, the authors noted that staff were more actively involved in addressing strategic-related issues within their clients’ organizations and were involved in a more variety of activities that touched broader organisational areas.
Gunn & Williams (2007) also conducted a survey in the UK with the purpose of identifying pat-terns in the use of tools that support the process of decision-making. Through factor analysis the authors showed tools were used most of the time in combination with others and that organisa-tions used different combinaorganisa-tions of approaches for strategic decision-making. In the same vain, Mingers & Taylor (1992), also in the UK, focused on exploring how Soft Systems Methodology (SSM) was used in practice. Likewise, they found that many respondents, mostly consultants, applied SSM in combination with other tools (e.g. scenario planning, cognitive mapping, critical success factors, nominal group technique, etc.), because it provided a more holistic view of the problem situation of concern. This led to a subsequent, more general study, to explore how com-mon multimethodology (MM) practice was in reality (Munro & Mingers, 2002). Results showed that MM was indeed a highly common practice and respondents reported combinations of two or three methods at the same time and of the same type, though very few mixed Soft with Hard OR approaches.
Soft OR category appeared to be used least (e.g. Analysis of stakeholders, causal diagrams, and models of viable systems).
In United States, Abdel-Malek et al. (1999) surveyed members of INFORMS in order to char-acterise the use of OR in business practice. Unlike the surveys mentioned above, this study was supplemented by in-depth interviews with a number of scholars and practitioners, seeking to extend the results of the survey. Interestingly, the results highlighted the importance of non-quantitative methods for practice, which contrasts with O’Brien’s (2011) results and with the lack of scientific papers related to Soft OR appearing in American journals (Mingers, 2011). Finally, as it was for the case of Jeffrey & Seaton (1995), Abdel-Malek et al. (1999) also point out that one of the key factors that determines the impact of OR in practice lies in the communications skills of the analyst to let his/her clients know the benefits, limitations and assumptions of the models in use.
Finally, Stenfors et al. (2007) examined the use of OR in Finland. This study was based on a survey that was applied to executives from the largest organisations in Finland. The aim was to identify what tools they used to make strategic decisions. The results suggest that only 10% of tools reported can be regarded as OR, while the remaining 90% are tools from outside the OR field, such as those from management and strategic analysis. The analysis also indicates that 70% of the OR tools employed (i.e. only 7% of the total) were mainly used for activities at functional level, while the rest were used at corporate strategy business level.
To conclude, this section demonstrates the breadth of research into OR practice with a number of different spheres of focus. One sphere is geographic in nature with studies ranging from a global concern to those focusing on specific countries. Most of the studies analysed focused on developed countries, while a few were about developing countries; to the best of our knowledge, none discusses the practice of OR in Latin American countries. Another sphere concerns the sub-jects of the research which varies between executives or decision makers and OR practitioners. Finally, the body of research covers the sphere of tool use where there is evidence of a wide variety of tools in use by practitioners.
In order to provide a full and detailed account of OR practice in the world, the work summarised above demonstrates the importance of undertaking this type of research for any country or region. Hence, given the lack of studies of this nature in Latin America, and particularly in Colombia, our aim is to contribute to the body of knowledge concerning OR practice by bridging this gap with the results of a study that aims to answer the following research question:what is the role of OR/MS for supporting the strategic decision-making processes followed by Colombian organ-isations?To do so, the next section describes the research methodology followed in this study.
3 RESEARCH METHODOLOGY
entail significant financial resources; and could have an effect on the organisation’s image. This definition may also include complex operational and logistic decisions that were made at the higher organisation levels (Eisenhardt & Zbaracki, 1992).
David (2010) classifies strategic decisions into four categories:
i) integrative strategic decisions, those that seek to expand and strengthen the productive chain of the organisation;
ii) intensive strategic decisions, that seek to develop new or penetrate known markets; iii) diversification decisions, that seek to reduce the risk when venturing into new product
areas; and
iv) defensive strategic decisions, that strengthen the competitive position of an organisation by leaving areas where the organisation has weaknesses or there is little potential.
For Porter (1980) strategic decisions can also be classified according to how the organisation wants to position itself in the market; for instance:cost leadership, when one looks for a contin-uous improvement of business processes by seeking efficiency and maximizing return; differen-tiation, when the organisation wants to distinguish itself from its competition by offering high quality or service; andfocus, when the concern is about reaching a specific or unique market niche. In the next section, the definition and classifications above will be employed to analyse the role that OR/MS may play within different types of strategic decision-making activities com-monly performed by Colombian organisations.
To provide an answer to the research question stated in the previous section, an online survey, consisting of closed as well as some open-ended questions, was developed to provide some in-sight into the role that OR/MS plays within the strategic decisions of a sample of Colombian organisations. The survey sought to identify the types of strategic decision problems most com-monly faced by managers, the tools they use to support these activities, and the steps usually taken within these organisations when making strategic decisions.
The online survey, which took participants on average 40 minutes to be complete, was based largely on the questions from O’Brien’s survey (O’Brien, 2011), with some minor adaptations due to the context. As stated earlier, O’Brien (2011) explored the links between OR/MS and strategic analysis in the UK industry and how frequently tools were employed in practice. Since we also shared the same research interests, but within a different (Colombian) context, it seemed reasonable to employ the same instrument (the survey) to gather our data and use the normative strategy process framework proposed by O’Brien & Dyson (2007) to identify the activities that comprise the strategic decision-making process. The idea was not only to accumulate evidence in favour of external validity and generalization, but also to contrast the results from both countries and see if OR/MS was used differently to inform strategic decision-making in a developed and a developing country.
within these situations. It also asked whether the organisation had a dedicated area or department for undertaking strategic planning or whether this task was performed across the organisation. Subsequently, respondents were asked about their use of tools to support different activities re-lated to strategic decision-making. They were given a list with the names and acronyms of some of the most well-known tools in the OR/MS and strategic management fields, and asked to qual-ify their degree of familiarity with and regularity of use of each tool. The survey ended with some open-ended questions where respondents were asked if their organisation followed any formal protocol for decision-making, the tools mostly employed and their effectiveness in prac-tice. The purpose of such open-ended questions was to explore in more detail the steps usu-ally taken in these organisations when making strategic decisions and gather short examples of past situations. For most of the close-ended questions, seven point Likert scales were em-ployed to capture the respondents’ perceptions. Hence, due to the nature of the data collected, non-parametric statistics were employed and will be presented in the next section to analyse the data and report the results.
Approximately 460 people were invited to participate in the study via e-mail. People from large, medium and small Colombian organisations, working at corporate level, were targeted as po-tential participants for the study, as the authors believed that they might be regularly involved in strategic decision-making. Of this group, 71 different organisations responded to the call and fully completed the closed questions. This is equivalent to a 15.4% response rate. The survey section with the open-ended questions was completed by fewer respondents.
Finally, it should be noted that in our survey and within this paper we have adopted the generic term ‘tool’ to refer to any type of device (tool, method or methodology) that may help to system-atically analyse any problematic or decision situation (Stenfors et al., 2007; Mingers & Brock-lesby, 1997).
The next section describes in detail the results and main findings of this study.
4 ANALYSIS OF RESULTS
4.1 The Sample
according to the number of employees in the organisation and their average level of annual sales. This categorization corresponds to the governmental definition used in Colombia to rank organi-sations (Ley 905, 2004), based on a market representative rate of 3049.47COP/USD reported by the Banco de la Rep´ublica de Colombia on December 6th of 2016.
Figure 1– Percentage of respondents classified by: (a) Number of employees and (b) Annual average sales.
Also, 72% of all the respondents worked as employees of an organisation, 18% were the owners of the organisation, and 7% were independent consultants (see Fig. 2).
Figure 2– Role of the respondent in the organisation.
Figure 3– Distribution of organisations participating in the survey by different industrial sectors.
4.2 Strategic decision problems faced by the sampled organisations
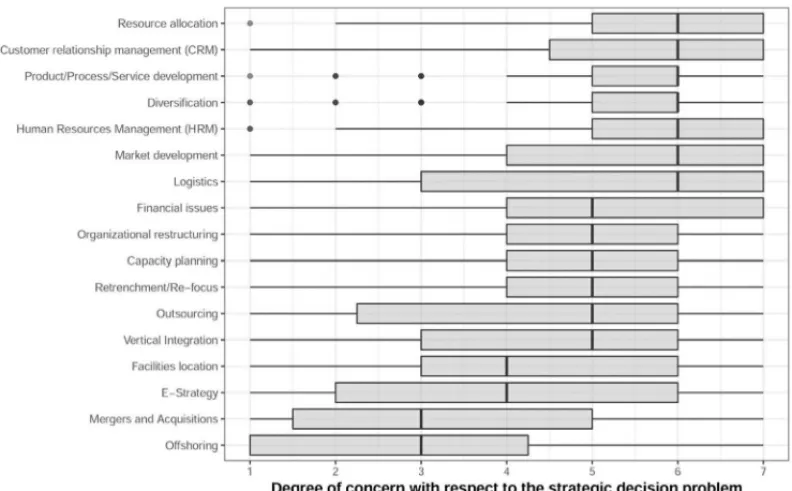
Respondents were asked how often they faced different types of strategic decision problems and a list with possible options was given. The list of options ranged from diversification, through hu-man resource hu-management, to vertical integration. Respondents were also encouraged to include any additional options not in the list. Respondents provided a score, using a 7-point Likert scale, where 1 meant“we never had faced that problem in the organisation”and 7 meant“the organ-isation regularly faces that problem”. Figure 4 shows the distribution of scores of the different types of strategic decision problems faced by respondents using a box-and-whisker plot. The activities most frequently faced, according by respondents, were: resource allocation,customer relationship management(CRM),product/service/process development,diversificationand hu-man resource hu-management; while decision problems likeoffshoring,mergersandacquisitions,
e-strategyandlocalization of facilities, had the lowest frequency response.
Table 1 shows the median score of each strategic decision problem and categorizes them follow-ing David’s (2000) and Porter’s (1980) taxonomies (see section 3). The purpose was to identify what types of strategies are more frequently faced by the managers surveyed. The results show that the strategic decision problems that fall into the category labelled ‘efficiency strategies’, consisting of five different types of problems, is the category most commonly faced by managers (5.6), followed by‘intensity strategies’(5.0),‘defence strategies’(retrenchment/ re-focus) (5.0),
‘cost reduction strategies’(4.6), and‘diversification strategies’(4.5). The type of strategy most rarely faced is‘integration strategies’(4.0), which has the lowest engagement score of all.
4.3 The strategic planning process in the sampled organisations
Figure 4– Strategies/problems.
from other departments, even though they were not part of the strategic planning team itself; while 20% only contributed in structuring strategic projects, and 7% were responsible for the strategic planning in their organisations (see Fig. 5).
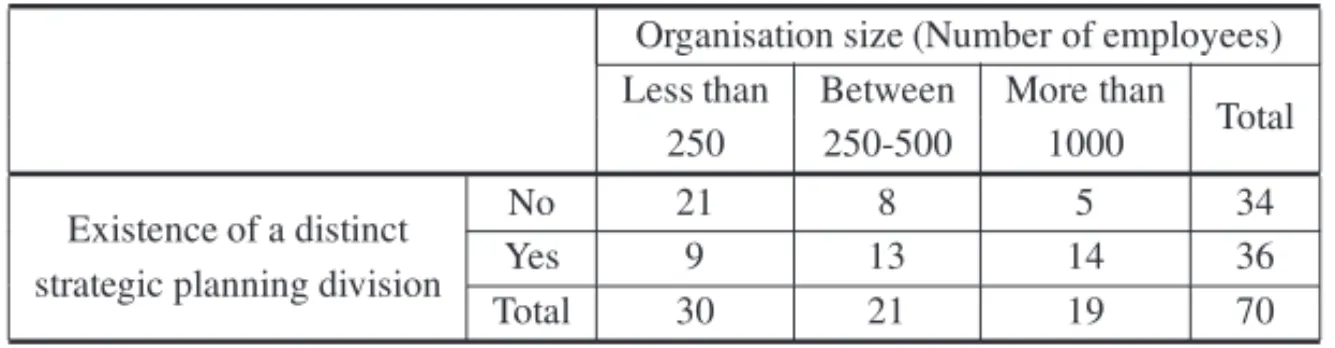
About half of the sample declared that there was a distinct department or team devoted ex-clusively for supporting strategic planning within their organisations; these were mostly within medium and large organisations. To determine whether the existence of a separate strategic plan-ning team is related to organisation size, a chi-square test was performed using the following null-hypotheses:
• Ho: There is independence between the separate existence of strategic planning and or-ganisation size;
• Ho: There is independence between the separate existence of strategic planning and the
organisation’s sales level.
The results show that, with a confidence level of 99%, the existence of a distinct department de-voted to strategic planning is related to the size of the organisation (X-squared=10.204,p-value =0.006082), either by number of employees or level of sales (X-squared=11.3323, p-value =0.003461) (see Tables 2 and 3). These results seem reasonable since large organisations could
Table 1– Categorization of strategic problems faced by the organisations.
Author David (2000) Porter (1980)
Type of strategic
decision problem Median score Integration Intensity Diversification Defensive Costs Efficiency
Resource allocation 6 1
Customer Relationship Management (CRM)
6 1
Product/Process/
Service development 6 1
Human Resources
Management (HRM) 6 1
Market development 6 1
Diversification 6 1
Logistics 6 1
Organizational
restructuring 5 1
Financial issues 5 1
Capacity planning 5 1
Retrenchment/
Re-focus 5 1 1
Outsourcing 5 1
Vertical integration 5 1
Facilities allocation 4 1
E-Strategy 4 1 1
Merges and
acquisitions 3 1 1
Offshoring 3 1
Total number of strategic decision problems
2 5 2 1 5 5
Average of the
medians by category 4.0 5.0 4.5 5.0 4.6 5.6
Table 2– Existence of a separate strategic planning division by organisation size.
Organisation size (Number of employees) Less than Between More than
Total
250 250-500 1000
Existence of a distinct No 21 8 5 34
strategic planning division Yes 9 13 14 36
Total 30 21 19 70
the sector to which the organisation belongs). Thus, a test of proportions was performed and the result establishes that, with a confidence level of 99%, the existence of a distinct strategic plan-ning team is not related to the sector to which the organisations operate (X-squared=14.658,
Figure 5– Respondent involvement in their organisation’s strategic planning.
Table 3– Existence of a separate strategic planning division by level of sales of the organisation.
Sales level (million COP) Less than Between More than
Total 5.000 5.000-50.000 50.000
Existence of a distinct No 13 7 12 32
strategic planning division Yes 2 12 20 34
Total 15 19 32 66
Figure 6– About the organisation’s strategic planning practice.
answers do not present a great heterogeneity and that most of them perceive themselves as fre-quently undertaking each one of these activities in the list; about 75% of the answers given by respondents were between scores 4 to 7.
The activities most frequently practiced appear on top of Figure 7 and there are: generation of strategic ideas;setting goalsandimplementing strategic ideas. The activities less frequently practiced (in relative terms) correspond to:assessing the externalandinternal environmentand
setting direction through vision and mission. It is not surprising thatsetting direction through mission and visionis an activity slightly less frequently practiced than the rest, because these statements usually last for several years and revisiting them implies having a large group of peo-ple, including top managers, away from their daily working activities. However, what seems more surprising is that, given today’s highly uncertain and dynamic markets, assessing the in-ternal and exin-ternal environments were not carried out with the same frequency as the rest of the activities, suggesting possible weaknesses in the decision-making processes of the surveyed organisations.
Looking at the medians obtained for each of the activities listed in Figure 7, we wanted to un-veil which of these activities have a truly median score above 5 (i.e. the top 2 ratings). Table 4 presents thep-values resulting from the application of the Wilcoxon test (Ho: Median of activity
Figure 7– Activities that support strategic planning.
significant differences between the median scores of activities when segmenting the sample in the three possible organisation sizes (in small, medium and large), by both number of employees and annual sales level. Results show that there were no significant differences by organisation size in how frequently these activities were performed, with a confidence level of 95%. This suggests that, no matter the organisation size, firms performed strategic planning similarly.
Table 4– Wilcoxon testsp-values for the frequency of venture of strategic planning activities.
Activities that support p-value must be<0,05 the strategic planning Whole sample # of employees>50
& Sales>5,000USD
Setting strategic goals 0.00 0.00
Generating strategic ideas 0.00 0.00
Evaluating strategic initiatives 0.03 0.02
Implementing strategic decisions 0.00 0.04
4.4 About the use of tools to support strategic decision-making
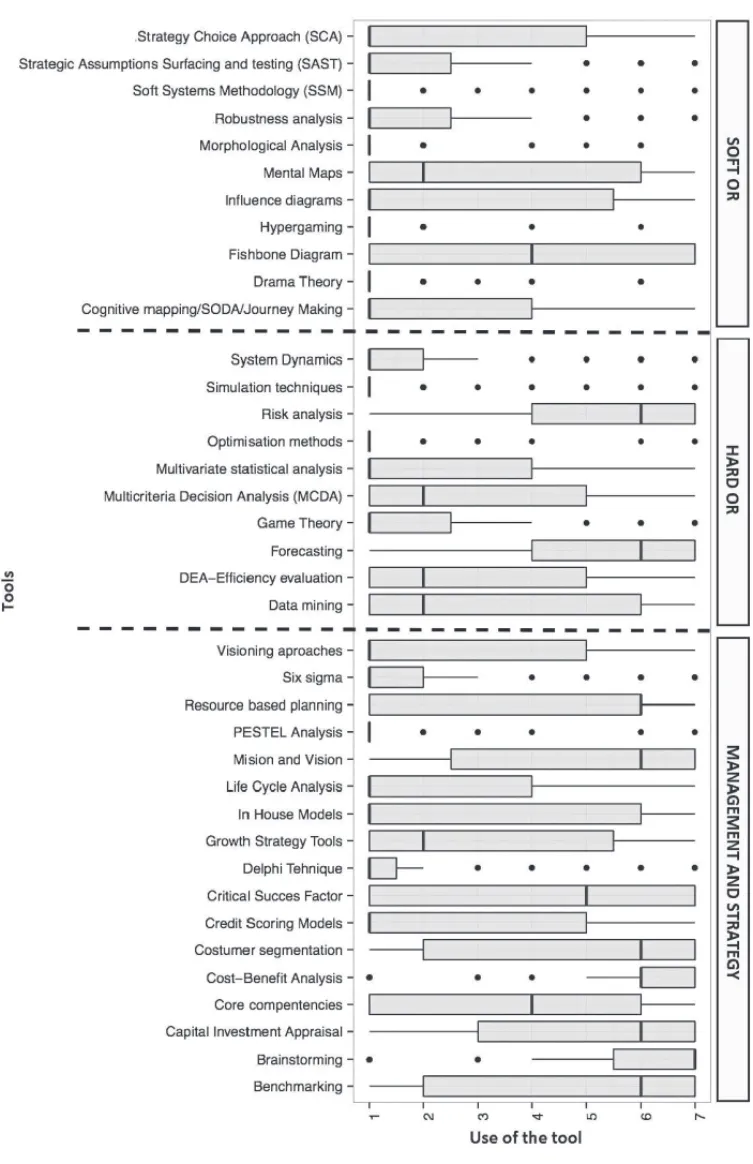
To determine the frequency of use of tools that support strategic decision-making, questions were asked about the respondents’ degree of familiarity in relation to a list of tools divided into three different categories: Hard OR, Soft OR, and Management & Strategy Tools.
Figure 8 presents the box-and-whisker plot showing the frequencies of use of the list of tools given to the respondents. Among the tools within the category of Hard OR, those reported as most frequently used wereforecastingandrisk analysis; while the least used weregame theory,
the most used tools werecost-benefit analysis,assessment of capital investment,benchmarking (or analysis of competition),brainstorming,customer segmentation,resource-based planning
andmission & visiondeclaration; the tools least used were thelife cycle analysis,visioning ap-proaches, Six Sigma,Delphi technique andPESTEL analysis. There results are coherent with the answer given earlier about the (relative) low frequency in assessing the external and inter-nal environments (Fig. 7). Fiinter-nally, within the Soft OR category, the most used tool was the
fishbone tool, while the remainder were reported as being little used or completely unknown by the respondents.
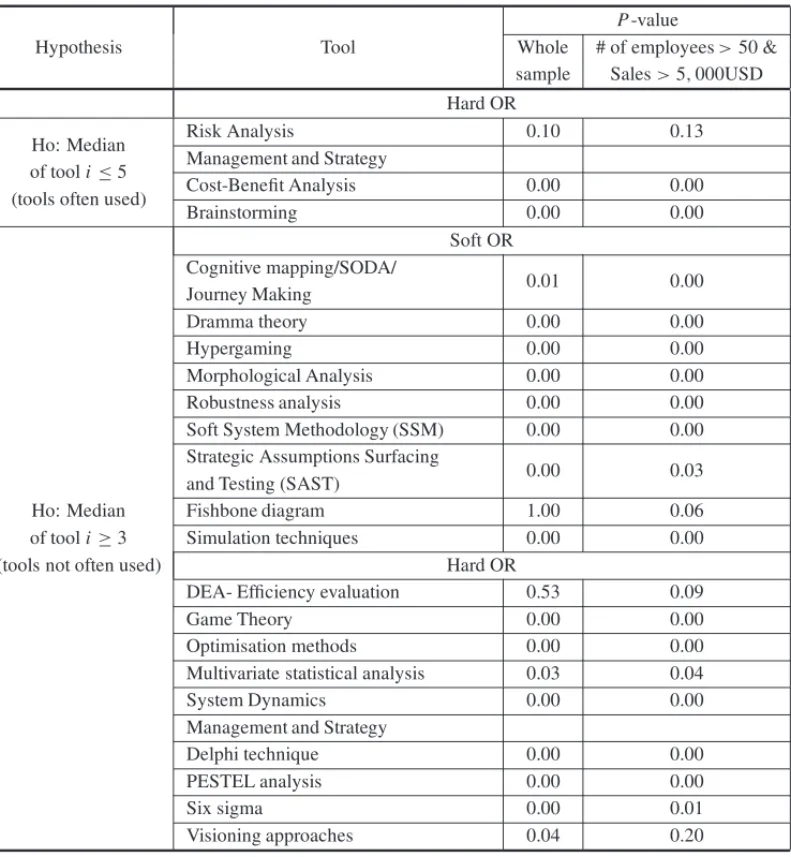
Respondents also had the chance to add tools to the given list and the tools included by them were: SWOT (1 respondent), Balanced Scorecard (2 respondents), Process Mapping (1 dent), Delta Model (1 respondent), Makigami (1 respondent), Value Stream Mapping (1 respon-dent), Scrum Meetings (1 responrespon-dent), and Five W’s and One H Approach (1 respondent). In addition, we conducted a hypothesis test to complement the information given in Figure 8 to see which tools have a truly median score of use above 5 (Ho: Median of frequency of use of the tooli ≤ 5 (tooli is not often used)) (See Table 5). The results of the Wilcoxon test, with a confidence level of 95%, show that only the toolsbrainstormingandcost-benefit analysishave a median use score higher than 5; while with a significance level of 10%, the median ofrisk analysis can also be accepted as greater than 5. In the same way, table 5 presents the results of a test that explores which of the tools have a median use score of below 3 (Ho: Median of frequency of use of the tooli ≥3) in order to determine the tools that are certainly not used (or
almost never used). The results show that several tools fall into such a category, notably those in the Soft OR group. This result holds for both the original sample of organisations surveyed and a sub-sample that excludes the small organisations. The exceptions to this finding are the tools ofFishbone diagram, andDEA-Efficiency evaluationwhich suggests that these two tools are not often used by the organisations of greater size.
Overall, it could be said that the tools with median usage scores greater than 5 belonged to the categories Management & Strategy and Hard OR; while the low usage scores of the Soft OR tools indicate that they were little used in the respondents’ organisational strategic planning practice. This conclusion was strengthened on the basis of individual Wilcoxon tests, where none of the Soft OR tools had a frequency of use significantly greater than 5. These results are consistent with the reports of O’Brien (2011) in the UK who also focused on studying the role played by OR in supporting strategy, but contrast with Ranyard et al. (2015) findings who focused on more general use of OR in practice. Hence, given the contrasting findings, it appears that people who have a more general interest in applying OR within broader contexts may be more aware of Soft OR, than those who have more specific interests in applying it into supporting strategy planning. In order to determine whether there are differences in the ratings of tool use when segmenting organisations according to their size, a Kruskal Wallis test was performed (Ho: Median of tool
i in organisations with fewer than 250 employees=Median of tooliin organisations with 250 to 1,000 employees=Median of tool in organisations with more than 1000 employees). The
Table 5– Wilcoxon testP-values for the frequency of use of tools that support the strategic planning.
Hypothesis Tool
P-value
Whole # of employees>50 & sample Sales>5,000USD Hard OR
Ho: Median Risk Analysis 0.10 0.13
of tooli≤5 Management and Strategy
(tools often used) Cost-Benefit Analysis 0.00 0.00
Brainstorming 0.00 0.00
Soft OR Cognitive mapping/SODA/
Journey Making 0.01 0.00
Ho: Median
Dramma theory 0.00 0.00
of tooli≥3
Hypergaming 0.00 0.00
(tools not often used)
Morphological Analysis 0.00 0.00
Robustness analysis 0.00 0.00
Soft System Methodology (SSM) 0.00 0.00
Strategic Assumptions Surfacing
and Testing (SAST) 0.00 0.03
Fishbone diagram 1.00 0.06
Simulation techniques 0.00 0.00
Hard OR
DEA- Efficiency evaluation 0.53 0.09
Game Theory 0.00 0.00
Optimisation methods 0.00 0.00
Multivariate statistical analysis 0.03 0.04
System Dynamics 0.00 0.00
Management and Strategy
Delphi technique 0.00 0.00
PESTEL analysis 0.00 0.00
Six sigma 0.00 0.01
Visioning approaches 0.04 0.20
(number of employees) are presented in Table 6. These results confirmed that, with a confidence level of 95%, medians of the frequency of use forsystem dynamics,SAST,fishbone,in house models,data mining, strategic growth tools,benchmarking andlife-cycle assessment do vary according to the size of the organisation. When performing the same test for the filtered sample, differences indata mining,SAST,system dynamics,in house modelsandstrategic growth tools
are supported with a confidence level of 90%, while the differences forbenchmarking,fishbone
modelsandstrategic growthtools. This is not a surprise given that the level of complexity asso-ciated with these tools and the human resources needed may not easily be met by small firms.
Table 6– Kruskal Wallis testsp-values for the differences in the use of tools by organisation size.
Tool
P-value
Tool
P-value
Whole # of employees Whole # of employees
sample >50 & Sales sample >50 & Sales
>5,000USD >5,000USD
Simulation Techniques 0.72 0.42 PESTEL analysis 0.90 0.48 Multicriteria Decision
Analysis (MCDA) 0.86 0.54 Resource-Based Planning 0.20 0.46
Brainstorming 0.40 0.43 Risk analysis 0.30 0.40
Evaluation of
capital investment 0.30 0.94 Robustness analysis 0.12 0.14 Cognitive mapping/SODA/
Journey making 0.41 0.49 Six sigma 0.60 0.56
Core competencies 0.47 0.53 Soft systems
methodology (SSM) 0.09 0.31
Cost-Benefit Analysis 0.87 0.58
Strategic assumptions surfacing and testing (SAST)
0.02 0.05
Credit Scoring models 0.66 0.64 Strategic approach of choice 0.26 0.57
Data mining 0.02 0.05 System dynamics 0.00 0.01
DEA – Evaluation
of efficiency 0.27 0.17 Vision Approach 0.32 0.24
Delphi technique 0.41 0.59 Life-cycle Analysis 0.02 0.24
Dramma Theory 0.09 0.25 In house models 0.01 0.01
Forecasting 0.76 0.35 Customer segmentation 0.57 0.67
Game Theory 0.99 0.93 Mission and vision 0.66 1.00
Optimisation methods 0.74 0.54 Strategic Growth Tools 0.04 0.09
Hypergaming 0.56 0.52 Critical success factors 0.76 0.34
Influence diagrams 0.46 0.66 Benchmarking 0.05 0.86
Morphological Analysis 0.84 0.92 Mental maps 0.47 0.67
Multivariate statistical
analysis 0.46 0.63 Fishbone diagram 0.02 0.43
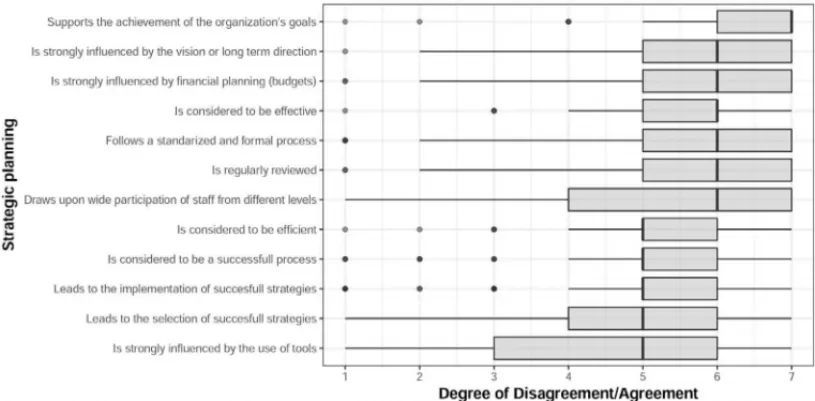
Finally, respondents were asked to rate their level of agreement or disagreement with respect to how they used tools for decision-making. The results show that, when respondents decide to employ tools for decision-making, they mostly use them in their original form. However many respondents claimed to combine tools and creatively adjust them to suit particular circumstances; and a few claimed to be able to create their own approaches (see Fig. 9). These results coincide with Munro & Mingers’s (2002) and O’Brien’s (2011) main findings. However, we were not able to confirm what kinds of combinations of tools respondents mostly perform, or how such combinations were usually done.
Figure 9– About the use of tools.
4.5 Contrasting the usage of tools with the practice of strategic activities
Our questionnaire did not ask respondents to specify which tools they employed for each strate-gic planning activity, since we were concerned that the large number of combinations resulting would put too many demands on the respondents and may discourage them from completing the survey. Instead, we created a crosstab by filtering the dataset to the cases that simultaneously exhibited a high Likert score on the usage of tools and a high Likert score on the frequency of activity engagement (scores 6 and above were considered for both cases). Table 7 presents the total number of respondents that met both conditions simultaneously. The number within paren-theses shows the percentage this represents out of the total number of respondents surveyed. The table contrasts the ratings given by respondents regarding the activities most commonly un-dertaken to support strategic planning and the tools most commonly employed by them. This analysis enables us to identify whether there are similar levels of variety in the tools used as there are in the activities respondents engage in.
To further investigate the findings discussed above, we asked respondents to answer some open-ended questions about the way they normally undertake their strategic decision-making. These results are described in the next section.
4.6 Analysis of the open-ended questions
This section presents the main findings from the analysis of the qualitative data coming from the open-ended questions of the online survey. The actual quotes coming from the survey are in Spanish and are not presented here for space reasons. The aim was to explore in more detail how the sampled organisations typically address strategic decision situations. Respondents were asked to describe in some detail the processes that they normally follow when making strate-gic decisions and to provide examples of situations that they have experienced in the past. The response rate on this part of the survey was low (18%; 13 organisations out of 71) with all those who responded coming from large organisations.
4.6.1 About the decision process
Most respondents reported that their organisations had their own bespoke processes to analyse decision situations and that they did not follow a generic approach. However, when it came to decisions involving financial and strategic issues in large organisations, most managers reported that they evaluate the attractiveness and feasibility of potential ideas through the lenses of the cost-benefit analysis technique and other financial indicators, and that the first person who usually filters the alternatives is the organisation’s chief financial officer. This coincides with the results discussed at the first part of the survey.
In addition, respondents reported that these types of decision situations are usually analysed at the highest levels of the organisation, in participatory and democratic meetings with board members, representatives of relevant stakeholders and with the assistance of technical advisers.
4.6.2 How decision problems are addressed?
4.6.3 Uncertainty
In terms of uncertainty, some respondents reported that their organisations used risk matrices to undertake two analyses. Firstly, they used them to identify potential factors that could impact different areas or businesses of the organisation. Secondly, risk matrices were used to explore ways to mitigate or avoid such potential risks. Some respondents reported that they tracked the pattern of market trends, products and costs, and collected historical data with which they con-structed scenarios to further inform their decisions. However, simulation and scenario planning did not stand out in the results of quantitative part of the survey. It appears that organisations are more inclined to use managers’ intuition and experience to make sense of the changing environment.
4.6.4 Tracking decisions already made
In terms of tracking past decisions already implemented, most respondents reported that their organisations overlook this activity altogether and those few who reported having done so in the past, employed financial indicators where, for example, the capital invested was compared to the level of investment in the initial project budget.
4.6.5 Innovation encouragement
Finally, when it comes to encouraging innovation, for example, for the creation of innovative decision options, few respondents reported having incentives or inner mechanisms within their organisations to do so. The few who did report this mentioned having occasional competitions among groups of employees to incentivise their innovation. For example, in some organisations staff are encouraged to share ideas on how improve or diversify products or services. However, mostly innovation was centralised and came from the marketing areas.
5 DISCUSSION
Here we discuss the main findings presented in the previous section within the light of our re-search question:what is the role of OR/MS for the strategic decision-making processes followed by Colombian organisations?
Second, the results indicated that respondents were actively involved in strategic decision-mak-ing, withefficiencyandintensitythe types of issues most frequently faced by the sampled organ-isations. Planning strategically was perceived by most respondents to be an important activity that contributed to the achievement of the organisations’ goals as well as an effective way to drive the organisation towards its vision. This could be why most respondents claimed that in their organisations all the strategic supported activities were frequently undertaken, from setting mission and vision to generating and evaluating strategic initiatives. However, what it is inter-esting to see is that regardless of the organisation’s size, most respondents detached this process and its activities from the need to use tools to support decision-making.
With regards to the use of tools to support strategic decision-making, our results suggested that the repertoire of options that the respondents employ was very limited. The group of Soft OR tools was the least used, with nine out of the eleven tools listed having a median of zero, and none of them having median statistically higher than five. This could have two different explana-tions: first the Soft OR literature is highly popular in Europe, but almost unknown in Colombia. Hence, the content of topics related to Soft OR in undergraduate and managerial OR/MS-related courses is almost non-existent. And second, the typical profile of those skilled enough to use Soft OR is that of an academic with at least a master’s degree from outside of the country and not an internal employee. Hard OR was the second group with the least number of tools em-ployed in practice. It had five out of the ten tools listed with a median of zero, and two of these receiving responses with the lowest possible usage score. Notably, only one of these (risk analy-sis) had a median statistically higher than five (see Table 5). This is not surprising because most of the Hard OR tools require highly technical skills that are mostly outsourced. Topics related to Hard OR, although commonly taught in higher education institutions, are mostly taught in engineering-related courses and not in managerial-related courses; this may account for the low level of awareness and usage of the tools within the sampled group. Finally, only two tools among those within the Management and Strategy group had a median usage score statistically higher than five,cost-benefit analysisandbrainstorming. It is surprising to see how some of the most popular and commonly taught tools within this group, such asPESTEL, SWOT analysis,capital investment appraisal, were not reported as to be significantly employed in practice. One expla-nation could be that some of the names or terms listed meant different things to different people, or may not have coincided with the names given to some of these tools in practice.
Most of the findings discussed above are consistent with results highlighted by other scholars. For instance, O’Brien (2011), who surveyed OR/MS practitioners, also found that the group of
Soft ORtools was among the least employed (see also Fildes and Ranyard, 1999), followed by theManagement and Strategyand theHard ORgroups (see also Clark & Scott, 1995). Also, we find coincidences with O’Brien (2011) in the respondents’ lack of use of the PESTEL tool; with Stenfors et al. (2007), Jeffrey & Seaton (1995), and O’Brien (2011) in thatcost-benefit analysis
Another striking finding was the analysis presented in Table 7, which indicates how only a few approaches or tools are apparently employed to support a wide variety of strategy-related activ-ities, from setting direction trough mission and vision to assessing and implementing strategic decision options. This suggests that one tool may be adapted and used by the respondents for a variety of different reasons, which may or may not coincide with the original purpose of the tool. This feature may be due to people’s low awareness of other less “popular” tools that are also available, or may be due to an oversimplification of the strategic activities. Dyson et al. (2007) and O’Brien (2011) describe how various tools can be used to support different strategic-related activities within a decision process and demonstrate that the relationship between tool and ac-tivity is not a one-to-one mapping; in this sense, many tools are used to support a variety of activities. A similar finding is reported by Gunn & Williams (2007) within the Management and Strategy field.
Finally, the results of the open-ended questions, although not conclusive, depict the general behaviour of Colombian organisations that can be summarised as follows: the organisations’ decision making process starts at high level corporate meetings where managers discuss the analysis of mainly financial-related spreadsheet models developed by appointed committees of experts who build comparative evaluation matrixes of the decision options under consideration. This result resonates with the findings reported by Stenfors et al. (2007) and O’Brien (2011) regarding the popularity of spreadsheet models.
In addition, once alternatives are chosen and decisions implemented, most organisations seem to overlook the need to look back at the performance of the alternatives selected and learn from experience. Also, it appears that organisations in general overlook the need to consider the un-certainty that surrounds their decision context. Although, few organisations reported the practice of developing risk matrices to develop scenarios, there is no evidence that this was a general practice among Colombian organisations.
6 CONCLUSIONS
This paper has explored the role that OR/MS plays at the corporate level of a sample of Colom-bian organisations. Primary information was collected through an online survey in order to iden-tify: the tools most commonly used in these organisations; the variety of types of decision prob-lems commonly faced; and the approaches adopted to support decision-making.
The findings of this research present a challenge to the Colombian OR community: how can the OR/MS field be made more relevant to the daily practice of these organisations? In this sense, we suggest various ideas worthy of further research, where OR/MS could positively contribute to such Colombian organisations. For example, OR/MS could be further exploited in order to improve the managers’ skills to systematically explore the organisations’ external environment and consider the uncertainty that surrounds the context of strategic decisions. Also, Soft OR tools could be introduced to enrich interventions in organisations and combine them with other tools that may be better known, such as those from the Management and Strategy field. In addition, Colombian academics and practitioners could consider using more a facilitative approach style, rather than an expert approach style, when conducting their interventions with organisations, in order to get closer to their clients and let them participate more with the modelling. This may help them see and realise the potentialities of such tools (Franco & Montibeller, 2010).
Academics and practitioners need to effectively communicate the potential benefits that OR/MS tools can bring to the table to help improve the performance of organisations (see e.g, Abdel-Malek, 1999; Jeffrey & Seaton 1995). To this end, further research focused on the development of a taxonomy or guideline framework that could easily indicate to managers which tools are best suited for the different activities within strategic analysis are worthy of consideration; such research has the potential to make the field more accessible to the general public and to thus improve its impact in practice.
Finally, we would like to highlight that the main contribution of this paper is to have explored the relevance that OR/MS has as a field, within the Colombian organisational context. This not only informs the international academic community about the level of penetration of OR/MS within a Latin-American country, but it also prompts local scholars and practitioners to make OR/MS more relevant by taking it beyond the classroom.
REFERENCES
[1] ABDEL-MALEKL, WOLFC & SPENCERI. 1999. OR Practice: survey results and reflections of practising INFORMS members.Journal of the Operational Research Society,50(10): 994–1003.
[2] ACKOFFR. 1979. The Future of Operational Research is past.Journal of the Operational Research
Society,30(2): 93–104.
[3] ARBELAEZ´ M & ZULETAL. 2003. Las Mypimes en Colombia: diagn´ostico general y acceso a los servicios financieros. Fedesarrollo, p. 4.
[4] BLENKOM, MANKINSM & ROGERS P. 2010. The decision-driven organisation. June 2010 is-sue of Harvard Business Review. Retrieved 2015 20-08, from ://hbr.org/2010/06/the-decision-driven-organisation.
[5] BORNSTEINC & ROSENHEADJ. 1990. The role of Operational Research in less developed countries: A critical approach.European Journal of Operational Research,49(2): 156–178.
[7] CHANGP & HSIEHP. 2008. Bibliometric overview of Operations Research/Management Science research in Asia. Asia-PacificJournal of Operational Research,25(2): 217–241.
[8] CHENS & WEIT. 2002. The practice of Operational Research in Taiwan.Journal of Operational
Research Society,53(12): 1330–1337.
[9] CHURCHMANC & SCHAINBLATTA. 1965. Commentary on “The researcher and the manager: A dialectic of implementation”.Management Science,12(2): B2–B42
[10] CLARKD & SCOTTJ. 1995. Strategic level MS/OR tool usage in the United Kingdom: an empirical survey.Journal of the Operational Research Society,46(9): 1041–1051.
[11] CONGRESO DE LAREPUBLICA DE´ COLOMBIA. (2 de Agosto de 2014) Ley 905 de 2014. DO: 45628. [12] DAVIDF. 2010.Strategic management: Concepts. 13th edition. Prentice Hall: New Jersey.
[13] DYSONRG, BRYANTJ, MORECROFTJ & O’BRIENF. 2007.The strategic development process. In: O’BRIENF & DYSONRG (eds). Supporting the Strategy Process: Frameworks, Methods and Models. Wiley: Chichester, pp. 3–24.
[14] EISENHARDTK & ZBARACKIM. 1992. Strategic decision making.Strategic Management Journal, 13(S2): 17–37.
[15] FILDESR, CRYMBLEW & RANYARDJ. 1999. The management of OR groups: results of a survey.
Journal of the Operational Research Society,50(6): 563–580.
[16] FORTUINL & ZIJLSTRAM. 2000. Operational Research in practice: Consultancy in industry revis-ited.European Journal of Operational Research,120(1): 1–13.
[17] FRANCOLA & MONTIBELLERG. 2010. Facilitated modelling in Operational Research.European
Journal of Operational Research,205(3): 489–500.
[18] GUNNR & WILLIAMSW. 2007. Strategic tools: an empirical investigation into strategy in practice in the UK.Strategic Change,16(5): 201–216.
[19] HAMMONDJ, KEENEYR & RAIFFAH. 1999.Smart Choices: A Practical Guide to Making Better
Decisions.Harvard Business School Press: Boston.
[20] ITANYIO, EWURUMU & UKPEREW. 2012. Evaluation of decision making criteria with special reference to quantitative and qualitative paradigms.African Journal of Business Management,6(44): 11110–11117.
[21] JEFFREYP & SEATONP. 1995. The use of Operational Research tools: a survey of Operational Research practitioners in the UK.Journal of Operational Research Society,46(7): 797–808.
[22] KAHNEMAND & TVERSKYA. 2000.Choices, values and frames. Cambridge University Press and the Russell Sage Foundation: New York.
[23] KERRN, MACCOUNR & KRAMERG. 1996. Bias in judgment: Comparing individuals and groups.
Psychological Review,103(4): 687–719.
[24] MENTZASG. 1996. Team coordination in decision support projects.European Journal of
Opera-tional Research,89(1): 70–85.
[26] MINGERSJ & TAYLORS. 1992. The use of Soft Systems Methodology in practice.Journal of the
Operational Research Society,43(4): 321–332.
[27] MINGERSJ. 2011. Soft OR comes of age – but not everywhere!Omega,39(6): 729–741.
[28] MINGERSJ. 2015. Helping business schools engage with real problems: The contribution of critical realism and systems thinking.European Journal of Operational Research,242(1): 316–331.
[29] MUNROI & MINGERSJ. 2002. The use of multimethodology in practice: results of a survey of practitioners.Journal of the Operational Research Society,53(4): 369–378.
[30] NUTTPC. 2002. Why Decisions Fail: Avoiding Blunders and Traps That Lead to Debacles. Berrett-Koehler, San Francisco.
[31] O’BRIENFA. 2011. Supporting the strategy process: a survey of UK OR/MS practitioners.Journal
of the Operational Research Society,62(5): 900–920.
[32] PORTERM. 1980Competitive Strategy: Techniques for Analysing Industries and Competitors. Free Press: New York.
[33] RANYARDJC, FILDESR & TUN-IHU. 2015. Reassessing the scope of OR practice: The Influences of Problem Structuring Methods and the Analytics Movement.European Journal of Operational
Research,245(1): 1–13.
[34] RIGBYD & BILODEAUB. 2007. Bain’s global 2007 management tools and trends survey.Strategy
& Leadership,35(5): 9–16.
[35] ROSENHEAD J. 1996. What’s the problem? An introduction to Problem Structuring Methods.
Interfaces,26(6): 117–131.
[36] SADOVYKHV, SUNDARAMD & PIRAMUTHUS. 2015. Do online social networks support decision-making?Decision support systems,70(C): 15–30.
[37] SMITHD. 2008. A bibliography of applications of Operational Research in West Africa.
Interna-tional Transactions in Operations Research,15(2): 121–150.
[38] STENFORSS, TANNERL, SYRJANEN¨ M, SEPPAL¨ A¨ T & HAAPALINNAI. 2007. Executive views concerning decision support tools.European Journal of Operational Research,181(2): 929–938.
[39] TVERSKYA & KAHNEMAND. 1974. Judgment under uncertainty: Heuristics and biases.Science, 185(4157): 1124–1131.
[40] VIDAL RVV. 2006. Operational research: a multidisciplinary field.Pesquisa Operacional, 26(1): 69–90.
[41] WHITEL, SMITHH & CURRIEC. 2011. OR in developing countries: A review.European Journal